HAL Id: hal-00104981
https://hal.archives-ouvertes.fr/hal-00104981
Submitted on 9 Oct 2006
HAL is a multi-disciplinary open access
archive for the deposit and dissemination of
sci-entific research documents, whether they are
pub-lished or not. The documents may come from
teaching and research institutions in France or
abroad, or from public or private research centers.
L’archive ouverte pluridisciplinaire HAL, est
destinée au dépôt et à la diffusion de documents
scientifiques de niveau recherche, publiés ou non,
émanant des établissements d’enseignement et de
recherche français ou étrangers, des laboratoires
publics ou privés.
Taurus-Auriga Star Forming Region
Luigi Scelsi, Antonio Maggio, Giuseppina Micela, Ignazio Pillitteri, Beate
Stelzer, Kevin Briggs, Manuel Güdel, Nicolas Grosso, Marc Audard, Francesco
Palla
To cite this version:
Luigi Scelsi, Antonio Maggio, Giuseppina Micela, Ignazio Pillitteri, Beate Stelzer, et al.. New
Pre-Main Sequence Candidates in the Taurus-Auriga Star Forming Region. Astronomy and Astrophysics
- A&A, EDP Sciences, 2007, 468 (2), pp.405-412. �hal-00104981�
21st August 2006
New pre-main sequence candidates
in the Taurus-Auriga star forming region
L. Scelsi
1, A. Maggio
2, G. Micela
2, I. Pillitteri
2, B. Stelzer
2, K. Briggs
3, M. G¨udel
3, N. Grosso
4, M. Audard
5, and F.
Palla
6.
1 Dipartimento di Scienze Fisiche ed Astronomiche, Sezione di Astronomia, Universit`a di Palermo, Piazza del Parlamento 1, I-90134 Palermo,
Italy
2 INAF - Osservatorio Astronomico di Palermo, Piazza del Parlamento 1, I-90134 Palermo, Italy 3 Paul Scherrer Institut, W¨urenlingen and Villigen, CH-5232 Villigen PSI, Switzerland
4 Laboratoire d’Astrophysique de Grenoble, Universit´e Joseph-Fourier, 414, rue de la Piscine, F-38041 Grenoble Cedex, France 5 Columbia Astrophysics Laboratory, Mail Code 5247, 550 West 120th Street, New York, NY 10027, USA
6 INAF - Osservatorio Astrofisico di Arcetri, Largo E. Fermi 5, I-50125 Firenze, Italy
Received, accepted
Abstract
Aims.We have studied the X-ray source population of the Taurus Molecular Cloud (TMC) to search for new members of the Taurus-Auriga star forming region.
Methods.Candidate members have been selected among the X-ray sources detected in 24 fields of the XMM-Newton Extended Survey of the Taurus Molecular Cloud, having an IR counterpart in the 2MASS catalog, based on color-magnitude and color-color diagrams. Their X-ray spectral properties have been compared with those of known members and other X-ray sources in the same fields but without a NIR counterpart. A search for flare-like variability in the time series of all new candidates and the analysis of the X-ray spectra of the brightest candidates have been used to identify sources with a high probability of membership.
Results.We have found that 347 of 1909 detected X-ray sources have an infrared counterpart in the 2MASS catalogue. Among them, we have selected 57 sources that are consistent with being new pre-main sequence star candidates at the distance of the Taurus-Auriga star forming region; the X-ray spectral properties of this sample are, on the whole, similar to the properties of known TMC members and different from those of X-ray sources without an IR counterpart, most of which are likely to be of extragalactic origin. For 12 such candidates, the likelihood of membership is very high, based on the relatively high plasma temperatures derived from their X-ray spectra and/or the observation of powerful flares in their light curves.
Key words.X-rays: stars – Galaxy: Open Clusters and Associations: Individual: Name: Taurus Molecular Cloud – stars: activity – stars: coronae – stars: pre-main-sequence – stars:luminosity function, mass function
1. Introduction
Stellar population studies in star forming regions (SFR) are of fundamental importance to address issues related to the forma-tion of stars and planets and the evoluforma-tion of stellar properties during the early stages of their life. These issues include the determination of the stellar Initial Mass Function (IMF), which is an important test for theories of fragmentation and gravita-tional collapse of molecular clouds that lead to star formation, as well as the study of the strong magnetic activity (and its early evolution) responsible for the high levels of X-ray emission in young low-mass stars.
Send offprint requests to: L. Scelsi, e-mail: [email protected]
In this context, X-ray observations have proven to be an important method to discover new pre-main sequence stars. Owing to their intense X-ray emission, from 10 to 104 times the solar level (e.g. Feigelson & Montmerle 1999; Stelzer & Neuh¨auser 2001; Ozawa et al. 2005), and to the relatively low interstellar absorption at these wavelengths, X-ray observations are particularly efficient in detecting the population of young objects, namely classical T Tauri stars (CTTs), i.e. stars still ac-creting material from a circumstellar disk, and ”weak-lined” T Tauri stars (WTTs), where accretion has ended and whose disks are thin or even absent (Walter et al. 1988). Optical and infrared surveys have so far identified many classical and ”weak-lined” T Tauri stars, although they may favour the detection of CTTs, because of their strong Hα emission and IR excess. X-ray ob-servations can serve as a complement to optical/IR searches
for new young stars, especially those of very low mass because they are more easily detected at X-ray wavelengths. Moreover, since the WTTs are generally less absorbed than CTTs, the for-mer are expected to be more efficiently selected in X-ray sur-veys, thus helping to reduce the bias mentioned above.
The detection of WTTs is also particularly important to es-timate the fraction of stars at a certain age and in a certain en-vironment having a circumstellar disk, and hence to estimate the disk life times. This information is fundamental to under-standing the evolution of the angular momentum during the earlier phases of the stellar life, as well as for studies on the formation of planetary systems. In the nineties, several ROSAT studies (e.g., Neuh¨auser et al. 1995; Sterzik et al. 1995; Alcala et al. 1995) detected a widely dispersed stellar population in Taurus, but also around other star-forming regions. These stars may have drifted away from their location of formation, or have been formed at their present location while the molecu-lar clouds have dispersed. However, their status as weak-lined T Tauri stars has been debated, based on arguments that favor ages beyond the ZAMS age (e.g., Briceno et al. 1997).
The Taurus Molecular Cloud (TMC) is one of the nearest star forming regions (d ∼ 140 pc) and covers a large portion of the sky (∼ 100 square degrees); the currently known members (∼ 350) of this cloud complex are spatially distributed with rel-atively low density (1 − 10 pc−3) and their ages range typically from 1 to 10 Myr. The stellar mass function of this star forming region has been investigated by Brice˜no et al. (2002), Luhman et al. (2003a) and Luhman (2004), and recently updated by Guieu et al. (2006) with the identification of 5 new very low-mass stars and 12 brown dwarfs; it appears different from the IMF of denser regions, such as Orion and IC 348 (Muench et al. 2002; Luhman et al. 2003b, respectively), suggesting a possi-ble dependence of the shape of the IMF on the environment. The Taurus IMF shows a peak at higher masses (∼ 0.8M vs ∼ 0.2M in Orion and IC 348), very few stars more massive than ∼ 1M and a rather flat low-mass tail. A possible inter-pretation of this unusual IMF has recently been given in terms of core collapse and fragmentation, jointly with the ejection of very low- and substellar-mass embryos (Goodwin et al. 2004). However, more complete studies of the Taurus population are needed to assess the shape of the IMF with greater confidence, especially at the low-mass end.
The densest regions of Taurus have been surveyed by XMM-Newton, thus allowing a detailed study of the X-ray emission from young objects of this SFR. In particular, XMM-Newton has recently observed 19 regions, with a circular field of view with a diameter of ∼ 30 arcmin and an exposure time of ∼ 30 ks each; together with 8 more fields in the archive, these observations are the basis for the XMM-Newton Extended Survey of the Taurus Molecular Cloud (XEST), presented in detail in G¨udel et al. (2006). The total surveyed area covers about 5 square degrees of the TMC and contains about 150 known members, mainly classical and ”weak-lined” T Tauri stars, but also protostars, brown dwarfs and a few Herbig Ae/Be stars and other members with uncertain classification.
This work focuses on the search for new pre-main sequence candidates among the X-ray detected sources in the fields of this XMM-Newton survey, also employing the near infrared
data from the 2MASS point source catalogue (Skrutskie et al. 2006). The paper is organized as follows: Sect. 2 summarizes the main information about the observations analyzed here, the data reduction and the source detection procedure; in Sect. 3 we describe the method used to identify potential new TMC members and present the list of such candidates, while we dis-cuss the global X-ray properties of different samples of XEST sources in Sect. 4. We discuss the temporal variability of all newly identified candidates and the analysis of the EPIC PN spectra of the brightest candidates in Sect. 5. In Sect. 6 we dis-cuss the possible implications of our findings on the Taurus IMF. Our results are summarized in Sect. 7.
2. Observations and source detection
The present work is based on X-ray data taken with the European Photon Image Camera (EPIC MOS and EPIC PN, Turner et al. 2001; Str¨uder et al. 2001) located in the fo-cal plane of the X-ray telescopes on board XMM-Newton. These non-dispersive CCD detectors, with spectral resolution R = E/∆E ∼ 5 − 50 in the range 0.1 − 10 keV, and the mir-rors provide a spatial resolution of ∼ 4 − 500and effective areas of ∼ 1200 cm2 (PN) and ∼ 400 cm2 (MOS1 and MOS2) at 1.5 keV.
Among the observations analyzed in this study, the new ones (fields XEST-02 to XEST-20) were obtained in two sep-arate periods (August-September 2004 and February-March 2005) and have PN exposure times ranging from 27 to 35 ks, while the five fields1 in the archive were observed for longer times (35−63 ks, see below the case of XEST-26). For all fields of the XMM-Newton survey of Taurus we have data from all three EPIC instruments, except for the field XEST-26 (around SU Aur) which lacks the PN data (the MOS exposures for this observation are ∼ 127 ks). All PN and MOS cameras were operated in full window mode, except for the field XEST-20 (around V773 Tau) where MOS2 was operated in small win-dow mode, and the medium filter was applied in all observa-tions, with the exception of the fields XEST-26 and XEST-27 (around ζ Per) where the thick filter was used. All observa-tions were processed using SAS v6.1. We refer to the paper by G¨udel et al. (2006) for more details about the observations and the data reduction. The same paper gives also details relevant to the procedure used to detect X-ray sources in the EPIC im-ages. In brief, source detection was performed on the sum of PN, MOS1 and MOS2 images, in three different bands, i.e.full (0.5 − 7.3 keV), soft (0.5 − 2 keV) and hard (2 − 7.3 keV) band; the choice of these bands was mainly based on considerations on the expected spectra of the sources of interest and on the en-ergies of strong features in typical EPIC background spectra. Time filtering of the images, yielding the Good Time Intervals (GTI), was applied to remove time ranges affected by high level 1 The field L1495 around V410 Tau was observed twice; the two
observations are labelled XEST-23 and XEST-24. The fields around T Tau, AA Tau and BP Tau (XEST-01, XEST-25 and XEST-28, respec-tively) were not used; these are outlying fields, containing only one known TMC member each in the cases of XEST-25 and XEST-28, and three known members, but far away from the rest of TMC, in the case of XEST-01.
of background emission and to maximize the signal-to-noise ratio of weak sources. Two source detection algorithms were used in sequence: the PWXDETECT method by Damiani et al. (1997), based on the wavelet transform of the X-ray image, was employed to locate source candidates which were confirmed or rejected afterwards by a maximum likelihood fitting of the spatially-dependent PSF using the SAS task EMLDETECT. The whole procedure was calibrated through extensive simu-lations so as to give one expected spurious detection per field due to fluctuations of the background. Moreover, clearly spu-rious sources were removed, such as detections in the diffrac-tion features of bright sources. Typically, the number of X-ray sources in each field is between 50 and 100; in total, the num-ber of detected sources from this survey is about 2000. The detection limit in each field depends on the off-axis angle and on the exposure time obtained after excluding the time intervals of high background radiation; for a typical observation with an average background contamination level, the X-ray luminos-ity detection threshold (at the distance of the Taurus Molecular Cloud) is ≈ 9 × 1027erg s−1on-axis and ≈ 1.3 × 1028erg s−1at 100off-axis for an X-ray source with a characteristic thermal spectrum having average temperature of the order of ∼ 10 MK and hydrogen column density NH=3 × 1021cm−2. Most of the detected sources have no infrared counterpart in the 2MASS catalogue and are likely of extragalactic origin (see Sect. 4), while many of the X-ray sources with IR counterpart lack any identification in the SIMBAD database. We detected 121 of 153 known TMC members in the analyzed fields; their X-ray properties are discussed in companion papers by G¨udel & et al. (2006); Briggs & et al. (2006a,b); Grosso & et al. (2006); Stelzer et al. (2006); Telleschi et al. (2006); Telleschi & et al. (2006); Franciosini & et al. (2006); Audard et al. (2006); Silva & et al. (2006), while in the present work they have been used for comparison purposes with the other sources.
3. Selection of new TMC candidate members
In order to find possible new members of the Taurus-Auriga star forming region among the XEST sources, we identified these X-ray sources with NIR counterparts in the 2MASS point source catalogue, and plotted their position in IR color-magnitude and color-color diagrams.
After correcting the X-ray source coordinates for system-atic offsets in the boresight positions (G¨udel et al. 2006), we searched for possible IR counterparts to each X-ray source within a radius of 300 from its centre. This choice ensures . 1 false association per field and leads to 347 X-ray sources asso-ciated with a point-like source listed in the 2MASS catalogue.
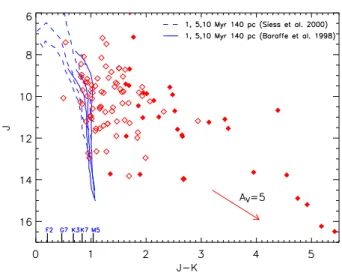
We used the tables reported in G¨udel et al. (2006) and the SIMBAD database to identify respectively known members of the TMC and other sources already known to be non-members of the TMC. At this stage, we considered all the sources with accurately measured IR photometry in the J, H and Ksbands, i.e. we excluded a few 2MASS sources with upper limits of at least one magnitude, or whose measurements are flagged as inaccurate in the catalogue because of contamination from ex-tended sources or image artifacts. We report the positions of the selected sources in the J vs J − Ks and H vs H − Ks
di-agrams (Fig. 1) together with the isochrones at 1, 5 and 10 Myr of Siess et al. (2000) and Baraffe et al. (1998), calculated for a distance of 140 pc. Assuming a geometrical extension of the molecular cloud of ∼ 15 pc leads to a spread of the tracks within ∼ 0.25 magnitudes. The J, H and Ksmagnitudes are not corrected for reddening. Fig. 2 shows the J − H vs H − Ks dia-gram. We selected sources satisfying the following criteria: (i) position in the color-magnitude diagrams above or compatible with the evolutionary models at 10 Myr within the error bars; (ii) J and H magnitudes lower than 16.5 and 15.5 respectively, which allows us to also include possible moderately absorbed brown dwarfs (the evolutionary models of Baraffe et al. extend down to 0.02 M ) and, at the same time, to avoid significant contamination of the sample with background objects; (iii) for sources lying on (or close to) the evolutionary models in the color-magnitude diagrams, that would indicate low absorption if they are members of this SFR, the same indication of low absorption must also be present in the color-color diagram.
The sample of photometric candidate members selected in this way contains 57 XEST sources reported in Table 1. Figures 1 and 2 show that most of the candidates tend to occupy the portions of the diagrams indicating lower absorption (or opti-cally thinner disks) with respect to the known members, as we could expect from a WTTs-dominated population. From Fig. 2 we also note that only two candidates (XEST-02-005 and XEST-06-045) show a clear IR excess, since they lie outside the region of the color-color diagram where stars with no ex-cess reddening are expected to be. However, several classical T Tauri stars2 of the TMC are located within this region (G¨udel et al. 2006), hence we can not rule out that new CTTs may be found among our candidates.
Table 1 contains information about the main X-ray and IR properties of our candidates. Note that four candidates (XEST-23-065, XEST-03-033, XEST-08-033 and XEST-08-049) are reported twice in the table with different XEST names, since they were detected by XMM-Newton in two overlapping fields. X-ray count-rates (CR) are on-axis equivalent rates for the PN in the 0.5 − 7.3 keV band, averaged over the entire observa-tion; for the sources XEST-03-028, XEST-07-005, XEST-17-043, XEST-27-084 and XEST-08-003, that show a quiescent phase preceeded or followed by a strong flare (see Sect. 5), we report also the values representing the quiescent level. The X-ray luminosities, in the 0.3−10keV band, were estimated from count-rates as follows. Using data relevant to the known TMC members surveyed by XMM-Newton (G¨udel et al. 2006), LX was found to be proportional to the PN on-axis count-rate with the conversion law:
LX,30=(a NH,22+b) CR , a = 19.8 ± 1.6 , b = 4.2 ± 0.7
where LX,30 is in units of 1030erg s−1 and NH,22 in units of 1022cm−2.
The same law was assumed for our sample of candidates, for which the NHwas estimated using approximate visual ab-sorptions from the color-color diagram3 and the relation for
2 About half of the 121 detected known TMC members are
proto-stars and CTTs.
3 Note that reasonable estimates of A
Vare obtained from the
Figure 1. Infrared color-magnitude diagrams with the observed (i.e.
not dereddened) positions of the IR counterparts to the XEST X-ray sources. Known TMC members are shown as filled diamonds and as-terisks (asas-terisks are protostars), candidate members as open squares and sources that are not selected as new candidates as open diamonds. Isochrones of 1, 5 and 10 Myr (solid and dashed lines), calculated at 140 pc, are superimposed. The reddening vectors from the extinction laws by Rieke & Lebofsky (1985) are also shown.
the interstellar medium between NH and AV. In our Galaxy the ratio NH/AV is found in the range 1.8 − 2.2 × 1021cm−2 (Ryter et al. 1975; Gorenstein 1975; Bohlin et al. 1978; Whittet 1981; Predehl & Schmitt 1995; Ryter 1996); we used the con-version NH = 2 AV ×1021cm−2. For the 5 flaring sources mentioned above, LX refers to the quiescent emission. For 9 bright X-ray candidates (09-042, 08-049, 20-071, 08-014, 09-033, 08-033, XEST-17-059, XEST-05-027 and XEST-15-034) we report the lumi-nosities derived directly from spectral fitting of the PN data (Sect. 5, Table 2); we have verified that in these cases the lumi-nosities are in good agreement with the values obtained from
consistent with the finding that our sample could be dominated by WTTs.
Figure 2. Infrared color-color diagram with the observed (i.e. not
dereddened) positions of known TMC members and candidate mem-bers (symbols are as in Fig. 1). The solid and dashed lines are the 10 Myr models by Baraffe et al. (1998) and Siess et al. (2000) respec-tively. The reddening vector is shown. The dotted lines bracket the region where stars with no excess reddening are expected to lie.
converting count-rates into LX. Individual errors on LXare not reported, due to the approximations of the relationship above, the uncertainty on the estimated AVand to the intrinsical vari-ability of T Tauri stars (typically within a factor of 2). Overall, the X-ray luminosities are uncertain by 0.2 − 0.3 dex.
4. Analysis of X-ray spectral properties
In this section we compare the X-ray spectral properties of our TMC candidates with those of known members and X-ray sources without IR counterparts. For this study, we used the EPIC PN data in the 0.5 − 7.3 keV band. Source events were extracted from circular regions whose extentions were calcu-lated so as to maximize the source signal-to-noise ratio and to exclude the events of possible nearby contaminating sources: the extraction radii for the sources listed in Table 1 are in the range ∼ 1000−5000. For the background photons, we used an-nular regions around the source and also excluded the events in elliptical regions of close sources overlapping within the annu-lus.
The analysis presented here has been conducted using di-agrams analogous to color-color X-ray plots: in particular, we employed the quantile-based method proposed by Hong et al. (2004), which is useful when dealing with low-count sources, as are most of ours. Instead of working with predefined en-ergy bands to derive hardness-ratios, a procedure which does not allow us to optimize the statistics for all sources at the same time4, we determined for each source spectrum the en-ergy value that divides the detected photons in predefined frac-tions of the total counts. In particular, following Hong et al., 4 The counts in each band depend on the spectral shape of the
Table 1. List of all candidate members. ”XEST id” refers to the name of the X-ray source in the XEST catalogue (G¨udel et al. 2006, the first
2 digits mark the field of the survey). RA X and DEC X are the coordinates of the X-ray source (corrected for boresight shift). CR is the equivalent on-axis count-rate for the PN in the 0.5 − 7.3 keV band, averaged over the entire observation (see notes for the quiescent level of the sources with strong flares). LX is estimated in the 0.3 − 10 keV band from CR (see text), except where noted. A ”y” in the column ”var”
means that the X-ray source was found to be variable according to the maximum likelihood algorithm described in Sect. 5. The 7thcolumn is
the designation of the infrared counterpart in the 2MASS catalogue; ”offset” is the distance between the positions of the X-ray source and its IR counterpart; J, H and Ksare the infrared magnitudes reported in the 2MASS catalogue. Sources in bold face are the most probable candidates
on the basis of light curve and/or spectral analysis (Sect. 5).
XEST id RA X DEC X CR (CRquiesc) LX var desig. 2MASS offset J H Ks
h m s deg 0 00 cts ks−1 1028erg s−1 arcsec mag mag mag
27-021 3 53 36.36 +31 52 4.1 1.1 ± 0.3 0.72 y 03533637+3152044 0.39 15.24 14.58 14.21 27-022 3 53 37.41 +32 4 59.2 7.9 ± 0.8 5.6 03533730+3204582 1.56 8.38 7.91 7.78 27-084 3 54 10.70 +31 48 57.6 18.0 ± 0.7a 8.4 y 03541064+3148573 0.73 12.39 11.64 11.36 27-130 3 54 40.39 +31 53 11.0 8.4 ± 0.6 3.6 y 03544037+3153107 0.28 13.32 12.70 12.34 06-006 4 03 49.93 +26 20 38.2 2.4 ± 0.6 1.0 04034997+2620382 0.63 13.28 12.66 12.34 06-041 4 04 24.49 +26 11 12.9 17.1 ± 1.1 7.3 04042449+2611119 0.90 12.10 11.45 11.19 06-045 4 04 27.62 +26 8 33.7 1.5 ± 0.5 0.63 04042766+2608349 1.42 14.63 14.03 13.50 20-045 4 14 15.84 +28 18 18.8 1.0 ± 0.2 1.9 04141588+2818181 0.89 14.05 12.98 12.47 20-063 4 14 42.90 +28 21 9.3 1.3 ± 0.4 4.3 04144294+2821105 1.40 14.26 12.77 12.07 20-066 4 14 47.22 +28 3 5.5 7.1 ± 0.8 3.0 04144739+2803055 2.30 10.80 10.17 9.92 20-071 4 14 52.35 +28 6 0.5 159 ± 3 171b 04145234+2805598 0.68 9.53 8.21 7.71 23-062 4 19 1.15 +28 37 10.8 1.4 ± 0.4 0.61 04190125+2837101 1.48 11.81 11.14 10.88 23-065 4 19 6.96 +28 26 10.3 1.8 ± 0.3 5.3 04190689+2826090 1.50 14.90 13.57 12.88 24-057 4 19 6.85 +28 26 8.8 2.7 ± 0.5 8.1 =XEST-23-065 16-045 4 20 39.12 +27 17 31.6 30.4 ± 2.4 13 04203918+2717317 0.86 10.50 9.86 9.56 21-026 4 21 40.18 +28 14 21.6 2.1 ± 0.4 0.9 04214013+2814224 1.05 11.93 11.34 11.03 11-035 4 21 43.59 +26 47 20.7 2.1 ± 0.5 0.9 04214372+2647225 2.59 9.61 8.98 8.83 11-078 4 22 15.65 +26 57 6.5 9.4 ± 0.5 23 y 04221568+2657060 0.60 13.81 12.62 12.03 11-087 4 22 24.04 +26 46 25.6 13.4 ± 1.1 16 04222404+2646258 0.19 11.09 10.19 9.77 21-059 4 22 25.63 +28 12 33.4 8.9 ± 0.8 6.1 04222559+2812332 0.40 9.26 8.75 8.62 11-088 4 22 27.18 +26 59 51.1 2.1 ± 0.3 1.6 04222718+2659512 0.19 15.28 14.59 14.19 21-073 4 22 48.77 +28 22 59.9 3.6 ± 0.3 2.7 04224865+2823005 1.58 14.51 13.81 13.45 02-005 4 26 34.97 +26 8 16.2 2.9 ± 0.6 5.7 04263497+2608161 0.07 15.79 14.77 13.93 02-069 4 27 58.65 +26 11 6.3 1.7 ± 0.4 0.71 04275871+2611062 0.82 10.67 10.00 9.85 13-002 4 28 58.45 +24 36 49.3 5.2 ± 1.2 17 04285844+2436492 0.03 13.27 11.70 11.07 13-010 4 29 36.07 +24 35 54.7 22.1 ± 1.1 68 04293606+2435556 1.00 10.78 9.39 8.66 15-034 4 29 36.17 +26 34 23.4 24.4 ± 1.0 10b y 04293623+2634238 0.90 11.56 10.94 10.65 15-075 4 30 17.10 +26 22 28.3 24.6 ± 2.5 10 04301702+2622264 2.09 11.80 11.16 10.91 14-034 4 30 25.21 +26 2 57.2 0.8 ± 0.3 0.35 04302526+2602566 0.89 11.06 10.46 10.24 13-036 4 30 41.61 +24 30 43.0 3.6 ± 0.9 1.5 04304153+2430416 1.68 10.22 9.60 9.38 19-002 4 31 46.26 +25 58 39.3 3.1 ± 0.9 2.0 04314634+2558404 1.65 13.33 12.62 12.31 22-071 4 31 58.57 +18 18 42.1 2.2 ± 0.3 1.3 04315860+1818408 1.30 10.27 9.48 9.22 22-111 4 32 26.80 +18 18 23.0 9.9 ± 1.3 7.5 y 04322689+1818230 1.30 12.80 12.00 11.69 22-114 4 32 29.40 +18 13 58.5 31.4 ± 1.5 34 04322946+1814002 1.93 14.46 13.69 13.17 19-041 4 32 35.85 +25 52 22.6 1.1 ± 0.2 0.94 04323605+2552225 2.75 15.20 14.45 14.10 03-028 4 32 39.45 +24 27 4.6 16.6 ± 1.0a 4.1 y 04323949+2427043 0.62 14.53 12.96 12.30 03-033 4 32 59.20 +24 30 40.2 2.5 ± 0.6 5.7 04325921+2430403 0.25 16.48 15.27 14.66 04-005 4 32 59.12 +24 30 40.8 4.9 ± 0.7 11.3 =XEST-03-033 19-083 4 33 24.99 +25 59 25.7 6.3 ± 0.7 5.9 y 04332491+2559262 1.13 14.38 13.61 13.24 17-036 4 33 26.28 +22 45 29.2 24.2 ± 1.1 61 04332621+2245293 0.98 11.80 10.50 9.92 17-043 4 33 33.03 +22 52 52.7 20.4 ± 0.9a 1.2 y 04333301+2252521 0.57 15.40 14.80 14.40 17-059 4 33 52.50 +22 56 27.0 57.4 ± 1.9 40b 04335252+2256269 0.33 10.24 9.47 9.11 04-060 4 33 55.57 +24 25 1.1 1.3 ± 0.3 0.74 04335562+2425016 0.94 10.06 9.29 9.00 18-059 4 34 33.11 +26 2 42.0 6.7 ± 1.1 2.9 04343322+2602403 2.25 11.18 10.54 10.28 12-012 4 34 51.50 +24 4 43.9 3.3 ± 0.8 3.7 04345164+2404426 2.41 13.19 12.37 11.97 08-003 4 34 56.86 +22 58 35.8 331 ± 6a 162 y 04345693+2258358 1.03 10.47 9.59 9.27 08-014 4 35 13.23 +22 59 19.5 62.9 ± 1.9 30b y 04351316+2259205 1.36 11.13 10.53 10.25 08-027 4 35 36.53 +23 5 0.8 5.3 ± 0.7 8.3 04353651+2304590 1.69 16.19 15.17 14.72 08-033 4 35 42.05 +22 52 22.6 27.2 ± 0.9 38b 04354203+2252226 0.14 11.25 10.39 9.99 09-023 4 35 42.00 +22 52 22.1 28.7 ± 1.9 29 =XEST-08-033 08-047 4 35 52.07 +22 55 3.5 5.8 ± 0.6 9.5 04355209+2255039 0.58 11.31 10.23 9.81
Table 1. Continued.
XEST id RA X DEC X CR (CRquiesc) LX var desig. 2MASS offset J H Ks
h m s deg 0 00 cts ks−1 1028erg s−1 arcsec mag mag mag
08-049 4 35 52.91 +22 50 58.9 118 ± 2 115b y 04355286+2250585 0.63 10.99 10.11 9.75 09-033 4 35 52.85 +22 50 57.6 81 ± 3 68b =XEST-08-049 09-042 4 35 58.98 +22 38 35.3 269 ± 3 172b y 04355892+2238353 0.67 9.32 8.60 8.37 05-027 4 40 3.49 +25 53 55.4 109 ± 5 202b 04400363+2553547 2.10 9.81 8.48 7.91 07-005 4 40 39.12 +25 40 3.9 8.3 ± 0.7a 4.4 y 04403912+2540024 1.46 15.61 14.66 14.11 10-016 4 42 3.85 +25 19 56.0 0.9 ± 0.3 1.5 04420376+2519533 2.86 15.07 14.04 13.55 26-031 4 55 38.46 +30 31 45.4 0.8 ± 0.2 0.66 04553844+3031465 1.16 11.35 10.56 10.25 26-052 4 55 48.21 +30 30 14.9 4.7 ± 0.3 2.0 y 04554820+3030160 1.15 11.89 11.22 10.95 26-062 4 55 55.99 +30 36 20.6 9.5 ± 0.4 8.6 y 04555605+3036209 0.94 10.47 9.66 9.27 26-135 4 56 29.47 +30 36 11.5 0.8 ± 0.2 1.0 04562935+3036115 1.51 15.28 14.48 13.93
aQuiescent count-rates (cts ks−1) for sources with strong flares: 15.0 ± 4.3 (XEST-27-084), 1.2 ± 0.7 (XEST-03-028), 2.9 ± 2.3 (XEST-17-043),
180 ± 40 (XEST-08-003), 2.7 ± 2.0 (XEST-07-005).
bObtained from spectral fitting of PN data (see Sect. 5).
we used the median (50%) and the quartiles (25% and 75%) to define the quantile Q50 = (E50%−Emin)/(Emax−Emin) (with Emax = 7.3 keV and Emin = 0.5 keV), and analogous expres-sions for Q25and Q75.
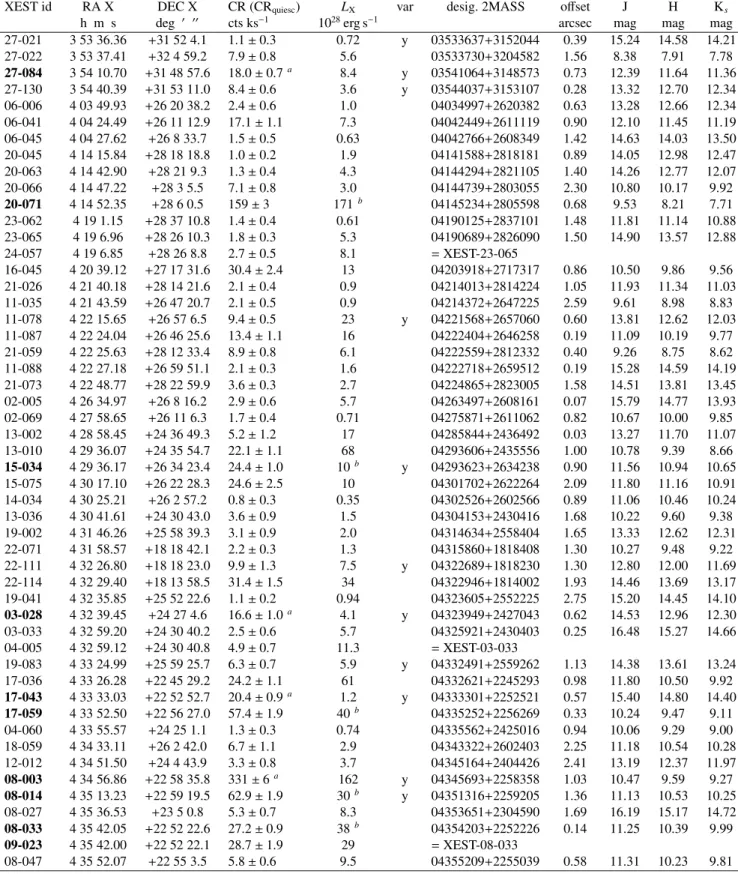
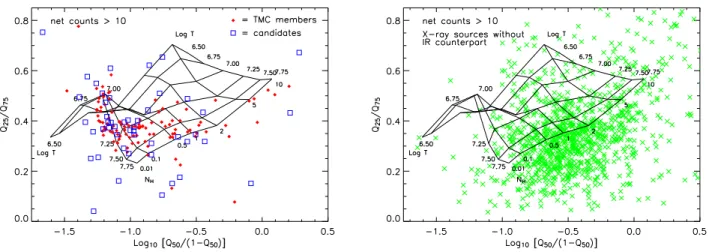
We report in the phase space Q25/Q75vs Q50/(1 − Q50) of Fig. 3 the positions of known TMC members and candidates (left panel) and of the X-ray sources without an IR counterpart (right panel). A theoretical grid predicted by an absorbed one-component coronal model, with fixed abundances (0.3 times the solar values of Anders & Grevesse (1989)) and different temperatures (going from log T = 6.5 up to log T = 7.75) and hydrogen column densities (from NH = 1020cm−2 to 1023cm−2), is superimposed. The degeneracy around (X, Y) = (−1.2, 0.4) expresses the similarity between moderately hot spectra with little absorption and cooler absorbed ones (for de-tails about these topics, see also the appendix in Grosso & et al. 2006). At high temperatures, the degeneracy is removed and the effect of absorption is to shift the model points towards the upper right part of the plot. Note, however, that in this discus-sion the theoretical grid served only as a reference to under-stand where sources with thermal spectra should be expected to lie, due to the simplicity of the model and the uncertainty on the computed quantities. In particular, care must be taken in deriving temperature and hydrogen columns from the positions of the sources with respect to the grid in such diagrams, espe-cially for high-statistics sources, since active stars usually have more complex spectra that cannot be described by a single-component model.
The large spread of the points, above all for the X-ray sources without IR counterpart, is dominated by the large er-ror bars for the faintest sources. Typical erer-rors for faint sources with ∼ 30 and ∼ 50 counts are, respectively, ±0.25 and ±0.15 on both the quantities on the X and Y axes in Fig. 3. However, we clearly observe that the sources without IR counterparts have in general spectra harder than those of TMC members and candidates; this trend is more evident in Fig. 4, where only sources with more than 80 counts, and hence smaller errors, are plotted. The former sample (i.e. X-ray sources without IR counterpart) is very likely dominated by extragalactic objects,
as suggested by the fact that power laws that describe the spec-tra of AGNs lie exactly in the portion of the phase space occu-pied by these sources.
We also note that the distributions of candidates and TMC members in this quantile space are indistinguishable at both statistics we have shown, while they are different from the dis-tribution of the X-ray sources without IR counterpart. It is also interesting to note that the sub-sample of known TMC mem-bers lying in the portion of the grid with high temperatures and hydrogen columns (essentially defined by log10[Q50/(1 −
Q50)] > −0.8) is composed of stars with high AV and/or IR ex-cess, as shown in the color-magnitude diagram of Fig. 5, clas-sified as classical T Tauri stars. The candidates found in this work mainly lie at log10[Q50/(1−Q50)] < −0.8, where the TMC members are both classical and weak-lined T Tauri stars, with a slight predominance of WTTs. This result, together with the color-magnitude diagram of Fig. 1, suggests that our sample of candidates may be dominated by WTTs.
5. Candidates with high probability of membership
Since young stellar objects frequently show variability of their X-ray emission on short (∼ ksec) time scales and also exhibit powerful explosive events (Stelzer et al. 2000; Imanishi et al. 2001), we analysed the photon time-series of all candidates in Table 1 to search for variability, and in particular the presence of flare-like features, supporting the coronal origin and youth of these sources. We used a maximum likelihood algorithm (MLB) that searches for variability in unbinned series of pho-ton arrival times. Details of the method and its application to XEST data are described by Stelzer et al. (2006); it is similar to the Scargle method (Scargle 1998), but is based on a maxi-mum likelihood procedure instead of the Bayesian approach. In brief, the algorithm identifies time intervals of constant signal in photon time series under the assumption of Poisson noise. Background subtraction is done on the photon events list indi-vidually for each source before the algorithm is applied. The re-sulting ‘source-only’ light curve consists of segments with dif-ferent intensity levels. The technique has two free parameters, the confidence level for the intensity changes and the minimum
Figure 3. Quantile space for X-ray sources with more than 10 net counts in the PN: known members (filled diamonds) and candidates (open
squares) are shown in the left panel, X-ray sources without an IR counterpart are shown as crosses in the right panel. A theoretical grid relevant to an absorbed, isothermal and optically thin plasma is superimposed, with abundances fixed to 0.3 times the solar values of Anders & Grevesse (1989), calculated for temperatures going from log T = 6.5 up to log T = 7.75 at a logarithmic step of 0.25 and seven values for the hydrogen column density (NH=0.01, 0.1, 0.5, 1, 2, 5 and 10 in units of 1022cm−2).
Figure 4. Same as the previous figure, but for sources with more than 80 net counts in the PN. The error bars are generally smaller than those
shown in the lower right part of the plots, typical of sources with about 80 counts.
number of counts (Nmin) that define a segment. Small numbers for Nmin facilitate the detection of variability in faint sources, but have also a tendency to find variations that are likely spu-rious. Stelzer et al. (2006) find in their variability analysis of known TMC members that Nmin =20 is an adequate compro-mise.
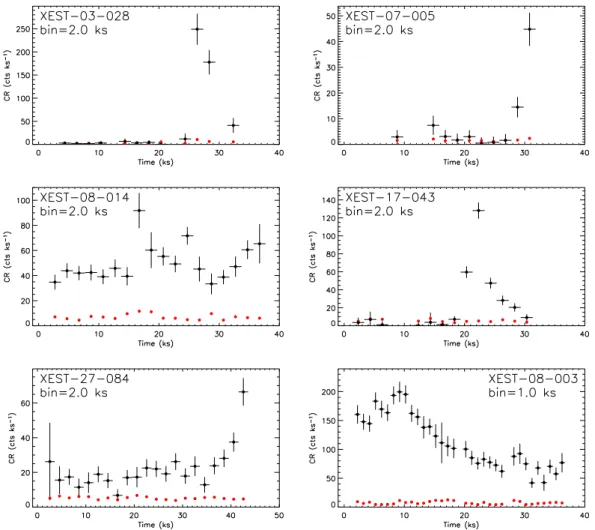
This method indicates that 16 of the 57 XEST sources iden-tified as candidate TMC members are variable in the broad band (0.3 − 7.8 keV) at the 99% level; they are flagged in Table 1. Among them, the sources XEST-03-028, 07-005, 08-014, 17-043, 27-084 and XEST-08-003 show intense flares in their light curves (Fig.6). We con-clude that these 6 sources have higher probability of resulting true members of the Taurus Molecular Cloud.
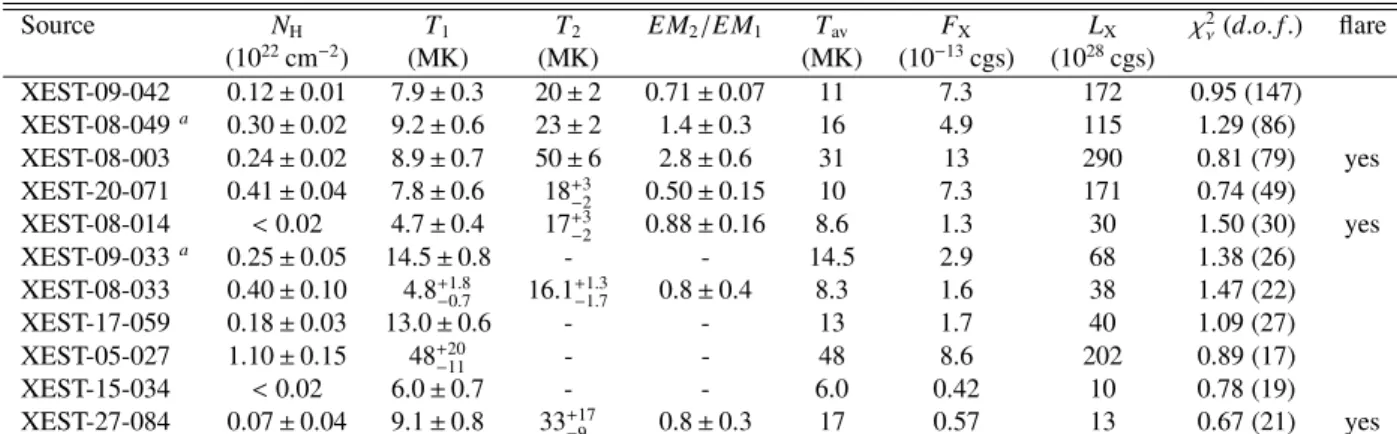
Eleven XEST sources among the candidates listed in Table 1 have enough (& 1000) net counts in the PN camera to
al-low global fits of their spectra. Three of them are the flar-ing sources XEST-08-003, XEST-08-014 and XEST-27-084 mentioned above, while XEST-08-049 and XEST-09-033 are identified with the same 2MASS object. After the response functions were built with the SAS tasks arfgen and rmfgen, we tried to fit in XSPEC the spectra of these sources us-ing both an absorbed power law and an absorbed, optically thin plasma based on the APEC code (Smith et al. 2001), with one (or two) isothermal component(s). The abundances of the coronal models were fixed at values typical for pre-main sequence or extremely active stars, based on results from Argiroffi et al. (2004); Garc´ıa-Alvarez et al. (2005); Scelsi et al. (2005); Telleschi et al. (2005)5. We found that all these
spec-5 With respect to the solar photospheric values by Anders &
Grevesse (1989), the adopted abundances are: C=0.45, N=0.788, O=0.426, Ne=0.832, Mg=0.263, Al=0.5, Si=0.309, S=0.417,
Figure 5. IR color-magnitude diagram for the TMC members shown
in the left panel of Fig. 3: filled and open diamonds refer to stars lying, in the quantile space, at log10[Q50/(1 − Q50)] greater and lower than
−0.8, respectively.
tra are well described by coronal models (Fig. 7) but not by power laws (except the source XEST-05-027 discussed below), thus excluding an extragalactic nature. The parameters of the best-fit models are listed in Table 2. The model temperatures are relatively (or very) high and characteristic of young active stars (e.g. Preibisch et al. 2005); the X-ray luminosities derived from the measured unabsorbed flux and assuming a distance of 140 pc are in the range 1029−3 × 1030erg s−1, also typi-cal of active stars (Stelzer & Neuh¨auser 2001; Preibisch et al. 2005). Therefore, based on these considerations, we conclude that all these sources have a higher probability of being true TMC members.
The photon spectrum of XEST-05-027 can also be de-scribed by an absorbed power law which provides χ2
ν = 0.80 (17 d.o.f.) and thus formally a better fit than the coronal model. The derived hydrogen column density (∼ 1.3 × 1022cm−2) and power law index (∼ −2.2) are values typically found for AGNs (e.g. Hasinger et al. 2001), yet the infrared magnitudes of the IR counterpart would be particularly bright for an extragalac-tic source, and this makes us confident that the nature of this source is more likely a stellar one. The average temperature of the coronal model is very high (∼ 48 MK), but the light curve is consistent with a constant emission, as confirmed by both the MLB and the Kolmogorov-Smirnov tests. So, although we cannot completely rule out an extragalactic origin, this heavily absorbed source deserves attention in the future. An alterna-tive possibility is that a chance association between a stellar IR source and an X-ray extragalactic source occurred in this case6.
Ar=0.55, Ca=0.195, Fe=0.195, Ni=0.195. The same set of abun-dances was used by G¨udel et al. (2006) to fit the spectra of known TMC members.
6 We expect at most about 20 false associations among the 226 (i.e.
347 minus 121 TMC members) X-ray sources with an IR counterpart within 300.
Most of the candidates with a higher probability of mem-bership (8 of 12) are located in three adjacent fields: XEST-08, XEST-09 and XEST-17 (for a map of the TMC and the XEST fileds, see Fig. 1 in G¨udel et al. 2006); these fields do not seem to be special with respect to the others, and the density of known members is not particularly high in them. Hence, our finding may deserve further investigation.
6. Discussion
In this section we explore the possible implications of our can-didate members on the Taurus IMF. To estimate the masses of the selected sources, we evaluated visual extintions AV from the color-color diagram (Fig. 2), then we used these extintions to place the stars in Fig. 1 on the evolutionary tracks by Baraffe et al. (1998), and finally we searched for compatible values of mass and age in both color-magnitude diagrams (Fig. 1) Note, however, that these estimates may be affected by large uncer-tainties, due to the estimated values of AV, to the assumption of no IR excess and also to the uncertainties in the evolutionary models.
Consider first the sub-sample of candidates with available PN spectra. We noted that the visual extinctions obtained from the IR color-color diagram are consistent with those calcu-lated from the hydrogen column densities using the conver-sion NH = 2 AV ×1021cm−2 for all sources listed in Table 2, with the exception of XEST-20-071; we exclude this star from the following discussion together with the source XEST-05-027 because the two pairs of mass and age indicated by the two color-magnitude diagrams were largely incompatible. The general agreement between AV and NHimplies no significant IR excess due to a circumstellar disk for these sources. After dereddening, their positions in the color-magnitude diagrams yield estimated masses in the range 0.2 – 0.6 M and ages rang-ing from ∼ 1 to & 10 Myr, in agreement with those of known TMC members; this result implies that our bright, most proba-ble members are not very low-mass stars, and hence the known difference between the shape of the Taurus IMF and those of Orion and IC 348 at very low masses (see, for example, Fig. 1 in Goodwin et al. 2004) will not be reduced.
Since the above sample includes only the X-ray brightest sources, it may not come as a surprise that they are relatively massive pre-main sequence candidates, because a correlation between mass and LXhas been found in Taurus (G¨udel et al. 2006) and also in other star forming regions (e.g. Preibisch & Zinnecker 2002; Preibisch et al. 2005, for the cases of IC 348 and Orion, respectively). Therefore, the major implications for the Taurus IMF could come from the faintest candidates. Since we have no estimates of NHfor these sources to be compared with the AV, we assumed that approximate AVvalues can be de-rived from the color-color diagram and we used these estimates to deredden their positions in the color-magnitude diagrams. This procedure was applied to all the X-ray faint sources, ex-cept for XEST-02-005 which clearly shows IR excess and is therefore excluded. For 6 sources we could not obtain com-patible mass and age values from both color-magnitude dia-grams, and hence they are also excluded from the following
Figure 6. Background-subtracted light curves (points with error bars) of six sources showing flares, obtained adding the PN, MOS1 and MOS2
counts. The points without errors represent the background emission.
discussion7. In total, we have 48 candidates (including the X-ray bright ones) with self-consistent extintions, mass and age estimates, which are plotted in Fig. 8: we observe that faint candidates span a relatively large mass range (0.02 − 1.2 M )8 but they are not clustered at very low masses. We also note that most of the candidates follow the LX-mass correlation derived for the other TMC members (G¨udel et al. 2006). That is inde-pendent support for these candidates being TMC members, and is especially true for the most probable candidates. Only those in the lower-right corner (all of them being ”faint candidates”) are suspiciously off.
In conclusion, our analysis suggest that the shape of the Taurus stellar IMF could not be affected significantly at the very low-mass end, even with the addition of all these candi-dates. However we recall that the masses derived in this section may be affected by large uncertainties; moreover it is quite pos-7 The candidate XEST-03-028 with high probability of membership
is among the faint sources without mass estimate; its position in the IR diagrams might indicate very high absorption and/or IR excess.
8 The positions in the IR diagrams of the candidates XEST-07-005
and XEST-17-043 with high probability of membership could suggest for them a substellar mass.
sible that several candidates are not true TMC members (pos-sibly the low-luminosity sources with apparently high mass, from Fig. 8), hence more detailed studies of these sources are required before any reliable assertion on the very low-mass end of the Taurus IMF can be stated.
7. Conclusions
As X-ray emission is particularly intense during the early stages of the stellar evolution, in this work we have employed X-ray data from the XEST survey and the 2MASS infrared data to identify possible new pre-main sequence stars belonging to the Taurus-Auriga star forming region. More precisely, in the 24 regions of the TMC observed by XMM-Newton and ana-lyzed here, covering an area of ∼ 5 square degrees, we iden-tified 57 X-ray and IR sources compatible with being young stellar objects of this molecular cloud, and we found 12 sources among them with high probability of being TMC members based on the analysis of PN spectra and/or the presence of flares in the light curves. From the infrared color-magnitude and color-color diagrams, we note that most of these candi-dates could be weak-lined T Tauri stars that are less efficiently selected from population studies in the optical and infrared
Table 2. Parameters of the best-fit coronal models (with 1 σ errors) for the brightest candidate members. Tavis the EM-weighted logarithmic
average temperature, defined as log Tav =(EM1 log T1+EM2 log T2)/(EM1 +EM2) (see also G¨udel et al. 2006). The model flux (in the 0.3 − 10 keV band ) is unabsorbed and the luminosity is calculated from it assuming d = 140 pc.
Source NH T1 T2 EM2/EM1 Tav FX LX χ2ν(d.o. f.) flare (1022cm−2) (MK) (MK) (MK) (10−13cgs) (1028cgs) XEST-09-042 0.12 ± 0.01 7.9 ± 0.3 20 ± 2 0.71 ± 0.07 11 7.3 172 0.95 (147) XEST-08-049a 0.30 ± 0.02 9.2 ± 0.6 23 ± 2 1.4 ± 0.3 16 4.9 115 1.29 (86) XEST-08-003 0.24 ± 0.02 8.9 ± 0.7 50 ± 6 2.8 ± 0.6 31 13 290 0.81 (79) yes XEST-20-071 0.41 ± 0.04 7.8 ± 0.6 18+3 −2 0.50 ± 0.15 10 7.3 171 0.74 (49) XEST-08-014 <0.02 4.7 ± 0.4 17+3−2 0.88 ± 0.16 8.6 1.3 30 1.50 (30) yes XEST-09-033a 0.25 ± 0.05 14.5 ± 0.8 - - 14.5 2.9 68 1.38 (26) XEST-08-033 0.40 ± 0.10 4.8+1.8 −0.7 16.1+1.3−1.7 0.8 ± 0.4 8.3 1.6 38 1.47 (22) XEST-17-059 0.18 ± 0.03 13.0 ± 0.6 - - 13 1.7 40 1.09 (27) XEST-05-027 1.10 ± 0.15 48+20 −11 - - 48 8.6 202 0.89 (17) XEST-15-034 <0.02 6.0 ± 0.7 - - 6.0 0.42 10 0.78 (19) XEST-27-084 0.07 ± 0.04 9.1 ± 0.8 33+17 −9 0.8 ± 0.3 17 0.57 13 0.67 (21) yes aThese two sources have the same 2MASS counterpart.
Figure 7. EPIC PN spectra of the brightest candidate members (points) with the best-fit coronal models (see Tab. 2 for the parameters of the
Figure 7. Continued
bands. If not TMC members, these sources might be fore-ground young main sequence stars or backfore-ground active stars (M-type stars older than the Taurus population, binary RS CVn systems, bright single giants); the candidate sample might also include some extragalactic object among the faintest IR and X-ray sources; there is also a relatively small probability of chance associations between an IR stellar source and an extra-galactic X-ray source. Optical follow-up observations aimed at collecting spectra for measurements of the Li 6708 Å and Hα lines and radial velocities, and for spectral classification and effective temperatures determination, will be performed to de-termine the nature of the optical/IR counterparts for the X-ray sources identified in this work, and hence to confirm or reject their membership of the TMC; although we do not expect that all these sources will be confirmed as new members, these ob-servations could lead to a significant increase of the number of WTTs in these surveyed fields, whose present number is 49.
Acknowledgements. We acknowledge financial support by the
International Space Science Institute (ISSI) in Bern to the
XMM-Newton XEST team. The Palermo group acknowledges financial
con-tribution from contract ASI-INAF I/023/05/0. X-ray astronomy re-search at PSI has been supported by the Swiss National Science Foundation (grants 20-66875.01 and 20-109255/1). M.A. acknowl-edges support from NASA grant NNGO5GF92G. This research is based on observations obtained with XMM-Newton, an ESA science mission with instruments and contributions directly funded by ESA member states and the USA (NASA). This publication makes use of data products from the Two Micron All Sky Survey (2MASS), which is a joint project of the University of Massachusetts and the Infrared Processing and Analysis Center/California Institute of Technology, funded by the National Aeronautics and Space Administration and the National Science Foundation. Further, our research has made use of the SIMBAD database, operated at CDS, Strasbourg, France.
References
Figure 8. X-ray luminosities versus masses for the 48 candidates with
mass estimates. Crosses refer to the candidates with higher probability of membership. LXvalues joined by a dotted segment refer to
lumi-nosities derived for the same source in two different XEST observa-tions. The dashed line is the relation log LX=1.53 log M + 30.3 best-fitting the data for known TMC members (G¨udel et al. 2006) and the dotted lines bracket the region where known members are found.
A&AS, 114, 109
Anders, E. & Grevesse, N. 1989, Geochim. Cosmochim. Acta, 53, 197
Argiroffi, C., Drake, J. J., Maggio, A., et al. 2004, ApJ, 609, 925
Audard, M., Briggs, K., Grosso, N. G¨udel, M. S. L., & et al. 2006, A&A, this volume
Baraffe, I., Chabrier, G., Allard, F., & Hauschildt, P. H. 1998, A&A, 337, 403
Bohlin, R. C., Savage, B. D., & Drake, J. F. 1978, ApJ, 224, 132
Brice˜no, C., Luhman, K. L., Hartmann, L., Stauffer, J. R., & Kirkpatrick, J. D. 2002, ApJ, 580, 317
Briceno, C., Hartmann, L. W., Stauffer, J. R., et al. 1997, AJ, 113, 740
Briggs, K. R. & et al. 2006a, A&A, this volume Briggs, K. R. & et al. 2006b, A&A, this volume
Damiani, F., Maggio, A., Micela, G., & Sciortino, S. 1997, ApJ, 483, 350
Feigelson, E. D. & Montmerle, T. 1999, ARA&A, 37, 363 Franciosini, I. & et al. 2006, A&A, this volume
G¨udel, M., Briggs, K., Arzner, K., et al. 2006, A&A, this vol-ume
G¨udel, M. & et al. 2006, A&A, this volume
Garc´ıa-Alvarez, D., Drake, J. J., Lin, L., Kashyap, V. L., & Ball, B. 2005, ApJ, 621, 1009
Goodwin, S. P., Whitworth, A. P., & Ward-Thompson, D. 2004, A&A, 419, 543
Gorenstein, P. 1975, ApJ, 198, 95
Grosso, N. & et al. 2006, A&A, this volume
Guieu, S., Dougados, C., Monin, J.-L., Magnier, E., & Mart´ın, E. L. 2006, A&A, 446, 485
Hasinger, G., Altieri, B., Arnaud, M., et al. 2001, A&A, 365,
L45
Hong, J., Schlegel, E. M., & Grindlay, J. E. 2004, ApJ, 614, 508
Imanishi, K., Koyama, K., & Tsuboi, Y. 2001, ApJ, 557, 747 Luhman, K. L. 2004, ApJ, 617, 1216
Luhman, K. L., Brice˜no, C., Stauffer, J. R., et al. 2003a, ApJ, 590, 348
Luhman, K. L., Stauffer, J. R., Muench, A. A., et al. 2003b, ApJ, 593, 1093
Muench, A. A., Lada, E. A., Lada, C. J., & Alves, J. 2002, ApJ, 573, 366
Neuh¨auser, R., Sterzik, M. F., Torres, G., & Martin, E. L. 1995, A&A, 299, L13+
Ozawa, H., Grosso, N., & Montmerle, T. 2005, A&A, 429, 963 Predehl, P. & Schmitt, J. H. M. M. 1995, A&A, 293, 889 Preibisch, T., Kim, Y.-C., Favata, F., et al. 2005, ApJS, 160, 401 Preibisch, T. & Zinnecker, H. 2002, AJ, 123, 1613
Rieke, G. H. & Lebofsky, M. J. 1985, ApJ, 288, 618
Ryter, C., Cesarsky, C. J., & Audouze, J. 1975, ApJ, 198, 103 Ryter, C. E. 1996, Ap&SS, 236, 285
Scargle, J. D. 1998, ApJ, 504, 405
Scelsi, L., Maggio, A., Peres, G., & Pallavicini, R. 2005, A&A, 432, 671
Siess, L., Dufour, E., & Forestini, M. 2000, A&A, 358, 593 Silva, B. & et al. 2006, A&A, this volume
Skrutskie, M. F., Cutri, R. M., Stiening, R., et al. 2006, AJ, 131, 1163
Smith, R. K., Brickhouse, N. S., Liedahl, D. A., & Raymond, J. C. 2001, ApJ, 556, L91
Stelzer, B., Flaccomio, E., Briggs, K., et al. 2006, A&A, this volume
Stelzer, B. & Neuh¨auser, R. 2001, A&A, 377, 538
Stelzer, B., Neuh¨auser, R., & Hambaryan, V. 2000, A&A, 356, 949
Sterzik, M. F., Alcala, J. M., Neuhaeuser, R., & Schmitt, J. H. M. M. 1995, A&A, 297, 418
Str¨uder, L., Briel, U., Dennerl, K., et al. 2001, A&A, 365, L18 Telleschi, A. & et al. 2006, A&A, this volume
Telleschi, A., G¨udel, M., Briggs, K., Audard, M., & Scelsi, L. 2006, A&A, this volume
Telleschi, A., G¨udel, M., Briggs, K., et al. 2005, ApJ, 622, 653 Turner, M. J. L., Abbey, A., Arnaud, M., et al. 2001, A&A,
365, L27
Walter, F. M., Brown, A., Mathieu, R. D., Myers, P. C., & Vrba, F. J. 1988, AJ, 96, 297