HAL Id: hal-02008048
https://hal-ifp.archives-ouvertes.fr/hal-02008048
Submitted on 5 Feb 2019HAL is a multi-disciplinary open access archive for the deposit and dissemination of sci-entific research documents, whether they are
pub-L’archive ouverte pluridisciplinaire HAL, est destinée au dépôt et à la diffusion de documents scientifiques de niveau recherche, publiés ou non,
Competitive adsorptions between thiophenic compounds
over CoMoS/Al 2 O 3 under deep HDS of FCC gasoline
Alan Silva dos Santos, Etienne Girard, Philibert Leflaive, Sylvette Brunet
To cite this version:
Alan Silva dos Santos, Etienne Girard, Philibert Leflaive, Sylvette Brunet. Competitive adsorptions between thiophenic compounds over CoMoS/Al 2 O 3 under deep HDS of FCC gasoline. Applied Catalysis A : General, Elsevier, 2019, 570, pp.292-298. �10.1016/j.apcata.2018.11.032�. �hal-02008048�
Competitive adsorptions between thiophenic compounds over CoMoS/Al2O3 under
deep HDS of FCC gasoline.
Alan Silva dos Santos1, Etienne Girard2, Philibert Leflaive2 and Sylvette Brunet1*
1
Université de Poitiers, Institut de Chimie des Milieux et Matériaux de Poitiers (IC2MP), UMR 7285 CNRS-, 4 rue Michel Brunet, TSA 71106- 86073 Poitiers Cedex9, France
2
IFP Energies nouvelles, Rond-point de l’échangeur de Solaize, BP 3, 69360 Solaize, France
*
Corresponding author: email: sylvette.brunet@univ-poitiers.fr (Sylvette Brunet) Tel: (+33) 5 49 45 36 27
Fax: (+33) 5 49 45 38 97
Keywords:
Hydrodesulfurization, FCC gasoline, 2-methythiophene, 3-methylthiophene, benzothiophene, kinetic modeling.
1 Introduction
Due to increasing environmental concerns, constraints relative to exhaust gas compositions have been reinforced worldwide. China V and US Tier 3 regulations have thus imposed a maximum of 10 ppmSulfur in commercial gasoline since 2017 [1]. Commercial gasoline is blended from gasoline streams mainly produced by isomerization, reforming and fluid catalytic cracking (FCC) units in refineries. In particular, catalytic cracked gasoline represents 40-80% of the total gasoline composition but accounts for almost all of the total sulfur amount present in non-hydrodesulfurized commercial gasoline [2,3]. Consequently, there is a strong need for achieving ultra-deep HDS of FCC gasoline, which comes with developing highly active HDS catalysts. Meanwhile, these catalysts should also exhibit high selectivity to minimize olefins hydrogenation (HDO) and preserve high octane values.
The FCC gasoline is a complex blend of more than 400 compounds, mainly including paraffins, olefins, naphtenes and aromatics. The sulfur compounds in FCC gasoline are represented in various families: mercaptans, thiophenes, benzothiophenes and their alkyl derivatives. The repartition and the total amount of these sulfur compounds depend on the origin of the feedstock and the operating conditions of the FCC unit. As reported in literature [4,5], for a typical feedstock, C1-thiophenes –i.e. methylthiophenes–, C2-thiophenes and
benzothiophenes correspond to more than 50% of total sulfur compounds present in the mixture. Therefore, the sulfur compounds selected in model feeds as single representative of sulfur contents in a FCC gasoline are thiophene [6], alkylthiophenes [2,7], benzothiophene and its alkylated derivatives [8,9]. However, a major drawback of such approach lies in a lack of representativeness of the reactivity of a real catalytically cracked gasoline where relative reactivities of reactants and potential competitive adsorptions between reactants and products dictate the overall feed reactivity.
operating conditions. At their operating conditions –100ppmS in toluene, 1.3 MPa, 150°C, LHSV =3.5 h-1–, Hatanaka et. al. [10,11] established the following reactivity scale:
benzothiophene > thiophene > 3-methylthiophene > 2-methylthiophene > 2-ethylthiophene > 2,5-dimethylthiophene. The reaction rate of benzothiophene was approximatively twice that of thiophene. These results also confirmed the relative reactivities of 3-methylthiophene and
2-methylthiophene over a CoMoS/Al2O3 catalyst, as reported by Desikan et. al. [12] at atmospheric
pressure and temperatures of 305 and 414ºC. However, in a review on hydrodesulfurization
processes, Song et al [13] suggested a reverse reactivity order with thiophene being more reactive than benzothiophene. This assumption was based on results originally published by Nag et al.[14] on the hydrodesulfurization of benzothiophene and thiophene at 7,1 MPa and 300°C. In this study, the reactivity of thiophene was higher by a factor of 1.7 as compared to benzothiophene.
In addition, the potential competitive adsorptions over the catalyst surface between reactants and products in complex feeds such as a real catalytically cracked gasoline have never been thoroughly investigated. Indeed, most relevant articles focused on the inhibiting effect of H2S on the transformation of single sulfur compounds in model feeds. Thus,
Fontaine et. al. [15] evidenced that the presence of H2S had a weak impact on the
transformation of 2-methylthiophene over an unsupported CoMoS catalyst at 2 MPa and 250°C. A similar effect was observed by Dos Santos et al. [7] during the hydrodesulfurization of 3-methyl-thiophene over a CoMoS catalyst supported on alumina at 2 MPa and 185°C. A decrease in the kinetic apparent constants as a function of H2S partial pressure was attributed
to a competitive adsorption of 3-methylthiophene and H2S on the active sites of the catalyst.
To develop highly efficient catalysts and bridge the gap between model feed and real catalytically cracked gasoline reactivities, there is consequently a strong need for a proper understanding of the reactivity scale of sulfur compounds under selective HDS operating conditions as well as their interplay in mixture.
This paper deals with the comparison of the reactivity of sulfur model molecules representative of various families in FCC gasoline alone and in mixture in order to determine the most refractory sulfur compounds and to quantify their competitive adsorption. The transformations of 2-methylthiophene (2MT), 3-methylthiophene (3MT) and benzothiophene (BT), -the selected model molecules- over a supported CoMoS catalyst under selective HDS conditions (250°C and 2Mpa of total pressure) were thus studied alone, and then in mixture. Following a combined experimental and theoretical approach, a kinetic modeling based on a Langmuir-Hinshelwood formalism was then developed to explain these experimental results and provide quantitative elements of reactivity of sulfur compounds in selective HDS conditions in place of the more qualitative information that is found in the available literature.
2 Experimental part
2.1 Catalyst and chemicals
The CoMoS/Al2O3 catalyst was provided by IFPEN with the following composition:
CoO (3%wt), MoO3 (10%wt). The various characteristics are reported Table 1. The catalyst
was crushed and sieved to size range between 250 and 315 m and then sulfided in situ under H2S/H2 flow (10 mol% H2S) for 10 h at 400°C at atmospheric pressure. 2-methylthiophene
(98% purity), 3-methylthiophene (98% purity), benzothiophene (95% purity) and n-heptane (>99% purity) were purchased from Sigma-Aldrich. They were used without further purification. Hydrogen sulfide (1 vol% in mixture with H2) was purchased from Air Liquide.
2.2 Reaction conditions
Catalytic activity measurements were carried out in a fixed bed reactor at 250°C under a total pressure of 2 MPa with a ratio H2/feed of 360 NL/L [16-18]. The sulfur model feed
Different types of feeds were used to study the transformation of the sulfur model molecules alone or in mixture:
1/ Single component feed including a sulfur model molecule alone (corresponding to 1000 ppmS) (0.3 wt% of 2MT or 3MT or 0.42wt% of BT) in n-heptane;
2/ Feed consisting of a mixture of two sulfur components including 0.3wt% of 2MT (1000 ppmS) and various amounts of BT (corresponding to 500, 1000 and 1500 ppmS) in n-heptane; 3/ Feed consisting of a mixture of either 2MT or BT (1000 ppmS) and H2S (from 0.2 to 1.45
kPa) in n-heptane. These H2S partial pressures correspond to the amount of H2S produced by
the transformation of BT (or 2MT) in mixture with 2MT (or BT). These latter experiments were carried out in order to identify the real inhibitor of the transformation of a given sulfur compound (the other sulfur molecule present or the H2S produced by its transformation);
The different partial pressures of the reactants, H2S, H2 introduced are reported Table
3 for the sulfur molecules alone and in mixture, respectively. n-heptane was not converted under these experimental conditions. No catalyst deactivation was observed for all the experiments.
2.3 Products analysis
The reaction products were injected on-line by means of an automatic sampling valve into a Varian gas chromatograph equipped with a PONA capillary column and a flame ionization detector as in previous works [16-18]. Desulfurized products, resulting from the transformation of 2-methylthiophene, 3-methylthiophene and benzothiophene are designated as HDS products. The contact time is defined as the ratio between the total amount of feed and the mass of catalyst in the oxide form2MT, 3MT and BT reactivities, are defined as the number of moles of HDS products formed per hour and per gram of catalyst and were calculated at conversion lower than 30% in a differential regime.
2.4 Kinetic modeling
The obtained experimental results were confirmed by a theoretical approach using the Langmuir-Hinshelwood model and the Arrhenius equation. Kinetic and adsorption parameters were first set from single component experiments using ReactOp software® and were then
used to fit binary experimental results without further adjustment.
3 Results
3.1 Transformation of single sulfur compounds
In order to draw an unambiguous reactivity ranking of 2MT, 3MT and BT, the hydrodesulfurization of single sulfur compounds was first studied. The conversion of 2MT, 3MT and BT measured separately are reported Figure 1. The distribution of the products are reported in Figure 2 for 2MT, in Figure 3 for 3MT and in Figure 4 for BT. For the three sulfur compounds, a linear dependence of conversion with contact time was observed for conversions lower than 60%, thus corresponding to a differential regime. At equivalent contact time, the conversion of BT was systematically higher than those of 2MT and 3MT, as reported in Table 4. In other words, the reactivity order observed under these operating conditions is in agreement with the results previously obtained by Hatanaka et al. [10,11] who reported that 2-methylthiophene was less reactive than 3MT and BT at a total pressure of 1.3 MPa and temperatures ranging between 130 and 170ºC.
Regarding the product distribution of the transformation of 2-MT, the main products observed are pent-1-ene, cis-pent-2-ene and trans-pent-2-ene as primary products and n-pentane as a secondary product (Figure 2). In agreement with the reaction scheme proposed previously (Scheme 1) [2], there are two main potential pathways: direct desulfurization (DDS) -leading to the formation of cis and trans-pent-2-ene- and the hydrogenation (HYD)
product (n-pentane). However, the intermediates proposed in the reaction scheme for 2MT were not observed under selective HDS operating conditions.
Similar to 2MT, the transformation of 3MT also leads to the formation of alkenes (i.e. 2-methylbut-1-ene, 2-methylbut-2-ene and 3-methylbut-1-ene) as primary products and to the formation of isopentane as secondary product resulting from the hydrogenation of alkenes (Figure 3 according to the proposed reaction scheme in the literature (Scheme 2)) [7]
The transformation of BT leads to dihydrobenzothiophene (DHBT) –resulting from the hydrogenation of the thiophenic ring– which appears as a primary product. The formation of ethylbenzene (EB) is also observed as an apparent secondary product although it can be also formed directly from BT (Figure 4). Consequently, the reaction scheme established from these results can involve two pathways for the formation of EB: a direct DDS pathway from BT involving a C-S bond rupture and the hydrogenation pathway involving the formation of DHBT and a subsequent C-S bond rupture (Scheme 3).
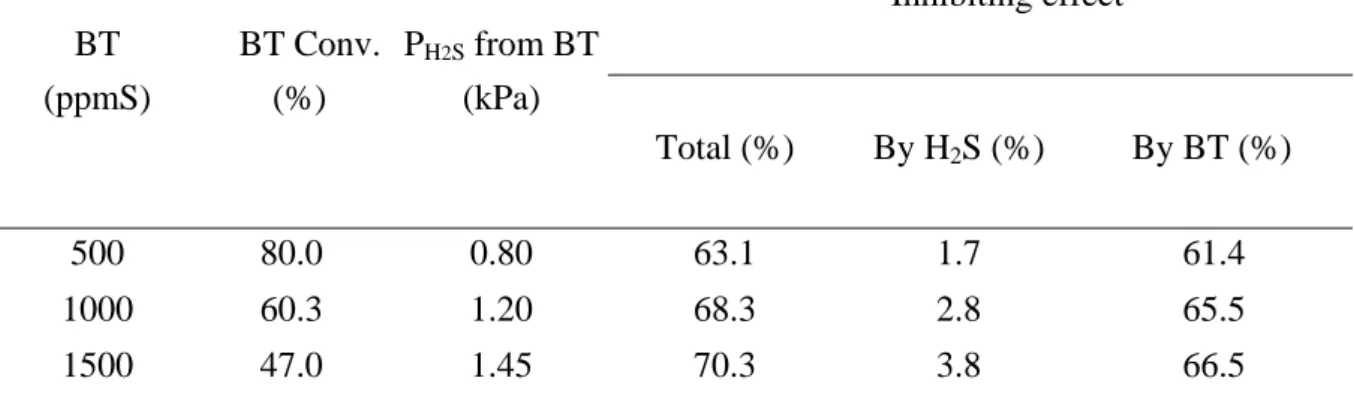
In order to evaluate a mutual inhibiting effect between the different sulfur compounds, the transformation of a feed containing 1000 ppmS from 2MT and different amounts of BT (from 500 to 1000 ppmS) was studied. The contact time was varied in order to obtain a large range of conversions (from 15 to 80%) of 2MT and BT. A mutual inhibiting effect between 2MT and BT was noticed. Moreover, the inhibition on the transformation of 2MT resulting from BT was higher (Figure 5a) than the opposite (Figure 6a). At a contact time of 2s, the decrease in conversion for the transformation of 2MT was equal to 54% while only 15% for the transformation of BT. This inhibiting effect is due to the unconverted other sulfur compound (2MT or BT) and not to the H2S produced by its transformation. Indeed, if 2MT or
BT were substituted by the amount of H2S produced by the conversion of both sulfur
compounds, the inhibiting effect observed was much lower in the transformation of 2MT (i.e. lower than 5%) (Table 5) and zero in the transformation of BT (Table 6). Consequently, the decrease in the conversion of 2MT (around 60%) observed in mixture with BT corresponds to
an inhibition effect of the unconverted BT. Indeed, when BT is present at high concentration (1500ppm S) in the feed, its conversion is low (i.e. 47%), which leads to an inhibition of the transformation of 2MT around 66.5% (i.e. a conversion of 10.2% of 2MT in the feed as compared to a conversion of 28.2% in the absence of BT). In the opposite, for the conversion of BT, the presence of 2MT leads to an inhibition of only around 15% whereas the concentration of unconverted 2MT remains high due to its low conversion (maximum 17%) (Table 5).
3.2 Kinetic modeling
In order to understand and quantify the strong mutual inhibiting effects observed experimentally, a kinetic model was developed to determine the kinetic and adsorption parameters of 2MT, 3MT and BT transformations. As reported previously [17,18] the following assumptions were made: a Langmuir-Hinshelwood model involving reactions between adsorbed molecules, competitive adsorptions between sulfur compounds, alkenes, alkanes and H2S, a unique type of site and an heterolytic dissociation of H2 and H2S. The
corresponding elementary steps were reported previously under similar operating conditions [17,18].
For the transformation of 2MT and 3MT, different reactions were taken into account, respectively named R1 or R3 for the formation of olefin intermediates and R2 and R4 for the
formation of alkanes from olefins.
R2
R3
R4
The rate equations are as follows:
2 ) 3 ( 2 ) 3 ( 2 ) 3 ( 2 ) 3 ( 2 ) 3 ( 1 2 2 2 2 2 2 2 2 2 2 2 2 2 2 2 2 1 . H S S H S H S H S H S H H S S H H H H S S H MT MT MT MT H S S H S H S H MT MT MT MT RT Ea P K P P K P K P K P P K P K P P K P K P P K P K e k r 2 ) 4 ( 2 2 2 2 2 2 2 2 2 2 2 2 2 2 2 2 2 1 . H S S H S H S H S H S H H S S H H H H S S H PN PN H S S H S H S H PN PN RT Ea P K P P K P K P K P P K P K P P K P K P P K P K e k r
Regarding the transformation of BT, the proposed reaction scheme includes two pathways for its transformation: HYD of BT into dihydrobenzothiophene (DHBT) and then HDS of DHBT into ethylbenzene (EB). The second pathway corresponds to the formation of
ethylbenzene directly from BT. Therefore, the consecutive reactions proposed to model the transformation of BT are given below:
R5
R6
R7
The corresponding equation rate are as follows:
2 5 2 2 2 2 2 2 2 2 2 2 2 2 2 2 2 2 1 . H S S H S H S H S H S H H S S H H H H S S H BT BT H S S H S H S H BT BT RT Ea P K P P K P K P K P P K P K P P K P K P P K P K e k r 2 6 2 2 2 2 2 2 2 2 2 2 2 2 2 2 2 2 1 . H S S H S H S H S H S H H S S H H H H S S H DHBT DHBT H S S H S H S H DHBT DHBT RT Ea P K P P K P K P K P P K P K P P K P K P P K P K e k r
2 7 2 2 2 2 2 2 2 2 2 2 2 2 2 2 2 2 1 . H S S H S H S H S H S H H S S H H H H S S H BT BT H S S H S H S H BT BT RT Ea P K P P K P K P K P P K P K P P K P K P P K P K e k r
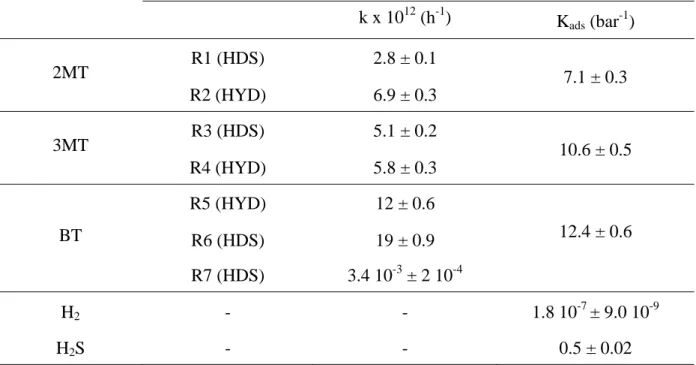
To explain the order of reactivity observed experimentally as well as the mutual inhibition of sulfur compounds, a kinetic modeling of the sulfur compounds alone initially and then in a mixture was carried out. The kinetic parameters (for the hydrodesulfurization and hydrogenation reactions) and the adsorption constants calculated from single component experiments are reported in Table 7. A good fit of the transformation of 2MT, 3MT and BT is obtained. The modeling (dashed curve) and the experimental results (points) for the conversion of 2MT, BT and 3MT alone and their product distribution are respectively reported on Figure 5, Figure 6 and Figure 7.
It can be seen that the rate constants of the desulfurization step (olefin formation) (k = 2.8 1012 h-1 and 5.5 1012 h-1 for 2MT and 3MT respectively) are lower than those of the
corresponding saturated hydrocarbon formation (k = 6.9 1012 h-1 and 5.8 1012 h-1 for 2MT and
3MT respectively) (Scheme 1 and Scheme 2). In addition, modeling confirmed that the direct formation of ethylbenzene from BT was a minor pathway in selective HDS operating conditions. Indeed, the rate constant is much lower (k = 3.8 108 h-1) than that via the
formation of DHBT (k = 12 1012 h-1) (Scheme 3). Moreover, the scale of reactivity of the
three model sulfur molecules was confirmed from the rate constants of the desulfurization steps where those of BT is higher than those of 3MT and 2MT. Similarly, the BT adsorption constant is higher than those of 3MT and 2MT (KBT = 12.4 bar-1, K3MT = 10.6 bar-1, K2MT =
7.1 bar-1).
In addition, when components are in mixture, the experimental results are also well modeled considering the same model without further adjustments of the parameters fitted on
single component experiments. Indeed, the same parameters (kinetic and adsorption constants) determined with the single sulfur compounds were used for the modeling in mixture. The very good fit obtained confirms the validity and the robustness of the chosen model and evidences the soundness of the obtained adsorption and kinetic parameters. The mutual inhibiting effect observed when 2MT and BT were in mixture is well represented. Indeed, the BT adsorption constant was higher (Kads = 12.4 bar-1) than that of 2MT (7.1 bar-1).
The transformation of 2MT (Figure 5) was thus impacted by the presence of unconverted BT, whereas conversely BT was little impacted by 2MT (Figure 6). This confirmed competitive adsorptions of the sulfur model molecules on the catalyst surface.
4 Conclusion
Under selective HDS operating conditions, the experimental approach developed in this study demonstrated an unambiguous reactivity scale of sulfur compounds representative of FCC gasoline. Thus, benzothiophene is 2.4 times more reactive than 3-methylthiophene which 1.8 times more reactive than 2-methylthiophene when considering single component experiments. By kinetic modeling based on a Langmuir-Hinshelwood formalism, the reaction schemes for the transformation of 2-methylthiophene, 3-methylthiophene and benzothiophene were validated.
In mixture, the reactivity ranking of these sulfur compounds was preserved. In addition, a mutual inhibiting effect between sulfur compounds was evidenced from the experiments mixing 2-methylthiophene and benzothiophene. Besides, the influence of unconverted BT on the transformation of 2MT was much higher than that of 2MT on the transformation of BT, due to a stronger adsorption of the latter. These results were confirmed by kinetic modeling where the calculated BT adsorption constant was 40% higher than that of 2MT, thus explaining the stronger adsorption of BT on the catalytic sites. This also allowed
under deep HDS operating conditions. Notably, the transformations of sulfur model compounds alone and in mixture could be fitted from a single kinetic model based on a Langmuir-Hinshelwood formalism. This clearly validated our combined experimental and theoretical approach and also demonstrated that inhibition phenomena observed experimentally between sulfur molecules were due to competitive adsorption on the catalyst surface.
To further narrow the representativeness gap between model molecules feeds and real catalytically cracked gasoline and get a deeper understanding of complex feed reactivities, a similar approach will be applied to understand the mutual influence of sulfur compounds and olefins on their reactivity.
Acknowledgements
A. Silva dos Santos thanks CNPq - Brasil for a PhD grant and IFPEN Lyon for the fruitful discussions.
References
[1] http://transportpolicy.net/index.php?title=Global_Comparison:_Fuels
[2] S. Brunet, D. Mey, G. Perot, C. Bouchy, F. Diehl, Appl. Catal. A Gen. 278 (2005) 143– 172.
[3] H. Toulhoat, P. Raybaud, Catalysis by Transition Metal Sulphides from Molecular Theory to Industrial Application, Technip, Paris, France (2013)
[4] M.A.B. Siddiqui, A.M. Aitani, Pet. Sci. Technol. 25 (2007) 299–313.
[5] W.-C. Cheng, G. Kim, A.W. Peters, X. Zhao, K. Rajagopalan, M.S. Ziebarth, Catal. Rev. 40 (1998) 39–79.
[6] Bl. V. Itoua, C. Vladov, P. Ongoka, L. Petrov, Bulg. Chem. Com. 46 (2014) 120-124. [7] N. Dos Santos, H. Dulot, N. Marchal, M. Vrinat, Appl. Cat. A: Gen. 352 (2009) 114–123. [8] O. A. Olafadehan, E. U. Okinedo. Pet. Sci. Tech. 27 (2009) 239-262.
[9] H. Wang, R. Prins, Appl. Catal. A : Gen. 350 (2008) 191-196
[10] S. Hatanaka, E. Morita, K. Shimada, Journ. Japan Pet. Inst. 50 (2007) 179-185 [11] S. Hatanaka, M. Yamada. Ind. Eng. Chem. Res. 36 (1997) 1519-1523
[12] P. Desikan, C.H. Amberg, Canad. J. Chem. 41 (1963) 1966-1971 [13] C. Song, Catal. Today 86 (2003) 211-263.
[14] N.K. Nag, A.V. Sapre, D.H. Broderick, B.C. Gates, J. Catal. 57, (1979) 509-512
[15] C. Fontaine, Y. Romero, A. Daudin, E. Devers, C. Bouchy, S. Brunet, Appl. Catal. A: General 388 (2010) 188–195
[16] D. Mey, S. Brunet, C. Canaff, F. Maugé, C. Bouchy, F. Diehl, J. Catal. 227 (2004) 436-447.
[17] A. Daudin, S. Brunet, G. Perot, P. Raybaud, C. Bouchy, J. Catal. 248 (2007) 111-119. [18] F.Pelardy, A. Silva dos Santos, A. Daudin, E. Devers, T. Belin, S. Brunet, Appl. Catal. B: Environmental 206 (2017) 24–34
Table 1. Amount of sulfur compounds present in a feed containing 1.05 wt% of sulfur [17]. Sulfur Compounds Sulfur Compounds ppmS % Mercaptans 34 4.5 Thiophene 37 4.9 C1-thiophenes 106 14.1 Tetrahydrothiophene 24 3.2 C2-thiophenes 118 15.6 C3-thiophenes/thiophenol 76 10.1 C4-thiophenes/C1-thiophenol 83 11.0 Benzothiophene 276 36.6 Total Sulfur 754 100
Table 2 : Characteristic of the CoMo/Al2O3 catalyst
Table 3. Partial pressures (kPa) of the different compounds for the sulfidation step and the transformation of the different feeds.
(T = 250ºC, P = 2 MPa, CoMoS/Al2O3, H2/feed = 360 NL/L)
Feed A B C D E F Pressure (kPa) Sulfidation 3MT/2MT BT 2MT + BT 2MT + H2S BT + H2S PH2S 10 0 0 0 0.8 – 1.45 0.2 – 0.37 P2MT or P3MT 0 2 0 2 2 - PBT 0 0 2 1-3 0 2 PH2 90 1360 1360 1360 1360 1360 PnC7 0 638 638 633-635 636,55 637,2- 637,63 637,8-PTOT 100 2000 2000 2000 2000 2000
Table 4. Transformation of sulfur compounds. Comparison of the activity
(iso-conversion around 30% from feed B or C) (T = 250ºC, P = 2 MPa, CoMoS/Al2O3,
H2/feed = 360 NL/L).
2MT 3MT BT
Conversion (%) 28.2 23.1 33.4
Table 5 : Transformation of 2MT. Effect of the amount of H2S or BT. BT (ppmS) BT Conv. (%) PH2S from BT (kPa) Inhibiting effect Total (%) By H2S (%) By BT (%) 500 80.0 0.80 63.1 1.7 61.4 1000 60.3 1.20 68.3 2.8 65.5 1500 47.0 1.45 70.3 3.8 66.5
(conversion of 2MT of 42% from feed E and D, T = 250°C, P = 2 MPa, H2/feed = 360 NL/L,
Table 6. Transformation of BT. Effect of the amount of H2S or 2MT.
2MT Conv. (%) PH2S from 2MT (bar) Inhibiting effect Total (%) By H2S (%) By 2MT(%) 10.0 0.2 17.2 0 17.2 15.4 0.31 15.5 0 15.5 18.9 0.37 14.2 0 14.2
(conversion of BT of 30% from Feed D and F, T = 250 °C, P = 2 MPa, H2/feed = 360 NL/L,
Table 7. Kinetic parameters and adsorption parameters for the reaction of sulfur compounds, H2S and H2 (HDS: Hydrodesulfurization, HYD: Hydrogenation)
(T = 250°C, P = 2 MPa, H2/feed = 360 NL/L, CoMoS/Al2O3)
k x 1012 (h-1) Kads (bar-1 ) 2MT R1 (HDS) 2.8 ± 0.1 7.1 ± 0.3 R2 (HYD) 6.9 ± 0.3 3MT R3 (HDS) 5.1 ± 0.2 10.6 ± 0.5 R4 (HYD) 5.8 ± 0.3 BT R5 (HYD) 12 ± 0.6 12.4 ± 0.6 R6 (HDS) 19 ± 0.9 R7 (HDS) 3.4 10-3 ± 2 10-4 H2 - - 1.8 10-7 ± 9.0 10-9 H2S - - 0.5 ± 0.02
Scheme 1. Transformation of 2-methylthiophene (2MT): 2-methyltetrahydrothiophene (2MTHT), pent-1,3-diene (P13DN), pent-1-ene (P1N), pent-2-ene (P2N), n-pentane (nP).
Scheme 2. Transformation of 3-methylthiophene (3MT), 3-methyltetrahydrothiophene (3MTHT), 2-methyl-but-1-ene (2MBN1), 2-methyl-but-2-ene (2MBN2), 3MBN1 (3-methyl-but-1-ene), isopentane (iC5).
Scheme 3. Transformation of benzothiophene (BT): Dihydrobenzothiophene (DHBT), Ethylbenzene (EB).
Figure 1. Conversion of 2MT, 3MT and BT as a function of contact time. (T = 250ºC, P = 2 MPa, H2/feed = 360 NL/L, CoMoS/Al2O3).
0 20 40 60 80 100 0 1 2 3 4 5 6 7 8 9 Conv ersion (% ) Contact time (s) BT 3MT 2MT
Figure 2. Transformation of 2MT. Distribution of the products as a function of 2MT conversion (T = 250ºC, P = 2 MPa, CoMoS/Al2O3, H2/feed = 360 NL/L). t-P2N:
Figure 3. Transformation of 3MT. Distribution of products as a function of 3MT conversion. (T = 250ºC, P = 2 MPa, CoMoS/Al2O3, H2/feed = 360 NL/L). 2MB2N:
2-methylbut-2-ene, 2MB1N: 2-methylbut-1-ene, iC5: isopentane, 3MB1N: 3-methylbut-1-ene.
Figure 4. Transformation of BT. Distribution of products as a function of BT conversion. (T = 250ºC, P = 2 MPa, CoMoS/Al2O3, H2/feed = 360 NL/L). EB:
Figure 5. Transformation of 2MT: Comparison of simulation results (dotted lines) and experimental data (points) a) for the conversions of 2MT alone and in presence of BT and b) for the distribution of HDS products (pentane and pentenes). (T = 250ºC, P = 2 MPa, CoMoS/Al2O3, H2/feed = 360 NL/L).
Figure 6. Transformation of BT: Comparison of simulation results (dotted lines) and experimental data (points) a) for the conversion of BT alone and in mixture with 2MT and b) for the distribution of HDS products (Ethylbenzene : EB and Dihydrobenzothiophene : DHBT). (T = 250ºC, P = 2 MPa, CoMoS/Al2O3, H2/feed = 360
NL/L).
a)
Figure 7. Transformation of 3MT: Comparison of simulation results (dotted lines) and experimental data (points) a) for the conversion of 3MT and b) for the distribution of products (C5 alkenes and isopentane iC5). (T = 250ºC, P = 2 MPa, CoMoS/Al2O3, H2/feed
= 360 NL/L).
b) a)
![Table 1. Amount of sulfur compounds present in a feed containing 1.05 wt% of sulfur [17]](https://thumb-eu.123doks.com/thumbv2/123doknet/14759255.584140/16.892.112.791.234.596/table-sulfur-compounds-present-feed-containing-wt-sulfur.webp)