HAL Id: hal-00318195
https://hal.archives-ouvertes.fr/hal-00318195
Submitted on 21 Nov 2006
HAL is a multi-disciplinary open access
archive for the deposit and dissemination of
sci-entific research documents, whether they are
pub-lished or not. The documents may come from
teaching and research institutions in France or
abroad, or from public or private research centers.
L’archive ouverte pluridisciplinaire HAL, est
destinée au dépôt et à la diffusion de documents
scientifiques de niveau recherche, publiés ou non,
émanant des établissements d’enseignement et de
recherche français ou étrangers, des laboratoires
publics ou privés.
implementation of the ARPS/MM5 models
D. Pozo, I. Borrajero, J. C. Marin, G. B. Raga
To cite this version:
D. Pozo, I. Borrajero, J. C. Marin, G. B. Raga. A numerical study of cell merger over Cuba ? Part
I: implementation of the ARPS/MM5 models. Annales Geophysicae, European Geosciences Union,
2006, 24 (11), pp.2781-2792. �hal-00318195�
© European Geosciences Union 2006
Geophysicae
A numerical study of cell merger over Cuba – Part I:
implementation of the ARPS/MM5 models
D. Pozo1, I. Borrajero2, J. C. Mar´ın1, and G. B. Raga1
1Centro de ciencias de la Atm´osfera, UNAM, M´exico, Ciudad Universitaria, M´exico, DF, 04510, M´exico 2Instituto de Meteorolog´ıa de Cuba, Loma de Casablanca, Regla, C. Habana, Cuba
Received: 4 November 2005 – Revised: 19 September 2006 – Accepted: 20 September 2006 – Published: 21 November 2006
Abstract. On 21 July 2001 a number of severe storms
de-veloped over the region of Camaguey, Cuba, which were ob-served by radar. A numerical simulation was performed in order to realistically reproduce the development of the storms observed that day. The mesoscale model MM5 was used to determine the initial, boundary and update conditions for the storm-scale simulation with the model ARPS. Changes to the source code of ARPS were made in order to assimilate the output from the MM5 as input data and a new land-use file with a 1-km horizontal resolution for the Cuban territory was created.
A case representing the merger between cells at different stages of development was correctly reproduced by the simu-lation and is in good agreement with radar observations. The state of development of each cell, the time when the merger occurred, starting from the formation of clouds, the propa-gation motion of the cells and the increase in precipitation, due to the growth of the area after the merger, were correctly reproduced. Simulated clouds matched the main characteris-tics of the observed radar echoes, though in some cases, re-flectivity tops and horizontal areas were overestimated. Max-imum reflectivity values and the heights where these maxi-mum values were located were in good agreement with radar data, particularly when the model reflectivity was calculated without including the snow. The MM5/ARPS configuration introduced in this study, improved sensibly the ability to sim-ulate convective systems, thereby enhancing the local fore-casting of convection in the region.
Keywords. Meteorology and atmospheric dynamics
(Con-vective processes; Mesoscale meteorology; Precipitation)
Correspondence to: D. Pozo
(dianarpl@yahoo.com)
1 Introduction
On 21 July 2001 numerous severe storms developed over the region of Camag¨uey, Cuba, which were detected by radar. Cloud merger was observed in some of these storms, in-cluding one that later produced a hailstorm over the area. Cloud merger has been described with the use of numerical cloud models, together with observational studies (Simpson and Woodley, 1971; Houze and Cheng, 1977; Lopez, 1978; Westcott, 1994), focusing on finding pre-storm ambient con-ditions which favor the occurrence of a merger, in order to obtain qualitatively and quantitatively the aspects that may improve its prediction. However, most of those numerical studies on cloud merger have been initialized with horizon-tally homogeneous environments and some of them under conditions of weak wind and wind shear or even calm con-ditions (Wilkins et al., 1976; Orville et al., 1980; Turpeinen and Yau, 1981; Tao and Simpson, 1984; Kogan and Shapiro 1996), which simplify the simulations.
This paper presents results from a simulation obtained with the aid of two numerical models: the Advanced Re-gional Prediction System (ARPS) and the Fifth-Generation NCAR/Penn State Mesoscale Model (MM5). The environ-mental 3-D fields needed as input data to run ARPS were ob-tained from a mesoscale simulation using the MM5. The aim was to reproduce the development of the storms observed on 21 July 2001 in the most realistic way possible, avoiding the inclusion of initial perturbations. A case representing the merger between cells at different stages of development was reproduced, in agreement with that detected by radar. The physical mechanisms responsible for the occurrence of this cloud merger are studied in the second part of this work.
Sections 2 and 3 present the meteorological situation ob-served on 21 July 2001 and the radar description, respec-tively. A description of ARPS, detailing the modifications introduced in this study, the initialization procedure and the configuration used in MM5 are presented in Sect. 4. Results
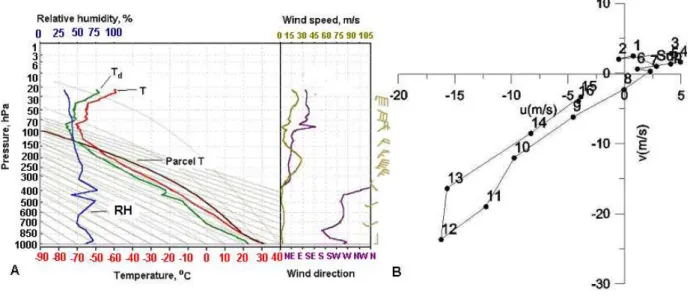
Fig. 1. (A) 18:00 GMT sounding of 21 July 2001, measured at the meteorological surface station of Camaguey, (B) representation of the
hodograph measured at that hour.
and discussion from the simulation are presented in Sect. 5. Finally, Sect. 6 presents the conclusions.
2 Meteorological situation of 21 July 2001
The meteorological situation over the region on that day was characterized by the influence of a weak high pressure with surface winds from the southwest. The maximum and mini-mum temperatures were 34.9◦C and 19.4◦C, respectively, as measured at Nuevitas (in the province of Camag¨uey), where a hailstorm was later reported.
The 18:00 GMT sounding from the Camag¨uey station (21◦25’ N, 77◦10’ W) (Fig. 1a) exhibits a deep moist layer, a well-mixed sub-cloud layer and high convective available potential energy (CAPE), of 3351 J/kg. The low level wind is relatively weak, with a variable direction from W–SW at low levels, but turning preferentially clockwise up to 10 km at the base of a jet from the NE that extends to 16 km (Fig. 1b). The wind profile presents three different layers in the tro-posphere: a low level shear layer from the surface to 7 km, a higher level shear layer with wind speeds increasing with height from 7 to 12 km, and a layer with wind speed decreas-ing with height from 12 to 16 km.
3 Radar description
The radar system used on this study was an MRL 5 model (made in the Soviet Union), with a wavelength of 10.14 cm, pulse power of 510 KW, a beam width of 1.5 deg and pulse length of 1 and 2 ms. It was located 2 km northeast of the center of the modelling domain. The radar and sounding data
employed in this study were obtained during a field ment. Several studies have been conducted on the experi-mental site in the Camaguey region (Koloskov et al., 1996; Alfonso et al., 1998; Mart´ınez and Gori, 1999).
The parameters selected for comparison with results from the simulation were the height of the reflectivity top (H ), the maximum reflectivity (Rmax), the height where the maxi-mum reflectivity is located (Hrmax) and the horizontal extent (Area) of the precipitation.
4 Model configuration and initialization
4.1 External 3-D meteorological field
An operationally implemented MM5 configuration was used for this study. Its output was used as input to ARPS to supply the external 3-D data and the mesoscale information needed to simulate the severe storms over Cuba. Changes in the source code for ARPS were introduced to accept the output of MM5. Three nested domains of 90×90 km, 30×30 km and 10×10 km of horizontal resolution were selected in the MM5 simulation, using the results of the innermost domain to include it as background. This simulation lasted 18 h from 21 July 2001 at 00:00 GMT and boundary conditions were updated every 6 h from the AVN model.
The external 3-D meteorological field used as input to ARPS in the present paper was made by the ADAS (ARPS’s Data Analysis System) (Brewster, 1996). For analysis of state variables, ADAS uses a successive-correction scheme (Bratseth, 1986) with a telescoping correlation parameter that allows for the use of a variety of data sets with vary-ing spatial resolution. Four analysis passes are performed,
Table 1. Maximum differences (Difmax) observed at the surface
between the background and the analysis when the surface stations data were included.
Variables Difmax Pressure (mb) 0.8 Temperature (◦C) 1.8
Mixing ratio (kg/kg) 1.00E–006 u-component (m/s) 1.4 v-component (m/s) 0.6
Table 2. Maximum differences (Difmax) observed between the
background and the analysis at heights (h) lower than 4 km and higher than 9 km when the sounding was included.
Variables Difmax Difmax (0<h<4 km) (h>9 km) Pressure (mb) 0.3 6.00E–002 Temperature (◦C) 0.5 0.05
Mixing ratio (kg/kg) 3.00E–007 6.00E–007 u-component (m/s) 1 1 v-component (m/s) 0.2 0.06
using increasingly smaller spatial correlation distances (300, 120, 80 and 60 km), with a corresponding vertical parameter of 500 m. The 18:00 GMT sounding from the Camag¨uey sta-tion and data from 29 local surface meteorological stasta-tions over the selected area were included, using as background the MM5 output.
Low-resolution simulations did not represent correctly the surface temperature of the Cuban island as the sea surface temperature because of its narrow extent. An improvement in this sense was obtained when the local surface meteorologi-cal stations data were included. Table 1 shows the maximum differences observed in several variables in the background field with and without the inclusion of the surface stations. A maximum difference of 1.8◦C in the surface temperature is seen.
Another problem related to the background simulation is that it did not reproduce accurately the magnitude and di-rection of the sea breeze, due to the coarse representation of the coastline, together with the subestimation of the surface temperature. When the wind surface data from the stations were included, important variations in magnitude and direc-tion were observed (Table 1), and the winds became more perpendicular along the coasts.
The mean temperature and wind variations were observed below an altitude of 4 km when the sounding was included (Table 2). On the other hand, the humidity was larger in the background than in the sounding above 8 km. This differ-ence in the moisture profile was also observed in the AVN
Fig. 2. Mother domains used in Sim1. MM5’s highest resolution
domain (10 km of horizontal resolution) which supplied the 3-D ex-ternal data to the intermediate simulation made with ARPS, with a 3-km horizontal resolution, which provided initial and boundary external data to the internal domain Sim1. The point represents the localization of the radar. The cross represents the center of the do-main in Sim1.
field which was used as an initialization in the MM5 sim-ulation. After the assimilation of the sounding data, no new convergence zones appeared in the boundaries of its radius of influence. In summary, after the assimilation of all the data, the convergence field in the regions where the storms formed increased up to 20%.
4.2 ARPS parameterizations and configuration
The numerical model ARPS was used and detailed informa-tion can be found in Xue et al. (1995, 2000, 2001, and 2003). A second order momentum advection scheme was used, as well as a sub-grid turbulence parameterization of the order of 1.5, which involves the solution of an additional forecast equation for the turbulent kinetic energy. The microphysics parameterization scheme of Lin et al. (1983) for mixed phase processes was selected.
A simulation with ARPS, with a 3 and 0.5 km horizontal and vertical resolution, respectively, was initiated with the external 3-D field from MM5. Lateral boundary conditions were updated from MM5 outputs every half an hour. The simulation was initiated at 18:00 GMT and was run for 6 h. Results from this intermediate simulation with ARPS sup-plied the initial and external boundary conditions data (ev-ery half an hour) to the current simulation (hereafter named Sim1). Sim1 was run for 4 h with a 1.5-km resolution in the horizontal and 0.5 km in the vertical direction. The center of the domain was situated at the site of the Camag¨uey upper air station. Figure 2 shows the domains used for each model.
Fig. 3. Land-use representation for the zone of interest in the province of Camaguey (corresponding to domain Sim1): (A) land-use with a
10-km resolution; (B) simulation using the land-use of 10 km where unrealistic clouds appeared; (C) new land-use representation at a 1-km horizontal resolution according to ARPS: 8 – Clay loam, 9 – Sandy clay, 10 – Silty clay, 11 –Clay, 13 – Water.
4.3 Topography and land use
The selected domains in Fig. 2 are located between two irreg-ular coastlines. In the afternoon hours, the sea breeze from both coasts generated zones of convergence, which favored the development of convection in the territory, in the absence of larger scale meteorological phenomena. The correct sim-ulation of the breezes depended on a good representation of the coastline and the sea/land temperature difference.
In a simulation using the land use with a 10-km of res-olution (highest resres-olution available in the model), several clouds also developed in the boundaries of the different land use types (Figs. 3A, B). As a result, the ARPS model was modified to allow the assimilation of a new land-use file with 1 km of resolution. The new land-use with a 1-km resolution for the province of Camag¨uey is shown in Fig. 3C. When the new land-use file was used, clouds formed at realistic loca-tions, in agreement with observations.
A sensitivity study was made where two simulations were performed with a terrain resolution of 10 km, 1 km and
us-ing the same land-use resolution of 1 km. Results showed that clouds developed in the same places in both simulations, since the highest elevation inside the inner domain was lower than the vertical resolution used, and is located several kilo-meters away from where the clouds formed. Thus, the role of the terrain to trigger convection in the inner domain was null, since it was almost flat in the region. However, in the outer domains there are zones with higher elevations that could generate orographic clouds. Both land-use and terrain, 1 km in resolution, were used in the simulation (Sim1).
5 Results and discussion
5.1 Comments on the merger process
Merger does not have a clear and established definition, as discussed by Wescott (1984, 1994), and since its first observational documentation (Byers and Braham, 1949) the term merger has been used in a wide range of situations. In
Fig. 4. Temporal evolution of the merger cells A1+A2 for 21 July 2001. (A, C, E): calculated reflectivity at h=3 km at 9600, 10 800 and
12 000 s. Shaded areas beginning at 10 dBz in intervals of 10 dBz. (B, D, F): corresponding radar images at 21:45, 22:05 and 22:25 GMT, respectively. Graphics from simulation correspond to a section of the whole domain.
observational studies, using conventional radar, merger has been described in terms of the reflectivity cores (Dennis et al., 1970; Lemon, 1976; Lopez, 1978; Cunning et al., 1982). In numerical modeling studies, merger has been usually described either in terms of maximum updrafts or rainwater isopleths forming a single core (Turpeinen, 1982; Tao and Simpson, 1984; 1989; Kogan and Shapiro, 1996). In the cur-rent study, merger is defined by the joining of maximum up-drafts and ranwater isolines in the analysis of the numerical simulation results. On the other hand, the joining of observed
reflectivity cores of at least 20 dBz will be taken as the occur-rence of merger when the radar data is analyzed.
5.2 Comparison between Sim1 and radar data
In real life, as well as in the simulation, more than one storm developed in the region of study. Two cases of cloud merger were observed in Sim1: one between cells at different stages of development, and another between cells with approxi-mately the same state of development. We present here the
Table 3. Parameters from simulated clouds in Sim1 (9600 s of simulation) and radar data at 21:45 GMT. H : reflectivity top height
(qr+qh+qs), H*: reflectivity top height (qr+qh), Rmax: maximum reflectivity value, Hrmax: height at maximum reflectivity value and reflectivity area.
Sim1 Radar
Clouds H H* Rmax Hrmax Area H Rmax Hrmax Area
(km) (km) (dBz) (km) (km2) (km) (dBz) (km) (km2) A1 14.5 11.5 59 6–7 145 10–11 61 7–8 63 A2 4.2 4.2 50 3-4 6 4–5 48 3–4 13.2
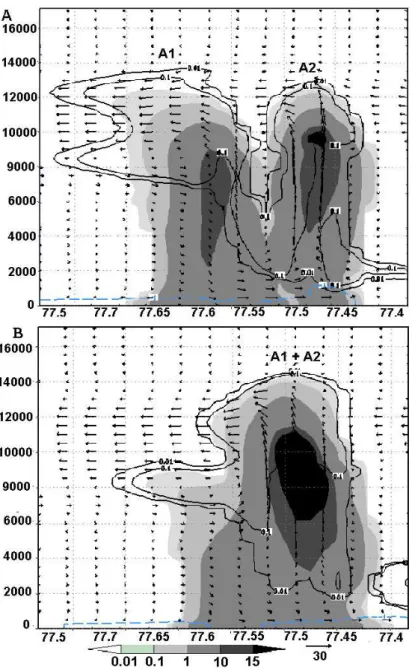
Fig. 5. Vertical cross section in Sim1. The shaded area represents qr+qh+qs, solid lines qc+qi, arrows represent wind velocity. (A) 9600 s
Table 4. Parameters from simulated clouds in Sim1 (10 800 s of simulation) and radar data at 22:05 GMT. H : reflectivity top height
(qr+qh+qs), H ∗: reflectivity top height (qr+qh), Rmax: maximum reflectivity value, Hrmax: height at maximum reflectivity value and reflectivity area.
Sim1 Radar
Clouds H H* Rmax Hrmax Area H Rmax Hrmax Area
(km) (km) (dBz) (km) (km2) (km) (dBz) (km) (km2) A1 11.2 10.2 61.7 4–5 123 9–10 63 3–4 74.8 A2 13.5 11.5 51 6–7 48.4 9-10 52 6–7 61.6
results of the former case and refer to Pozo (2004) for further discussion on the latter. The comparison between results of Sim1 and radar data shows that the state of development of each cloud, the time at which the merger took place, start-ing from the clouds formation; the direction of motion of the storms and the increase in precipitation due to the increment of the area after merger, were correctly reproduced.
The cloud merger was observed at 22:05 GMT in radar data, while in Sim1 it occurred at 21:00 GMT, correspond-ing with 10 800 s of simulation. Figure 4 shows this process three times, where radar images starting at 21:45 GMT and horizontal cross sections from Sim1, starting at 9600 s, are compared. The comparison begins 25 min before the cloud merger takes place in Sim1 and in the radar data at 5-min intervals. Figures from Sim1 and radar images have a hori-zontal resolution of 1.5 and 1.3 km, respectively. Reflectivity values above 10 dBz are shown in the figures, which is the minimum value observed in radar images. The 2500–3500-m layer for radar images and the horizontal plane at z=3000 m from Sim1 were chosen to better illustrate the merger pro-cess, which occurred well away from domain boundaries. 5.2.1 Cloud merger between cells at different stages of
de-velopment
At 9600 s of simulation (Fig. 4A), two cells, A1 and A2, are developing. Cell A1 is in its development stage, while A2 is still in its formation stage. This is also observed in Fig. 4B, at 21:45 GMT for the radar image. The value of H for A2 (Table 3) was similar to the value observed in the radar im-age at 21:45 GMT, while H was overestimated for A1. Rmax and Hrmax for both cells were in good agreement with values observed in the radar images. Reflectivity areas present the largest differences, with A1 in Sim1 greatly overestimating the observed value and A2 underestimating it. Qualitatively, A1 was wider than A2 and the simulated parameters repre-sent adequately the stage of development of each cloud.
Figure 5A shows the vertical cross section of interact-ing clouds A1 and A2 at 9600 s of simulation, through the maximum updrafts of the cells. The shaded area repre-sents the sum of the rainwater, snow and hail mixing ratios (qr +qh+qs), solid lines represent cloud water and ice
wa-ter mixing ratio (qc+qi). Arrows represent the wind velocity vector in the X-Z plane. Cell A1 extends vertically up to 14.5 km and horizontally for 20 km. It has a maximum up-draft of 35 m/s, a maximum rainwater content (qr) of 15 g/kg and values of hail content (qh) higher than 10 g/kg. Cell A2 appears to the right of A1 with a weak updraft and complete absence of downdraft, maximum values of qr of 4.47 g/kg and cloud top height (defined as the height where the sum of the hydrometeors is greater than 0.01 g/kg ) below 4.5 km. Hail and ice water contents are not present, and its width does not exceed 4.5 km. Both cells appear joined by a cloud bridge in Fig. 5B (10 200 s). The observation of a cloud bridge be-fore the cloud merger has been reported in many studies and has been associated with the convergence of cold outflows from downdrafts of interacting clouds (Simpson et al., 1980; Cunning and DeMaria, 1986; Wescott and Kennedy, 1989). Tao and Simpson (1984, 1989) also observed a cloud bridge preceding the cloud merger in studies with numerical simu-lations. The cloud bridge could not be seen in radar images because of the low reflectivity values and the coarse resolu-tion of the radar.
Ten minutes later (10 800 s of simulation), cell A1 is in an advanced stage (Fig. 6A), with high values of precipitation at the surface and significant downdrafts. A2 initiates its de-velopment stage with updrafts larger than 30 m/s. Table 4 shows that H and Hrmax have decreased in A1 and Rmax increased for both Sim1 and the radar data. On the other hand, an increase in all parameters in A2 is observed in both the simulation and radar data (Figs. 4C, D). All parameters simulated were in good agreement with values observed in radar data at 22:05 GMT, though H and the area for A2 were somewhat over and underestimated, respectively.
At 10 800 s (Fig. 6A) values of rainwater larger than 1 g/kg have begun to merge at mid-levels. Updraft cores have not joined yet at higher levels, leaving both cloud tops clearly separated. Part of the downdraft from A1 is incorporated into the updraft in A2, strengthening the convergence that favors its development. It is obvious that the two cells are at different stages in their development. Cell A1 is starting to decay at the time of the merger, but after it happens, the new cloud rapidly develops, reaching up to 14 km (Fig. 6B).
Fig. 6. Vertical cross section in Sim1. The shaded area represents qr+qh+qs, solid lines qc+qi, arrows represent wind velocity. (A) 10 800 s
of simulation. (B) 11 400 s of simulation. The dashed blue line represents the cold pool of A1+A2.
A comparison between the first level of Sim1 and the sur-face stations data was made at 10 800 s to analyze to what extent the simulation was in agreement with the measured surface data (it was the only observation data available dur-ing Sim1). Figure 7 shows the temperature (Fig. 7A) and the wind components (Figs. 7B, C) at the surface from the model and the station data at 10 800 s of simulation. The figure indi-cates a model cool bias of about –0.4◦C when compared with the surface data. The wind components in the model are in good agreement with observations, except at the scs station, where the v-component of the wind differs by 1.5 m/s from the observed value. Despite the good agreement in the
com-parison, it should be noted that it is made between the first level of the model (100 m) and surface stations data, thereby introducing an uncertainty.
At 11 400 s of simulation (Fig. 6B), a single updraft dom-inating the merged cloud A1+A2 is seen, co-located with a maximum reflectivity core, showing an increase in the max-imum updraft from the previous time. This confirms the oc-currence of cloud merger by the coalescence of interacting updrafts at middle and higher levels coincident with a max-imum reflectivity core (Kogan and Shapiro, 1996; Stalker and Knupp, 2003). Byers and Braham (1949) and Bringi et al. (1997) in observational studies and Kogan and Shapiro
Fig. 7. Horizontal cross section at the surface at 10 800 s. (A): Temperature (◦C). (B): u-component (m/s). (C): v-component (m/s). The
simulation values are drawn in shaded contours. Squares represent the station locations, with their station ID and observation values. A –999 value represents a missing data.
Table 5. Parameters from simulated clouds in Sim1 (11 400 s of simulation) and radar data at 22:15 GMT. H : reflectivity top height
(qr+qh+qs), H ∗: reflectivity top height (qr+qh), Rmax: maximum reflectivity value, Hrmax: height at maximum reflectivity value and reflectivity area.
Sim1 Radar
Clouds H H* Rmax Hrmax Area H Rmax Hrmax Area
(km) (km) (dBz) (km) (km2) (km) (dBz) (km) (km2) A1+A2 14 11.5 66 6–7 198 11–12 70 5–6 206
(1996) and Stalker and Knupp (2003) in numerical studies considering rainwater isolines, have shown similar results. Downdrafts are dominant at low levels and a new cell ap-pears to the right of A2 due to the convergence with the envi-ronmental wind (Fig. 6B). The new cell moved in a northeast direction, together with new developing cells. The forma-tion and movement of new cells was in good agreement with radar observations.
Table 5 shows an increase in H , Rmax and the reflectivity area for merged clouds, both in Sim1 and the radar data, with respect to the original cells when compared with the previ-ous time. A similar evolution has been described by Lemon (1976), Houze and Cheng (1977), Wescott (1977) and Wood-ley et al. (1982). Hrmax, however, decreased in both cases after merger.
At 12 000 s of simulation, simulated values were in good agreement with the corresponding values determined by the
Table 6. Parameters from simulated clouds in Sim1 (12 000 s of simulation) and radar data at 22:25 GMT. H : reflectivity top height
(qr+qh+qs), H ∗: reflectivity top height (qr+qh), Rmax: maximum reflectivity value, Hrmax: height at maximum reflectivity value and reflectivity area.
Sim1 Radar
Clouds H H* Rmax Hrmax Area H Rmax Hrmax Area
(km) (km) (dBz) (km) (km2) (km) (dBz) (km) (km2) A1+A2 12 11.5 66 2–3 193 11–12 67 2–3 167
Table 7. Calculated mean square error of H , Rmax and Hrmax from
Sim1 and radar error.
H Rmax Hrmax (km) (dBz) (km) Root mean square 1.0 1.2 0.6
error for Sim1
Radar error 1.3 5 1.3
Fig. 8. Reflectivity top height from Sim1 vs. reflectivity top height
from radar. Bar error represents the 1.3 km of radar error. The solid line corresponds to 1:1.
radar at 22:25 GMT (Table 6). Even though the area shows some difference with the observed value, this difference is close to the estimated error, as will be discussed below. Ev-idence of the occurrence of cloud merger at 12 000 s of sim-ulation and 22:25 GMT can also be appreciated in Figs. 4E, F, where a clear single cloud A1+A2 is seen.
In general, in Fig. 4, it can be observed that cloud positions were in good agreement with the radar data during the
simu-lation time. The main difference can be found at 10 800 s for A2, which was located 6.5 km to the northwest.
Another case of merger simulated in Sim1 between cells at almost the same stage of development was also analyzed and similar results to those presented here were obtained re-garding the comparison with radar data. No strengthening of the system took place in this case after the merger, perhaps due to the advanced stage of development of the clouds.
6 Error analysis
Table 7 shows the root mean square error calculated for H ,
Rmax and Hrmax derived from the simulations and from
radar observations. Errors calculated for these three param-eters in Sim1 are within the range of error of radar measure-ments. The error in the reflectivity area measured by radar is 20%, so its relative error was estimated. The comparison shows that 60% of the simulated cases exceeded the radar error.
Mean square errors calculated for maximum values like
Rmax and Hrmax were smaller than for H and the area
de-rived from a radar with fairly coarse resolutions. The area is defined by a contour of minimum reflectivity values detected by radar and the probability of measuring them with a large error is higher than when measuring maximum values. Even though the area had the largest error, it behaved qualitatively as observed by radar. A reason for the differences may be related to the fact that a 10-cm radar cannot distinguish dry snow, as that present near the top of the cloud. The simulated values of a reflectivity top included qr, qh and qs, but when the reflectivity was recalculated, taking into account only qr and qh, new reflectivity top values (H*) were obtained. Fig-ure 8 shows the sensitivity of the height of the reflectivity top, and though some values of H* are still overestimated, they are in closer agreement to radar observations than H values determined from qr, qh and qs.
7 Conclusions
The model ARPS was modified to assimilate the output from the MM5 model as input data and a new land-use file with
1-km horizontal resolution for Cuba was incorporated, im-proving its ability to simulate convective systems in this area. The simulations utilized the output from MM5 as initial and boundary conditions, as well as upper air data and comple-mentary surface data from the region. The ARPS simulation with this configuration reproduced successfully the general features of the behavior of the severe storms that occurred on 21 July 2001. The good agreement between simulated and observed cloud systems indicate that the improved con-figuration for ARPS/MM5 can be used in local forecasts of convective storms in the region.
An analysis of a case representing the merger between cells at different stages of development, which was correctly reproduced by the simulation and in good agreement when compared with radar observations, was presented. The state of development of each cell, the time when the merger oc-curred, starting from the clouds formation, the propagation motion of the cells and the increase in precipitation due to the growth of the area after the merger were correctly repro-duced. Overall, simulated clouds matched the main char-acteristics of the observed radar echoes, though in some cases, reflectivity top and horizontal cell areas were overes-timated. Maximum reflectivity values and the height where these maximum values were located were in good agreement with radar observations. The removal of the qs field in the calculation of the height of the reflectivity top improved the agreement with radar observations, perhaps suggesting either that the snow was overestimated in the simulation or that the coarse radar resolution was unable to detect the snow present. The physical processes responsible for the case represent-ing the merger presented here are explored further in a com-panion paper, where idealized conditions of cell development are used.
Acknowledgements. The authors would like to thank both
review-ers for their comments and suggestions which improved the quality of this paper. The authors also thanks the Oklahoma University for giving free access to ARPS model.
Topical Editor F. D’Andrea thanks K. Brewster and another ref-eree for their help in evaluating this paper.
References
Alfonso, L., Mart´ınez, D., and P´erez, C. A.: Numerical simulation of tropical convective clouds over Cuba using a one-dimensional and time-dependent cloud model, Atmospheric Research, 47–48, 343–354, 1998.
Bratseth, A. M.: Statistical interpolation by means of successive corrections. Tellus, 38A, 439–447, 1986.
Brewster, K.: Application of a Bratseth analysis scheme including Doppler radar data, Preprints, 15th Conference on Weather Anal-ysis and Forecasting, Amer. Meteor. Soc., Norfolk, VA, 92–95, 1996.
Bringi, V. N., Knupp, K. R., Detwiler, A., Liu, L., and Black, R. A.: Evolution of a Florida Thunderstorm during the Convection and
Precipitation/Electrification Experiment: The case of 9 August 1991, Mon. Wea. Rev., 125, 2131–2160, 1997.
Byers, H. R. and Braham, R. R.: The Thunderstorm, U.S. Weather Bur., Washington D.C., 287, 1949.
Cunning, J. B. and DeMaria, M.: An investigation of development of cumulonimbus systems over South Florida, Part I: Boundary layer interactions, Mon. Wea. Rev., 114, 5–24, 1986.
Cunning, J. B., Holle, R. H., Gannon, P. T., and Watson, A. I.: Convective evolution and merger in the FACE experimental area: Mesoscale convection and boundary layer interactions. J. Appl. Meteor., 21, 953–977, 1982.
Dennis, A. S., Schock, C. A., and Koscielsky, A.: Characteristics of hailstorms of western South Dakota. J. Appl. Meteor., 9, 127– 135, 1970.
Houze Jr., R. A. and Cheng, C.-P.: Radar characteristics of tropical convection observed during GATE: Mean properties and trends over the summer season, Mon. Wea. Rev., 105, 964–980, 1977. Kogan, Y. L. and Shapiro, A.: The simulation of a convective cloud
in a 3D model with explicit microphysics, Part II: Dynamical and microphysical aspects of cloud merger, J. Atmos. Sci., 53, 17, 2525–2545, 1996.
Koloskov, B., Zimin, B., Beliaev, V., Seregin, Y.,Chernikov, A., Petrov, V., Vald´es, M., Mart´ınez, D., P´erez, C., and Puente, G.: Results of Experiments on Convective Precipitation Enhance-ment in the Camag¨uey ExperiEnhance-mental Area, Cuba. Jour. Appl. Meteor., 45, 9, 1524–1534, 1996.
Lemon, L. R.: The flanking line, a severe thunderstorm intensifica-tion source, J. Atmos. Sci., 33, 686–694, 1976.
Lin, Y. L., Farley, R. D., and Orville, H. D.: Bulk parameterization of the snow field in a cloud model, J. Clim. Appl. Meteor., 22, 1065–1092, 1983.
Lopez, R. E.: Internal structure and development processes of C-scale aggregates of cumulus clouds, Mon. Wea. Rev., 106, 1488– 1494, 1978.
Mart´ınez, D. and Gori, E. G.: Raindrop size distributions in convec-tive clouds over Cuba. Atmos. Res., 52, 221–239, 1999. Orville, H. D., Kuo, Y.-H., Farley, R. D., and Hwang, C. S.:
Nu-merical simulation of cloud interactions, J. Rech. Atmos., 14, 499–516, 1980.
Pozo, D. R.: Simulaci´on num´erica de la formaci´on y evoluci´on de sistemas nubosos convectivos de mesoescala sobre Camag¨uey con ayuda de un modelo tridimensional, Ph. D. dissertation, In-stituto de Meteorolog´ıa. Cuba, 123, 2004.
Simpson, J. and Woodley, W. L.: Seeding cumulus in Florida, New 1970 results. Science, 172, 117–126, 1971.
Simpson, J., Westcott, N. E., Clerman R. J., and Pielke, R. A.: On cumulus mergers, Arch. Meteor. Geophys. Bioklim., 29A, 1–40, 1980.
Stalker, J. R. and Knupp, K. R.: Cell merger potential in multicell thunderstorms of weakly sheared environments: Cell separation distance versus planetary boundary layer depth, Mon. Wea. Rev., 131, 1678–1695, 2003.
Tao, W. K. and Simpson, J.: Cloud interactions and merging: Nu-merical simulations. J. Atmos. Sci., 41, 2901–2917, 1984. Tao, W. K. and Simpson, J.: A further study of cumulus
interac-tions and mergers: Three dimensional simulainterac-tions with trajectory analyses, J. Atmos. Sci., 46, 2974–3004, 1989.
Turpeinen, O. and Yau, M. K.: Comparisons of results from a three-dimensional cloud model with statistics of radar echoes on day
261 of GATE, Mon. Wea. Rev., 109, 1495–1511, 1981. Turpeinen, O.: Cloud interactions and merging on day 261 of
GATE, Mon. Wea. Rev., 110, 1238–1254, 1982.
Wescott, N. E.: Radar characteristics of South Florida convective rainfall. Proceedings, Sixth Conference on Planned and Inadver-tent Weather Modifications, Champaign-Urbana, I11, 10–13 Oc-tober 1977, AMS, Boston, 190–191, 1977.
Wescott, N. E.: A historical perspective on cloud mergers. Bull. Amer. Meteor. Soc., 65, 219–226, 1984.
Westcott, N. E.: Merging of convective clouds: Cloud initiation, bridging, and subsequent growth. Mon. Wea. Rev., 122, 780– 790, 1994.
Wescott, N. E. and Kennedy, P. C.: Cell development and merger in an Illinois thunderstorm observed by Doppler radar, J. Atmos. Sci., 46, 117–131, 1989.
Wilkins, E. M., Sasaki, Y. W., Gerber, G. E., and Chaplin, Jr., W. H.: Numerical simulation of lateral interactions between buoyant clouds. J. Atmos. Sci., 33, 1321–1329, 1976.
Woodley, W. L., Jill, L., Barnston, A., Simpson, J., Biondini, R., and Flueck, J.: Rainfall results of the Florida Area Cumulus Ex-periments, 1970–1976, J. Appl. Meteor., 21, 139–164, 1982.
Xue, M., Droegemeier, K. K., Wong, V., Shapiro A., and Brew-ster, K.: ARPS Version 4.0 User’s Guide, Available from Center for Analysis and Prediction of Storms, University of Oklahoma, Norman OK 73072, 380, 1995.
Xue, M., Droegemeier, K. K., and Wong, V.: The Advanced Re-gional Prediction System (ARPS) – A multiscale nonhydrostatic atmospheric simulation and prediction tool, Part I: Model dy-namics and verification, Meteor. Atmos. Physics., 75, 161–193, 2000.
Xue, M., Droegemeier, K. K., Wong, V., Shapiro, A., Brewster, K., Carr, F., Weber, D., Liu, Y., and Wang, D.-H.: The Advanced Regional Prediction System (ARPS) – A multiscale nonhydro-static atmospheric simulation and prediction tool, Part II: Model physics and applications, Meteor. Atmos. Physics., 76, 134–165, 2001.
Xue, M., Wang, D.-H., Gao, J.-D., Brewster, K., and Droegemeier, K. K.: The Advanced Regional Prediction System (ARPS), storm-scale numerical weather prediction and data assimilation, Meteor. Atmos. Physics, 82, 139–170, 2003.