HAL Id: hal-02618162
https://hal.inrae.fr/hal-02618162
Submitted on 25 May 2020
HAL is a multi-disciplinary open access
archive for the deposit and dissemination of
sci-entific research documents, whether they are
pub-lished or not. The documents may come from
teaching and research institutions in France or
abroad, or from public or private research centers.
L’archive ouverte pluridisciplinaire HAL, est
destinée au dépôt et à la diffusion de documents
scientifiques de niveau recherche, publiés ou non,
émanant des établissements d’enseignement et de
recherche français ou étrangers, des laboratoires
publics ou privés.
Distributed under a Creative Commons Attribution - ShareAlike| 4.0 International
License
Data for fish stock assessment obtained from the cmsy
algorithm for all global fao datasets
Arnaud Helias
To cite this version:
Arnaud Helias. Data for fish stock assessment obtained from the cmsy algorithm for all global fao
datasets. Data, MDPI, 2019, 4 (2), �10.3390/data4020078�. �hal-02618162�
Data 2019, 4, 78; doi:10.3390/data4020078 www.mdpi.com/journal/data
Data Descriptor
Data for Fish Stock Assessment Obtained from the
CMSY Algorithm for all Global FAO Datasets
Arnaud Hélias 1,2,3
1 LBE, Montpellier SupAgro, INRA, University of Montpellier, 11100 Narbonne, France;
2 Elsa, Research group for Environmental Life cycle and Sustainability Assessment,
34060 Montpellier, France
3 Chair of Sustainable Engineering, Technische Universität Berlin, Berlin 10623, Germany
Received: 10 May 2019; Accepted: 23 May 2019; Published: 24 May 2019
Abstract: Assessing the state of fish stocks requires the determination of descriptors. They
correspond to the absolute and relative (to the carrying capacity of the habitat) fish biomasses in the ecosystem, and the absolute and relative (to the intrinsic growth rate of the population) fishing mortality resulting from catches. This allows, among other things, to compare the catch with the maximum sustainability yield. Some fish stocks are well described and monitored, but for many data-limited stocks, catch time series are remaining the only source of data. Recently, an algorithm (CMSY) has been proposed, allowing an estimation of stock assessment variables from catch and resilience. In this paper, we provide stock reference points for all global fisheries reported by Food and Agriculture Organization (FAO) major fishing area for almost 5000 fish stocks. These data come from the CMSY algorithm for 42% of the stock (75% of the global reported fish catch) and are estimated by aggregated values for the remaining 58%.
Dataset: 10.5281/zenodo.2669064 Dataset License: CC-BY-SA
Keywords: fisheries; FAO area; catch time series; CMSY; biomass; fishing effort; maximum
sustainability yield
1. Summary
Data are mainly presented through a table listing for the 4993 species-area associations, the main characteristics of the Food and Agriculture Organization (FAO) database (common name, scientific name, FAO area ID, current catch) and the assessed stock descriptors (the fishing mortality F, the fishing mortality at the maximum sustainability yield FMSY, the ratio FFMSY, the biomass B, the biomass at the maximum sustainability yield BMSY, and the ratio BBMSY, all with corresponding confidence intervals).
The accuracy of the assessments is qualitatively determined through a classification which
addresses the potential bias on the results and quantitatively by the confidenceintervals of stock
parameters. Classes are defined according to the available data (time series duration, missing data...) and the necessary assumptions (for non-fish species and multi-species datasets).
For 2917 stocks, the available data do not allow the use of the CMSY algorithm [1]. These results of too many blank years in the time series, too short data time series, too many species aggregated in the dataset, or non-convergence of the algorithm. For these entries, F, FMSY, FFMSY and BBMSY are estimated from other areas. B and BMSY are calculated in accordance with the current catch.
Data 2019, 4, 78 2 of 5
This table is supplemented for the 2076 directly assessed stocks by: (1) the graphical outputs of the CMSY algorithm, (2) the log files, and (3) graphs and corresponding data showing the temporal variation of the relative biomass versus the relative fishing mortality over the catch time series (with and without error bars). Stocks are defined for the ASFIS (Aquatic Sciences and Fisheries Information System) species by FAO Major Fishing Area, except for tuna and tuna-like species assessed at ocean (or half-ocean) scale.
2. Data Description
2.1. Descriptors Table
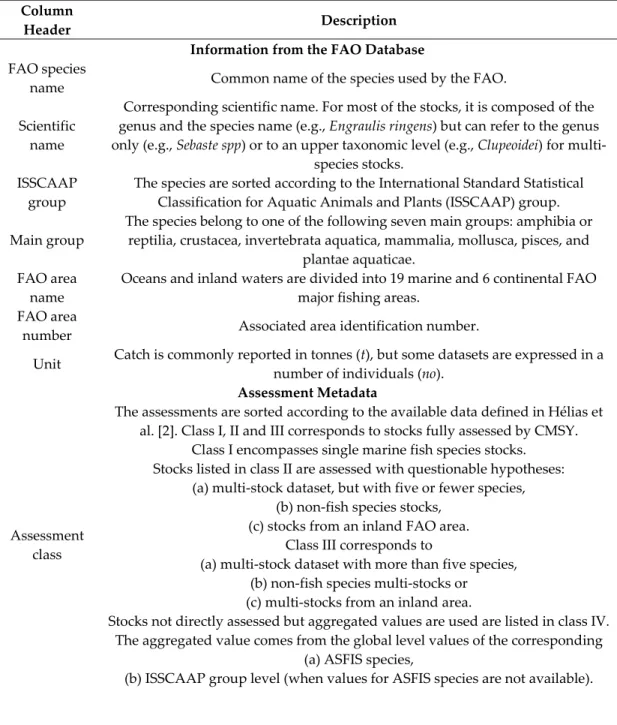
The main table (“Fish stock assessment data.xlsx”) contains the following columns which can be organized in three categories: (1) information from the FAO database, (2) assessment metadata and (3) assessment result. Table 1 describes the column contains.
Table 1. Description of the result table.
Column
Header Description
Information from the FAO Database
FAO species
name Common name of the species used by the FAO.
Scientific name
Corresponding scientific name. For most of the stocks, it is composed of the genus and the species name (e.g., Engraulis ringens) but can refer to the genus only (e.g., Sebaste spp) or to an upper taxonomic level (e.g., Clupeoidei) for
multi-species stocks. ISSCAAP
group
The species are sorted according to the International Standard Statistical Classification for Aquatic Animals and Plants (ISSCAAP) group. Main group
The species belong to one of the following seven main groups: amphibia or reptilia, crustacea, invertebrata aquatica, mammalia, mollusca, pisces, and
plantae aquaticae. FAO area
name
Oceans and inland waters are divided into 19 marine and 6 continental FAO major fishing areas.
FAO area
number Associated area identification number.
Unit Catch is commonly reported in tonnes (t), but some datasets are expressed in a
number of individuals (no).
Assessment Metadata
Assessment class
The assessments are sorted according to the available data defined in Hélias et al. [2]. Class I, II and III corresponds to stocks fully assessed by CMSY.
Class I encompasses single marine fish species stocks. Stocks listed in class II are assessed with questionable hypotheses:
(a) multi-stock dataset, but with five or fewer species, (b) non-fish species stocks,
(c) stocks from an inland FAO area. Class III corresponds to
(a) multi-stock dataset with more than five species, (b) non-fish species multi-stocks or (c) multi-stocks from an inland area.
Stocks not directly assessed but aggregated values are used are listed in class IV. The aggregated value comes from the global level values of the corresponding
(a) ASFIS species,
Comment
Additional information, reason why the stock is not assessed by the CMSY algorithm or reference to the determination of the number of species of non-fish
species. Interpolated
data
Fraction (%) of the catch time-series interpolated (CMSY algorithm requires continuous times series without blank years).
Resilience Resilience of the species coming from Fishbase.
C Average catch (t/yr or no/yr) over the last three years of the time series
Year Last year in the time series.
Stock ID
Internal stock identification code composed by [scientific name]_[FAO area number]_[internal ID]. This code is used in the name of the additional files
provided (see below).
Assessment Result
B Average biomass in the area over the last three years (t or no). For class IV, B =
C/F.
Bmin Lower bound of the 95% confidence interval of B. For class IV, Bmin = C/Fmax.
Bmax Upper bound of the 95% confidence interval of B. For class IV, Bmax = C/Fmin.
BBMSY Relative average biomass in the area over the last three years (i.e., B/BMSY,
unitless). For class IV, the weighted median of corresponding stocks is used.
BBMSY,min Lower bound of the 95% confidence interval of BBMSY. For class IV, the weighted
median of corresponding stocks is used.
BBMSY,max Upper bound of the 95% confidence interval of BBMSY. For class IV, the weighted
median of corresponding stocks is used.
F Average fishing mortality in the area over the last three years (yr
−1). For class IV, the weighted median of corresponding stocks is used.
Fmin Lower bound of the 95% confidence interval of F. For class IV, the weighted
median of corresponding stocks is used.
Fmax Upper bound of the 95% confidence interval of F. For class IV, the weighted
median of corresponding stocks is used.
FFMSY
Relative average fishing mortality in the area over the last three years (i.e.,
F/FMSY, unitless). For class IV, the weighted median of corresponding stocks is
used.
FFMSY,min Lower bound of the 95% confidence interval of FFMSY. For class IV, the weighted
median of corresponding stocks is used.
FFMSY,max Upper bound of the 95% confidence interval of FFMSY. For class IV, the weighted
median of corresponding stocks is used.
BMSY Biomass compatible with the maximum sustainability yield (t or no). For class
IV, BMSY = (C/Fmax)/(BBMSY).
BMSY,min Lower bound of the 95% confidence interval of BMSY. For class IV, BMSY,min =
(C/Fmax)/(BBMSY,max).
BMSY,max Upper bound of the 95% confidence interval of BMSY. For class IV, BMSY,max =
(C/Fmin)/(BBMSY,min).
FMSY Fishing mortality compatible with the maximum sustainability yield (yr
−1). For class IV, the weighted median of corresponding stocks is used.
FMSY,min Lower bound of the 95% confidence interval of FMSY. For class IV, the weighted
median of corresponding stocks is used.
FMSY,max Upper bound of the 95% confidence interval of FMSY. For class IV, the weighted
median of corresponding stocks is used.
2.2. Traceability of Algorithm Runs
The two input files of the CMSY algorithm are provided. “Catchseries.csv” contains all catch data from the FAO database and “Metadata.csv” additional information needed (mainly the
Data 2019, 4, 78 4 of 5
resilience). The log files of CMSY algorithm (“[Stock ID] CMSY log file.txt”) and the graphical output (“[Stock ID].jpeg”) are available for each assessed stock.
2.3. Stock Status
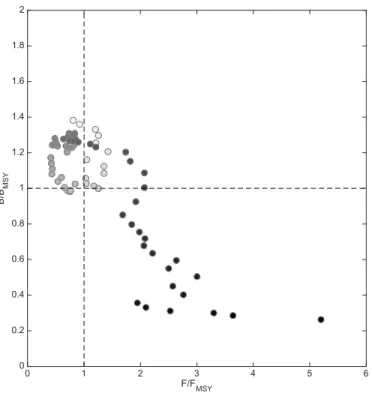
Temporal variations of the stock status over the time series are illustrated by figures showing
FFMSY versusandBBMSY (for all assessed stock with the CMSY algorithm: class I, II, and III). The
scatterplots are provided without uncertainty (“[Stock ID] stock status.pdf”) and with error bars (“[Stock ID] stock status (with uncertainty).pdf”). The corresponding tables are also available (“[Stock ID] stock status.csv”). Figure 1 illustrates the stock status of the Atlantic bluefin tuna (Scombridae,
Thunnus thynnus) for the eastern Atlantic as an example. Target relative biomass (BBMSY = 1) and target relative fishing mortality (FFMSY = 1) are drawn with dashed lines. When BBMSY < 1, the stock is overexploited and when FFMSY > 1, the fishing effort is too high. The temporal evolution is given by the greyscale of the dot, from white for the oldest value to black for the most recent one (here from 1950 to 2015).
Figure 1. Temporal variation of the stock status for bluefin tuna in eastern Atlantic.
3. Methods
Data pretreatment and data processing are detailed in Hélias et al. [2] (in the article and in the associated supplementary materials). The stocks descriptors are used in [2] for the computation of characterization factors for biotic resource depletion, but not provided.
The recently proposed CMSY algorithm [1] (November 2016 version) allows the computation of fish population descriptors and parameters from only the resilience and catch time series. Resilience to fishing pressure values were obtained from FishBase [3] with the rfishbase v2.1.1 Library [4]. Catch time series were used for species of FAO Global Fishery and Aquaculture Statistics, v2017.1.0, with
time series spanning between 1950 and 2015 [5], through the FishStatJ® interface.
The FAO Fisheries and Aquaculture Department provides global fish catch data from landings and by-catches reported by countries. Reported catch has to follow the Coordinating Working Party on Fishery Statistics handbook [6] to ensure data consistency. If unintentional catch (by-catch and
0 1 2 3 4 5 6 F/FMSY 0 0.2 0.4 0.6 0.8 1 1.2 1.4 1.6 1.8 2 B/B MSY
discards) should be reported, FAO data do not inventory illegal and undeclared fishing activities. Actual catch may be significantly higher than FAO values, but they cannot be assessed with the available data. Illegal fishing is therefore not addressed by stock parameters provided in this work and might introduce non-quantifiable errors in values.
A fish stock (i.e., a population in ecology) is defined by a given species in a specific habitat. With the FAO dataset, the stock is defined by an ASFIS-species in a FAO area. This could lead to additional inconsistencies between FAO-based stock parameters and real (but not available) values. The stock parameters have to be used accordingly and with caution, but a special attention in the qualitative classification has been devoted to multi-stock datasets, when several caught species or several associated habitats are merged into a unique available FAO dataset. See Hélias et al. [2] for more details.
Funding: This work was supported by the French National Research Agency, under contract GreenAlgOhol
ANR-14-CE05-0043 and IDEALG ANR-10-BTBR-04.
Conflicts of Interest: The author declares no conflict of interest.
References
1. Froese, R.; Demirel, N.; Coro, G.; Kleisner, K.M.; Winker, H. Estimating fisheries reference points from catch and resilience. Fish Fish. 2017, 18, 506–526.
2. Hélias, A.; Langlois, J.; Fréon, P. Fisheries in life cycle assessment: Operational factors for biotic resources depletion. Fish Fish. 2018, 19, 951–963.
3. Froese, R.; Pauly, D. FishBase. Available online: www.fishbase.org (accessed on 24 May 2019).
4. Boettiger, C.; Lang, D.T.; Wainwright, P.C. rfishbase: exploring, manipulating and visualizing FishBase data from R. J. Fish Biol. 2012, 81, 2030–2039.
5. FAO Fishery Statistical Collections—Capture Production Available online: http://www.fao.org/fishery/collection/global-capture-production/en (accessed on 30 January 2018).
6. FAO Coordinating Working Party on Fishery Statistics (CWP) Available online: http://www.fao.org/cwp-on-fishery-statistics/en/ (accessed on 23 May 2019).
© 2019 by the authors. Licensee MDPI, Basel, Switzerland. This article is an open access article distributed under the terms and conditions of the Creative Commons Attribution (CC BY) license (http://creativecommons.org/licenses/by/4.0/).