HAL Id: hal-01928226
https://hal-univ-rennes1.archives-ouvertes.fr/hal-01928226
Submitted on 24 Nov 2018HAL is a multi-disciplinary open access archive for the deposit and dissemination of sci-entific research documents, whether they are pub-lished or not. The documents may come from teaching and research institutions in France or abroad, or from public or private research centers.
L’archive ouverte pluridisciplinaire HAL, est destinée au dépôt et à la diffusion de documents scientifiques de niveau recherche, publiés ou non, émanant des établissements d’enseignement et de recherche français ou étrangers, des laboratoires publics ou privés.
Francesca Romana Mancini, Kalina Rajaobelina, Courtney Dow, Tina
Habbal, Aurélie Affret, Beverley Balkau, Fabrice Bonnet, Marie-Christine
Boutron-Ruault, Guy Fagherazzi
To cite this version:
Francesca Romana Mancini, Kalina Rajaobelina, Courtney Dow, Tina Habbal, Aurélie Affret, et al.. High iodine dietary intake is associated with type 2 diabetes among women of the E3N-EPIC cohort study. Clinical Nutrition, Elsevier, In press, �10.1016/j.clnu.2018.08.015�. �hal-01928226�
M
AN
US
CR
IP
T
AC
CE
PT
ED
High iodine dietary intake is associated with type 2 diabetes among
1
women of the E3N-EPIC cohort study.
2
Francesca Romana Mancini,1,2 Kalina Rajaobelina,1,2, Courtney Dow,1,2 Tina Habbal,1,2 Aurélie
3
Affret,1,2 Beverley Balkau,1,3 Fabrice Bonnet,1,4 Marie-Christine Boutron-Ruault,1,2 Guy
4
Fagherazzi1,2
5
1: CESP, INSERM U1018, Univ. Paris-Sud, UVSQ, Université Paris-Saclay, Villejuif Cedex,
F-6
94805, France
7
2: Gustave Roussy, Villejuif, F-94805, France
8
3: University Versailles, Saint Quentin, University Paris-Sud, Villejuif, France
9
4: CHU Rennes, Université de Rennes 1, France
10
Corresponding author: Guy Fagherazzi, PhD
11
Inserm U1018, Centre for Research in Epidemiology and Population Health (CESP)
12
“Health across Generations” Team, Gustave Roussy, Espace Maurice Tubiana
13
114 rue Edouard Vaillant, 94805 Villejuif Cedex, France
14
Email: guy.FAGHERAZZI@gustaveroussy.fr
15
FR Mancini, K Rajaobelina,, C Dow, T Habbal, A Affret, B Balkau, F Bonnet, MC
Boutron-16
Ruault, and G Fagherazzi have no conflict of interest to declare.
17
M
AN
US
CR
IP
T
AC
CE
PT
ED
Abstract. 19Background: Iodine is an essential micronutrient needed for the production of thyroid hormones.
20
Consequently, iodine insufficient and excessive intakes are associated with thyroid disorders.
21
Despite the increase in diabetes prevalence worldwide and the close relationship between thyroid
22
function and the risk of diabetes, the relationship between iodine intake and diabetes has been
23
overlooked. The objective of the present study is to investigate the link between iodine intake and
24
the risk of type 2 diabetes.
25
Methods: Cox proportional hazards regression models adjusted on potential confounders were
26
used to calculate the hazard ratios and 95% confidence intervals for the associations between
27
dietary iodine intake and type 2 diabetes risk among 71 264 women of the E3N-EPIC cohort.
28
Results: The average iodine intake in the study population was 155.6 µg / day (± 47.1 µg / day).
29
After adjusting for the main risk factors for diabetes, for hypo/hyperthyroidism, as well as for
30
phosphorus intakes and consumption of dairy products and seafood, the hazard ratios (95% CI)
31
for type 2 diabetes of women in the 4th (160.7-190.5 µg / day) and 5th (190.6-596.8 µg / day)
32
quintiles groups of iodine intake were 1.27 (1.10-1.47) and 1.28 (1.07-1.53), respectively,
33
compared to women with iodine intake below the 1st quintile (29.3-116.9 µg / day).
34
Conclusion: This is the first study to investigate the relationship between dietary iodine intake
35
and the risk of developing type 2 diabetes. More studies are warranted to further investigate the
36
health effects of chronic high iodine intake, and in particular to investigate the biological
37
mechanisms that underlie the association between iodine intake and type 2 diabetes.
38
Key words: Iodine, type 2 diabetes, cohort study, E3N-Epic
39
M
AN
US
CR
IP
T
AC
CE
PT
ED
Introduction 41Iodine is an essential micronutrient needed for the production of thyroid hormones. Iodine is
42
almost completely absorbed by the small intestine and the kidney is the main route of excretion
43
(1, 2).
44
The World Health Organization (WHO)/ Food and Agriculture Organization of the United
45
Nations (FAO) recommend a daily iodine intake of 150 µg / day (equal to 2.0 µg / kg body
46
weight per 7 days) in adults (3). This value was also confirmed by the European Food Safety
47
Authority (EFSA) (4). The main sources of iodine in the diet are seafood (such as fish,
48
crustaceans, mussels, algae), eggs, dairy products, and iodine-enriched salt (4).
49
Iodine deficiency is associated with a higher frequency of goiter and hypothyroidism.
50
Conversely, high intakes of iodine can accelerate the development of thyroid disorders such as
51
hypothyroidism or hyperthyroidism, increase the incidence of autoimmune thyroiditis and
52
increase the risk of thyroid cancer (5, 6).
53
There is a close relationship between type 2 diabetes and thyroid dysfunction (7). Studies
54
have shown that thyroid dysfunction is more common in the diabetic population than in the
non-55
diabetic population and that altered thyroid function may affect glucose tolerance and worsen
56
metabolic control in people with diabetes (8, 9). Hypothyroidism is characterized by insulin
57
resistance and is associated with a reduced production of hepatic glucose (10-13). On the other
58
side, hyperthyroidism has been associated with increased insulin resistance and greatly
59
aggravates metabolic control in people with diabetes, promoting diabetic ketoacidosis (14-16).
60
Despite the increase in diabetes prevalence worldwide (17) and the close relationship
61
between thyroid function and the risk of diabetes, the association between iodine intake and
62
diabetes has been overlooked.
M
AN
US
CR
IP
T
AC
CE
PT
ED
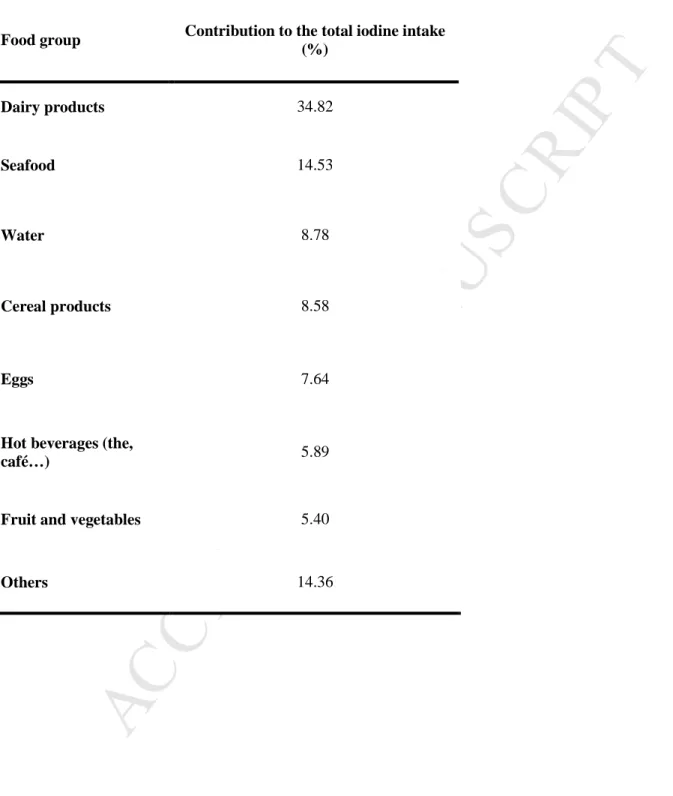
In this context, we decided to study the link between iodine intake and the risk of type 2
64
diabetes in the large E3N-EPIC cohort.
65 66
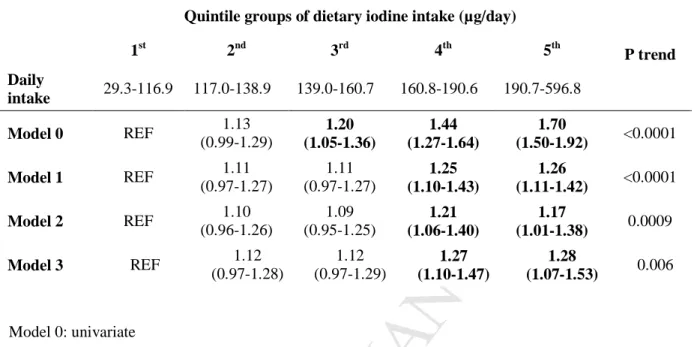
Material and methods
67
The E3N-EPIC cohort
68
E3N-EPIC is a French cohort study of 98,995 women born between 1925 and 1950 and it was
69
initiated in 1990 (18). It is the French component of the European Prospective Investigation into
70
Cancer and Nutrition (EPIC) (19), and the EPIC-InterAct sub-study (interaction of genetic and
71
lifestyle factors on the incidence of type 2 diabetes) (20). The data are available from postal
72
questionnaires that participants returned every 2-3 years, in addition to a database of drug
73
reimbursement that exists since 2004 from the medical records of the participants (Mutuelle
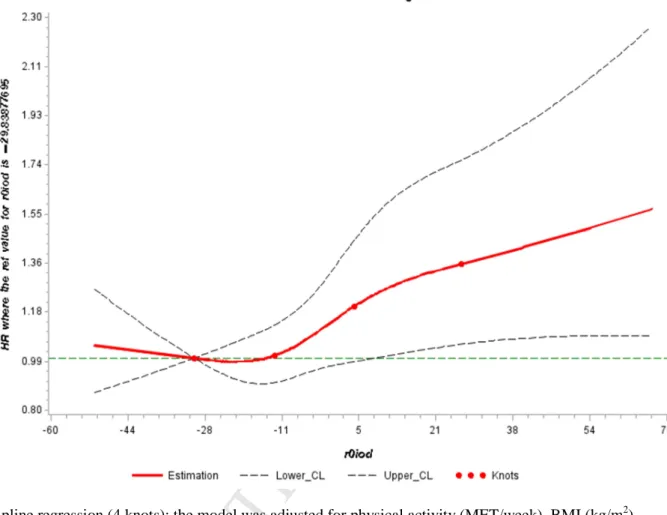
74
Générale of National Education). The average response rate for each of the eleven questionnaire
75
cycles was 83% and < 3% of the women never responded to a follow-up questionnaire. All
76
women signed letters of informed consent, according to the French National Commission for
77
Computer Data and Individual Liberty (CNIL).
78
Study population
79
Of the 74,522 women who responded to the diet-history questionnaire sent in 1993, we excluded
80
those who did not complete any questionnaire after the diet history questionnaire (n = 935), those
81
with an aberrant energy intake (1% and 99% extremes of the energy intake/energy expenditure
82
ratio, n = 1 467), and the cases of diabetes detected before the food history questionnaire (n =
83
856). Thus, our study population included 71,264 women, of whom 2,665 (3,7%) had developed
84
type 2 diabetes during follow-up (June 1993-Febuary 2012).
85
Ascertainment of type 2 diabetes
M
AN
US
CR
IP
T
AC
CE
PT
ED
Before 2004, all potential cases were identified with the follow-up questionnaires through
87
self-reporting of diabetes, diabetes diet, diabetes drugs, and hospitalization for diabetes. All
88
potential cases were then contacted and asked to answer a diabetes-specific questionnaire that
89
included questions on the circumstances of diagnosis (year of diagnosis, symptoms, biological
90
exams, fasting, or random glucose concentrations at diagnosis), diabetes therapy (prescription of
91
diet or physical activity, list of glucose lowering drugs taken), last measures of fasting glucose
92
and Hb1Ac levels.
93
Potential diabetes cases were finally validated if they declared at least one of these
94
criteria:
95
(1) fasting plasma glucose ≥7·0 mmol/l; random glucose ≥11·1 mmol/l at diagnosis;
96
(2) self-report of glucose lowering medication use;
97
(3) last values of fasting glucose or HbA1c concentrations ≥7·0 mmol/l or ≥7 %;
98
After 2004, all potential cases were identified through the drug reimbursement insurance
99
database: women reimbursed at least twice for glucose lowering medications within one year
100
period were classified as validated cases of diabetes.
101
Within the E3N cohort to date diabetes cases have been validated up to the year 2012.
102
Evaluation of iodine intake
103
Usual diet over the previous year was assessed by a validated 208-items diet-history
104
questionnaire in 1993, structured according to the French meal pattern. Questions were asked
105
about all times of the day when food or drinks were consumed, from breakfast to after-dinner
106
snacks, thus including all food or drink intakes between meals, such as appetizers before lunch or
107
dinner. The validity and reproducibility of the questionnaire have been previously described (21).
108
Foods were converted to macro- and micronutrients using a food composition table
109
derived from the official French food composition table (CIQUAL) (22), and supplemented
M
AN
US
CR
IP
T
AC
CE
PT
ED
where necessary by the McCance and Widdowson tables (23). Daily dietary iodine intakes were
111
then estimated for each woman in the study.
112
Statistical analysis
113
The contribution of different food groups to the total iodine intake was calculated.
114
Due to the strong correlation between energy and micronutrient intake, iodine intake, as
115
well as intakes of all micronutrients, was energy adjusted using the residual method (24, 25).
116
Cox multivariable regression models, with age as the time scale, were used to estimate
117
hazard ratios (HR) and 95% confidence intervals (95% CI) for T2D associated with dietary
118
iodine intake. Follow-up started at the age the dietary questionnaire was completed, and ended at
119
the age of the first of the following events: diagnosis of diabetes, death, or loss to follow-up.
120
Women were classified into quintile groups according to energy adjusted iodine intake,
121
and the lowest quintile was used as the reference category in the models.
122
We first performed a univariate analysis (model 0), followed by model 1, that was
123
adjusted for physical activity (metabolic equivalent (MET)/week), body mass index (BMI,
124
kg/m2), education level (less than 12 years, between 12 and 14 years, more than 14 years), family
125
history of diabetes (yes/no), hypertension (self-reported or use of blood pressure lowering drugs:
126
yes vs. no), hypercholesterolemia (self-reported blood cholesterol >6.2 mmol/l or use of
127
cholesterol lowering drugs: yes vs. no), hyper or hypothyroidism (yes/no), and smoking status
128
(non-smoker, former smoker, smoker). The model was corrected for adherence scores to the
129
healthy dietary pattern and the western dietary pattern, both derived with principal components
130
analysis (PCA), as previously described (26).
131
We performed a second set of analyses by adding the following variables one at a time to
132
models 1 in order to identify whether they had an impact on the relationship between dietary
133
iodine intake and the risk of type 2 diabetes: retinol, omega 3 fatty acids, phosphorus, zinc,
M
AN
US
CR
IP
T
AC
CE
PT
ED
calcium, sodium, copper, and iron. Variables were retained if they modified the HR for the 5th
135
quintile group for more than ±0.05 . Taking into account the results of this second set of analyses,
136
only phosphorus was retained leading to models 2.
137
To assess the association between iodine intake and the risk of diabetes independently of
138
the main sources of iodine in our population, model 2 was adjusted for the consumption of the
139
main iodine providers, i.e. dairy products and seafood, leading to the final model (Model 3).
140
Tests for linear trends were performed for all models by assigning the median value to
141
each iodine intake quintile and modeling this value as a continuous variable. To better
142
characterize the shape of the association between iodine intake and T2D risk highlighted by the
143
final model a spline regression was performed.
144
We tested the interaction between dietary iodine intake, and BMI (<25 kg/m2 vs. ≥ 25
145
kg/m2) and the presence of hyper/hypothyroidism (yes/no), and when the interaction test was
146
statistically significant we performed a test of homogeneity between the groups.
147
Missing values were <5% for all variables and were imputed with the median of the study
148
population (quantitative variables) or the mode (qualitative variables).
149
Sensitivity analysis
150
To test a reverse causality hypothesis, we also assessed the association between dietary
151
iodine intake and the risk of type 2 diabetes, excluding diabetes cases that occurred during the
152
first 5 years of follow-up.
153
Finally, as the residual method and the nutrient density method (nutrient intake divided by
154
total energy intake) are based on different assumptions concerning the relationship between
155
nutrient intake and total energy intake, and thus potentially provide different results, all analyses
156
were repeated using the nutrient density method.
M
AN
US
CR
IP
T
AC
CE
PT
ED
All statistical tests were considered statistically significant if P <0.05. Data were analyzed
158
using SAS software, version 9.4.
159 160
Results
161
The average iodine intake in our population was 155.6 µg/day (±47.1). In Table 1 the study
162
population is described according to quintiles of iodine intake. Women with high iodine intakes
163
were younger and had higher BMI than those with low iodine intakes. Increasing iodine intake
164
was associated with increasing percentages of incident type 2 diabetes cases and of
165
hyper/hypothyroidism cases.
166
The main contributors to iodine intake in our population were dairy products and seafood,
167
with 34.8% and 14.5% of the total iodine intake, respectively (Table 2). Water (8.8%), cereal
168
products (8.6%) and eggs (7.6%) were the next most important sources of iodine.
169
On average every women was followed for 13.4 (±2.9) years, for a total of 958 359
170
person-years. High iodine intakes were associated with a higher risk of developing type 2
171
diabetes, even after adjusting for the main confounding factors (Table 3). Model 1, which was
172
adjusted for the main risk factors for diabetes and hyper / hypothyroidism, showed an increased
173
risk of type 2 diabetes for iodine intakes in the 4th and 5th quintile groups compared to the 1st
174
quintile group. Indeed the HRs (95% CI) for quintiles 4 and 5 were 1.25 (1.10-1.43) and 1.26
175
(1.11-1.43), respectively.
176
Phosphorus was the only variable, among those tested, which had an impact on the
177
relationship between iodine intake and the risk of type 2 diabetes modifying the HR for the 5th
178
quintile group for more than ±0.05 (Supplemental Table 1). In model 2, i.e. model 1
179
additionally adjusted for phosphorus intakes, the HRs (95% CI) for the 4th and 5th quintile groups
180
were 1.21 (1.06-1.40), and 1.17 (1.01-1.38), respectively (Table 3).
M
AN
US
CR
IP
T
AC
CE
PT
ED
Finally, model 3, which corresponds to model 2 further adjusted for dairy products and
182
seafood consumption, highlighted an increased risk of type 2 diabetes from the 4th quintile of
183
iodine intake compared to the 1st quintile group. The HRs (95% CI) for 4th and 5th quintile groups
184
were respectively 1.27 (1.10-1.47) and 1.28 (1.07-1.53) (Table 3).
185
There was a linear component of trend across quintiles of iodine intake (ptrend 0.006) 186
starting from the 3rd quartile group, which appears clearly from the graph obtained from spline
187
regression model (Figure 1).
188
There was no effect modification of the association between iodine intake and risk of type
189
2 diabetes by BMI or the presence of hyper / hypothyroidism (pinteraction = 0.25 and p=0.32, 190
respectively).
191
Sensitivity analysis
192
To test the hypothesis of reverse causality between iodine intake and the risk of type 2
193
diabetes, we excluded the 392 cases of diabetes detected during the first 5 years of follow-up.
194
We also re-analyzed model 4 using the nutrient density method on all micronutrients. The
195
results obtained with these two models were not different from the results of the initial model 4
196
(data not shown).
197 198
Discussion
199
In our population, high iodine intake is associated with an increased risk of type 2 diabetes. To
200
our knowledge, this is the first study that investigates the relationship between dietary iodine
201
intake and the risk of developing type 2 diabetes. The relationship appears linear and is
202
associated with a significant increase in risk from the 4th quintile of iodine intake (i.e. above
203
160.7 µg/day). The association was stable across the various tested models, i.e. adjustment for the
204
main potential confounders and sensitivity analyses.
M
AN
US
CR
IP
T
AC
CE
PT
ED
Biological mechanisms 206Iodine intake has mainly been studied in relation to its capacity of interfering with the thyroid
207
function; nevertheless, the observed association with type 2 diabetes can be supported by two
208
main potential biological mechanisms.
209
First, we can hypothesize a direct effect of iodine on glucose metabolism and insulin
210
resistance, although biological studies to support this theory are currently missing. Up to date,
211
most studies have focused on the effects of chronic iodine deficiency on the human organism, but
212
very few focused on high dietary intake of iodine, which seems to be the case in our population.
213
The second possible explanation is that the association between iodine intake and type 2
214
diabetes is actually mediated by the presence of undiagnosed thyroid dysfunction. A previous
215
study estimated that the mean prevalence of undiagnosed hypo- or hyperthyroidism in Europe is
216
4.94% (4.75%–5.13%) and 1.72% (1.66%–1.88%), respectively, with a clear female
217
predominance (8.12% vs 5.19%), especially regarding hyperthyroidism (27). According to that
218
study, 50% of cases of hypo- and hyperthyroidism remain undiagnosed. Comparably, the
219
American Association of Clinical Endocrinologists (AACE) estimated that in the United States
220
approximately 13 million people, or 4.78% of the population, have undiagnosed thyroid
221
dysfunction (28).It is known that excess iodine can lead to thyroid dysfunction and in particular
222
to hyperthyroidism, and that hyperthyroidism is associated with insulin resistance and impaired
223
glucose metabolism (14, 15). This may explain the association found in the present study, i.e. an
224
increased risk of developing type 2 diabetes when the mean iodine consumption exceeds 160 µg
225
per day.
226
Strengths and limitations
227
Our study presents some limitations. Iodine dietary intakes were estimated through the use of
228
self-administrated questionnaire, thus it is possible that the total amount of iodine could be
M
AN
US
CR
IP
T
AC
CE
PT
ED
underestimated. Moreover, the dietary estimates are based on a single questionnaire, thus dietary
230
habits changes could not be taken into account leading to possibility for misclassification of
231
exposure. However, as the study is prospective, any effects are likely to be non-differential and
232
would lead to an attenuation of the true association. The fact that our study population includes
233
only women can be considered as a minor limitation due to the fact that few studies have reported
234
differences in T2D risk factors between sexes, although biological mechanisms may differ
235
between men and women.
236
Finally, the iodine intake in the present work does not take into account iodine-enriched
237
salt. However, this should not have a big impact on the total intake as the added salt (cooking salt
238
and voluntary addition salt), in western countries, accounts for less than 20% of the total salt
239
intake (29, 30) of which, in France, less than 50% is enriched with iodine (31). Nevertheless, this
240
lack of information on iodine-enriched salt suggests that the iodine intake of the study population
241
is probably underestimated. The true association between dietary iodine intake and type 2
242
diabetes may therefore be stronger than reported in the present study.
243
Our study has also several strengths. The response rate remains very high even after 20
244
years of follow-up, and the questionnaires are carefully completed by the participants (as shown
245
by satisfactory results in validation studies and questionnaire response rates), thus ensuring high
246
reliability. All participants are members of the MGEN, which provides access to comprehensive
247
medical and administrative data. The large size of the study population and the prospective
248
design of the E3N-EPIC cohort allowed us to perform sensitivity analyses while retaining
249
sufficient statistical power to detect associations and make a reverse causation bias unlikely. We
250
analyzed only validated cases of type 2 diabetes, based on a well-defined validation algorithm,
251
which reduces the risk of false negatives or false positives. Finally, detailed information on
252
potential confounders was collected, thus minimizing the risk of residual confounding.
M
AN
US
CR
IP
T
AC
CE
PT
ED
Conclusion 254Most studies in the literature focus on the health effects of iodine deficiency. Nevertheless, the
255
increased accessibility to seafood due to the improvement in conservation and distance
256
transportation, suggests that iodine deficiency in a developed country such as France is less
257
frequent than in previous periods.In our population, the mean iodine intake is above the
258
recommended nutritional intake despite the fact that the estimated intake is probably
259
underestimated.Our work highlights for the first time a higher risk of type 2 diabetes with high
260
iodine intake. The study should be replicated in other populations with high iodine intake and
261
potentially on other cardiometabolic health outcomes, in order to have a better overview of the
262
health impact of this increasingly consumed nutrient.
263 264 265
Acknowledgments: The authors are grateful to all participants for providing the data used in the
266
E3N-EPIC Study. The Inserm E3N-EPIC cohort, was established and maintained with the
267
support of the MGEN (Mutuelle Générale de l’Education Nationale), the Gustave Roussy
268
Institute, and the French League against Cancer. The validation of potential diabetes cases was
269
supported by the European Union (Integrated Project LSHM-CT-2006-037197 in the 6th
270
European Community Framework Programme) InterAct project. The study is also supported by 271
the French Research Agency (ANR grant, ANR-10-COHO-0006). 272
273
Authors' Statement of Contributions: FRM conceived and designed the study. FRM, TH and GF
274
performed the statistical analysis. FRM drafted the original manuscript. All authors contributed to
275
the interpretation of data discussed in the manuscript, revised the manuscript and approved its
276
final version.
277
M
AN
US
CR
IP
T
AC
CE
PT
ED
Bibliography1. Vought RL and London WT. Iodine intake, excretion and thyroidal accumulation in healthy subjects. J Clin Endocrinol Metab 1967;27:913-919.
2. Nath SK, Moinier B, Thuillier F, Rongier M and Desjeux JF. Urinary excretion of iodide and fluoride from supplemented food grade salt. International Journal for Vitamin and Nutrition Research.1992;62:66-72.
3. World Health Organization. Iodine and health: eliminating iodine deficiency disorders safely through salt iodization. 1994. Available from:
http://apps.who.int/iris/bitstream/10665/58693/1/WHO_NUT_94.4.pdf?ua=1
4. EFSA NDA Panel (EFSA Panel on Panel on Dietetic Products Nutrition and Allergies), 2014. Scientific Opinion on Dietary Reference Values for iodine. EFSA Journal
2014;12(5):3660.
5. Laurberg P, Pedersen KM, Hreidarsson A, Sigfusson N, Iversen E and Knudsen PR. Iodine intake and the pattern of thyroid disorders: a comparative epidemiological study of thyroid abnormalities in the elderly in Iceland and in Jutland, Denmark. J Clin
EndocrinolMetab 1998;83:765-769.
6. Teng W, Shan Z, Teng X, Guan H, Li Y, Teng D, Jin Y, Yu X, Fan C, Chong W, Yang F, Dai H, Yu Y, Li J, Chen Y, Zhao D, Shi X, Hu F, Mao J, Gu X, Yang R, Tong Y, Wang W, Gao T and Li C. Effect of iodine intake on thyroid diseases in China. N Engl J Med. 2006;354:2783-2793.
7. Wang C. The relationship between type 2 diabetes mellitus and related thyroid diseases. J Diabetes Res. 2013;2013:390534.
8. Al-Geffari M, Ahmad NA, Al-Sharqawi AH, Youssef AM, Alnaqeb D, Al-Rubeaan K. Risk factors for thyroid dysfunction among type 2 diabetic patients in a highly diabetes mellitus prevalent society. Int J Endocrinol. 2013;2013:417920.
9. Hage M, Zantout MS, Azar ST. Thyroid disorders and diabetes mellitus. J Thyroid Res 2011;2011:439463.
10.Maratou E, Hadjidakis DJ, Kollias A, Tsegka K, Peppa M, Alevizaki M, Mitrou P, Lambadiari V, Boutati E, Nikzas D, Tountas N, Economopoulos T, Raptis SA, Dimitriadis G. Studies of insulin resistance in patients with clinical and subclinical hypothyroidism. Eur. J. Endocrinol. 2009;160:785–790.
11.Brenta G, Celi FS, Pisarev M, Schnitman M, Sinay I, Arias P. Acute thyroid hormone withdrawal in athyreotic patients results in a state of insulin resistance. Thyroid. 2009;19:665–669.
12.Debiec H, Cross HS, Peterlik M, D-glucose uptake is increased in jejunal brush-border membrane vesicles from hyperthyroid chicks. Acta. Endocrinol. 1989;120:435–441. 13.Cavallo-Perin P, Bruno A, Boine L, Cassader M, Lenti G, Pagano G. Insulin resistance in
Graves’ disease: a quantitative in vivo evaluation. Eur. J. Clin. Invest. 1988;18:607–613. 14.MaratouE, Hadjidakis DJ, Peppa M, Alevizaki M, Tsegka K, Lambadiari , Mitrou P,
M
AN
US
CR
IP
T
AC
CE
PT
ED
resistance in patients with clinical and subclinical hyperthyroidism. Eur. J. Endocrinol. 2010;163:625–630.
15.Bhattacharyya A and Wiles PG, Diabetic ketoacidosis precipitated by thyrotoxicosis. Postgrad. Med. J. 1999;75:291–292.
16.Guastamacchia E, Triggiani V, Aglialoro A, Aiello A, Ianni L, Maccario M, Zini M, Giorda C, Guglielmi R, Betterle C, Attanasio R, Borretta G, Garofalo P, Papini E, Castello R, Ceriello A. Italian Association of Clinical Endocrinologists (AME) & Italian Association of Clinical Diabetologists (AMD) Position Statement : Diabetes mellitus and thyroid disorders: recommendations for clinical practice.
Endocrine. 2015;49:339-352.
17.World Health Organization. Global report on diabetes. 2016. Available from: http://apps.who.int/iris/bitstream/10665/204871/1/9789241565257_eng.pdf
18.Clavel-Chapelon F; E3N Study Group. Cohort Profile: The French E3N Cohort Study. Int J Epidemiol. 2015;44:801-809.
19.Riboli E, Hunt KJ, Slimani N, Ferrari P, Norat T, Fahey M, et al. European Prospective Investigation into Cancer and Nutrition (EPIC): study populations and data collection. Public Health Nutr. 2002;5:1113–1124.
20.Langenberg C, Sharp SJ, Franks PW, Scott RA, Deloukas P, Forouhi NG, et al. Gene-lifestyle interaction and type 2 diabetes: the EPIC interact case-cohort study. PLoS Med. 2014;11:e1001647.
21.Van Liere MJ, Lucas F, Clavel F, Slimani N, Villeminot S. Relative validity and
reproducibility of a French dietary history questionnaire. Int J Epidemiol. 1997;26 Suppl 1:S128-136.
22. Favier J-C, Ireland-Ripert J, Toque C, Feinberg M. Répertoire général des aliments : table de composition. Paris: Technique & Documentation; 1995. Available from:
http://horizon.documentation.ird.fr/exl-doc/pleins_textes/divers11-10/39105.pdf 23.Paul AA, Southgate D a. T. McCance and Widdowson’s The Composition of Foods.
SpringerLink. 1987;129–131.
24.Willett WC, Howe GR, Kushi LH. Adjustment for total energy intake in epidemiologic studies. Am J Clin Nutr. 1997;65:1220S–1228S.
25.Brown CC, Kipnis V, Freedman LS, Hartman AM, Schatzkin A, Wacholder S. Energy adjustment methods for nutritional epidemiology: the effect of categorization. Am J Epidemiol. 1994 1;139:323–38.
26. Bédard A, Garcia-Aymerich J, Sanchez M, Le Moual N, Clavel-Chapelon F, Boutron-Ruault MC, Maccario J, Varraso R. Confirmatory Factor Analysis Compared with
Principal Component Analysis to Derive Dietary Patterns: A Longitudinal Study in Adult Women. J Nutr. 2015 Jul;145(7):1559-68.
27.Garmendia Madariaga A, Santos Palacios S, Guillén-Grima F, Galofré JC. The incidence and prevalence of thyroid dysfunction in Europe: a meta-analysis. J Clin Endocrinol Metab. 2014;99:923-931.
M
AN
US
CR
IP
T
AC
CE
PT
ED
28.Garber JR, Cobin RH, Gharib H, Hennessey JV, Klein I, Mechanick JI, Pessah-Pollack R, Singer PA, Woeber KA; American Association of Clinical Endocrinologists and
American Thyroid Association Taskforce on Hypothyroidism in Adults. Clinical practice guidelines for hypothyroidism in adults: cosponsored by the American Association of Clinical Endocrinologists and the American Thyroid Association. Endocr Pract. 2012;18:988–1028.
29.Mattes RD1, Donnelly D. Relative contributions of dietary sodium sources. J Am Coll Nutr. 1991;10:383-393.
30.James W.P.T., Ralph A., Sanchez-Castillo C.P. - The dominance of salt in manufactured food in the sodium intake of affluent societies. Lancet. 1987;1:426-429.
31.Comité des Salines de France. - Rapport du Délégué Général, 2003.
M
AN
US
CR
IP
T
AC
CE
PT
ED
Table 1. Characteristics (% or mean (SD)) of the study population according to quintile groups of dietary iodine intake (n=71 264). The E3N-EPIC cohort
Quintile groups of dietary iodine intake
Variables 1 (n=14253) 2 (n=14252) 3 (n=14254) 4 (n=14252) 5 (n=14253)
Iodine intake (µg/day) 98.93 (14.21) 128.25 (6.33) 149.57 (6.25) 174.34 (8.51) 227.17 (35.59)
Non dietary variables
Age (years) 53.58 (6.84) 53.02 (6.72) 52.77 (6.69) 52.56 (6.53) 52.5 (6.5)
BMI (kg/m2) 22.36 (2.95) 22.66 (2.97) 22.87 (3.07) 23.02 (3.20) 23.52 (3.53)
Family history of diabetes (%) 10.15 11.30 10.66 11.58 11.91
Hypercholesterolemia(%) 38.03 38.08 39.17 38.56 35.49
Hypertension (%) 13.27 12.59 13.37 13.44 14.07
Physical activity (METs h/week) 46.58 (52.59) 47.66 (51.95) 47.87 (43.02) 50.62 (49.27) 54.16 (54.63)
Smoking Current (%) 15.05 13.28 13.25 12 13.47 Former (%) 30.93 32.56 33.11 33.10 33.28 Education < 12 years of (%) 14.10 12.88 13.36 13.59 15.26 12 - 14 years (%) 49.76 51.25 52.09 51.83 50.19 > 14 years (%) 36.14 35.88 34.55 34.58 34.55 Hyper/ hypothyroidism (%) 14.61 15.16 15.86 16.50 17.44
Type 2 diabetes incident cases (%) 2.88 3.12 3.69 4.18 4.82
Dietary variables Energy intake without
carbohydrates and alcohol (kcal/day)
901.06 (200.66) 1066.61 (212.15) 1177.26 (234.27) 1292.17 (259.6) 1516.11 (332.18)
Alcohol intake (g ethanol/ day) 10.83 (13.61) 11.03 (13.15) 11.49 (13.48) 11.89 (14) 12.73 (14.99)
Carbohydrates intake (g/day) 190.88 (54.41) 216.86 (58.35) 233.52 (62.54) 252.02 (68.33) 281.71 (77.7)
M
AN
US
CR
IP
T
AC
CE
PT
ED
Omega 3 intake (g/day) 1.10 (0.33) 1.33 (0.36) 1.49 (0.40) 1.66 (0.45) 2.03 (0.61)
Phosphorus intake (mg/day) 1064.06 (198) 1286.03 (189.01) 1443.86 (203.95) 1616.57 (226.76) 1976 (346.11)
Zinc intake (mg/day) 8.83 (2.33) 10.3 (2.36) 11.35 (2.5) 12.43 (2.69) 14.62 (3.25)
Calcium intake (mg/day) 695.07 (167.72) 888.09 (167.15) 1029.08 (189.04) 1188.17 (219.02) 1529.38 (365.85)
Sodium intake (mg/day) 2182.04 (651.85) 2564.47 (698.01) 2808.22 (740.85) 3080.28 (810.50) 3560.35 (962.18)
Copper intake (mg/day) 2.38 (0.96) 2.66 (1.04) 2.87 (1.16) 3.06 (1.25) 3.52 (1.51)
Iodine intake/total energy intake 0.06 (0.01) 0.07 (0.01) 0.07 (0.02) 0.08 (0.02) 0.09 (0.02)
M
AN
US
CR
IP
T
AC
CE
PT
ED
Table 2. Percentage contribution of the main food groups to the total
dietary iodine intake. The E3N-EPIC cohort
Food group Contribution to the total iodine intake
(%) Dairy products 34.82 Seafood 14.53 Water 8.78 Cereal products 8.58 Eggs 7.64
Hot beverages (the,
café…) 5.89
Fruit and vegetables 5.40
M
AN
US
CR
IP
T
AC
CE
PT
ED
Table 3. Hazard ratios (95% CI) estimated by Cox multivariable regression models for the risk of incident
type 2 diabetes according to quintile groups of dietary iodine intake (µg/day) estimated by the residual method (n=71 264). The E3N-EPIC cohort
Quintile groups of dietary iodine intake (µg/day)
P trend 1st 2nd 3rd 4th 5th Daily intake 29.3-116.9 117.0-138.9 139.0-160.7 160.8-190.6 190.7-596.8 Model 0 REF 1.13 (0.99-1.29) 1.20 (1.05-1.36) 1.44 (1.27-1.64) 1.70 (1.50-1.92) <0.0001 Model 1 REF 1.11 (0.97-1.27) 1.11 (0.97-1.27) 1.25 (1.10-1.43) 1.26 (1.11-1.42) <0.0001 Model 2 REF 1.10 (0.96-1.26) 1.09 (0.95-1.25) 1.21 (1.06-1.40) 1.17 (1.01-1.38) 0.0009 Model 3 REF 1.12 (0.97-1.28) 1.12 (0.97-1.29) 1.27 (1.10-1.47) 1.28 (1.07-1.53) 0.006 Model 0: univariate
Model 1: adjusted for physical activity (MET/week), BMI (kg/m2), education level (less than 12 years, between 12 and 14 years, more than 14 years), hypertension (yes/no), family history of diabetes (yes/no), hypercholesterolemia (yes/no), hyper / hypothyroidism (yes/no), smoking status (non-smoker, former smoker, smoker) adherence to the Western diet (as continuous variable) and adherence to the
Mediterranean diet (as continuous variable). Model 2: Model 1 + phosphorus intake (µg/day)
M
AN
US
CR
IP
T
AC
CE
PT
ED
Figure 1.Spline regression model between the dietary iodine intake (µg/day) estimated by the residual
method and the risk of type 2 diabetes (n=71 264). The E3N-EPIC cohort.
Spline regression (4 knots): the model was adjusted for physical activity (MET/week), BMI (kg/m2), education level (less than 12 years, between 12 and 14 years, more than 14 years), hypertension (yes/no), family history of diabetes (yes/no), hypercholesterolemia (yes/no), hyper / hypothyroidism (yes/no), smoking status (non-smoker, former smoker, smoker) adherence to the Western diet (as continuous variable) and adherence to the Mediterranean diet (as continuous variable), phosphorus intake (µg/day), dairy products consumption and seafood consumption (gr/day)
M
AN
US
CR
IP
T
AC
CE
PT
ED
Online supporting material.
Supplemental Table 1: Results of the stepwise approach: hazard ratios (95%CI) for the risk of incident
type 2 diabetes according to quintiles of dietary iodine intake (µg/day) adding one by one the dietary variables to model 1 and model 2. The E3N-EPIC cohort
Quintile groups of dietary iodine intake (µg/day)
1st 2nd 3rd 4th 5th P trend Daily intake 29.3-116.9 117.0-138.9 139.0-160.7 160.8-190.6 190.7-596.8 Model 1 + vitamin A REF 1.10 (0.96-1.26) 1.10 (0.96-1.26) 1.24 (1.09-1.41) 1.22 (1.07-1.40) 0.002 Model 1 + omega 3 REF 1.10 (0.96-1.26) 1.11 (0.97-1.26) 1.24 (1.11-1.42) 1.23 (1.11-1.41) 0.002 Model 1 + phosphorus REF 1.10 (0.96-1.26) 1.11 (9.95-1.25) 1.21 (1.06-1.40) 1.18 (1.00-1.38) 0.050 Model 1 + zinc REF 1.10 (0.96-1.26) 1.10 (0.96-1.26) 1.23 (1.08-1.40) 1.20 (1.05-1.40) 0.005 Model 1 + calcium REF 1.12 (0.97- 1.28) 1.12 (0.98-1.29) 1.27 (1.11-1.47) 1.28 (1.09-1.51) 0.003 Model 1 + sodium REF 1.10 (0.97-1.27) 1.11 (0.97-1.27) 1.25 (1.10-1.42) 1.23 (1.08-1.41) 0. 001 Model 1 + copper REF 1.11 (0.97-1.27) 1.11 (0.97-1.27) 1.25 (1.10-1.43) 1.24 (1.09-1.42) 0.001 Model 1 + iron REF 1.11 (0.97-1.27) 1.11 (0.97-1.27) 1.25 (1.10-1.43) 1.24 (1.08-1.42) 0.001