HAL Id: hal-01323171
https://hal.archives-ouvertes.fr/hal-01323171
Submitted on 30 May 2016HAL is a multi-disciplinary open access archive for the deposit and dissemination of sci-entific research documents, whether they are pub-lished or not. The documents may come from teaching and research institutions in France or abroad, or from public or private research centers.
L’archive ouverte pluridisciplinaire HAL, est destinée au dépôt et à la diffusion de documents scientifiques de niveau recherche, publiés ou non, émanant des établissements d’enseignement et de recherche français ou étrangers, des laboratoires publics ou privés.
AnyWave: A cross-platform and modular software for
visualizing and processing electrophysiological signals
B Colombet, M Woodman, C G Bénar, J M Badier
To cite this version:
B Colombet, M Woodman, C G Bénar, J M Badier. AnyWave: A cross-platform and modular software for visualizing and processing electrophysiological signals. Journal of Neuroscience Methods, Elsevier, 2015, 242, pp.118-126. �10.1016/j.jneumeth.2015.01.017�. �hal-01323171�
1
AnyWave: a cross-platform and modular software for visualizing and
processing electrophysiological signals
B Colombet1,2, M Woodman1,2, CG Bénar1,2, JM Badier1,2 1
INSERM, UMR1106, Marseille, France 2
Aix-Marseille Université, Institut de Neurosciences des Systèmes, Marseille, France
Abstract
BACKGROUND
The importance of digital signal processing in clinical neurophysiology is growing steadily, involving clinical researchers and methodologists. There is a need for crossing the gap between these communities by providing efficient delivery of newly designed algorithms to end users.
We have developed such a tool which both visualizes and processes data and, additionally, acts as a software development platform.
NEW METHOD
AnyWave was designed to run on all common operating systems. It provides access to a variety of data formats and it employs high fidelity visualization techniques. It also allows using external tools as plug-ins, which can be developed in languages including C++, MATLAB and Python.
RESULTS
In the current version, plug-ins allow computation of connectivity graphs (non-linear correlation h2) and time-frequency representation (Morlet wavelets). The software is freely available under the LGPL3 license.
COMPARISON WITH EXISTING METHODS
AnyWave is designed as an open, highly extensible solution, with an architecture that permits rapid delivery of new techniques to end users.
2
CONCLUSIONS
We have developed AnyWave software as an efficient neurophysiological data visualizer able to integrate state of the art techniques. AnyWave offers an interface well suited to the needs of clinical research and an architecture designed for integrating new tools.
We expect this software to strengthen the collaboration between clinical neurophysiologists and researchers in biomedical engineering and signal processing.
KEYWORDS
multi-platform software, signal processing, electrophysiology, MATLAB, Python, EEG, MEG.
1. Introduction: the need for a platform linking clinicians and
methodologists
Signal processing techniques play an increasingly important role in clinical neurophysiology. Two communities are involved in the use of these techniques. On the one hand, researchers in clinical neurophysiology have adopted new techniques for working with EEG since the development of personal computer and signal digitization, allowing filtering, re-montaging without change of the original signal, mapping and source localization (Rosenblatt and Gotman, 1999; Wendling and Badier, 1998). On the other hand, researchers in signal processing have been very active to solve the
challenging mathematical problems posed by extracting information from brain signals (Baillet et al., 2001). However, there are currently several practical barriers prevent efficient exchange between the two communities. First, clinical research software is typically closed source and cannot be extended by third parties. Second, researchers deal with different data formats and often redefine basic preprocessing and visualization functions. Finally, new signal processing tools are difficult to distribute to clinical users as they often are not easy to use. Several available software packages have been developed by methodologists as MATLAB (Mathworks, Natick, MA) toolboxes (Delorme and Makeig, 2004; Litvak et al., 2011; Oostenveld et al., 2011) or stand-alone software (Aguera et al., 2011; Brunet et al., 2011). They are usually open source, and the code can be adapted to the users' needs. However, none of them offers an efficient, easy to use interface that is appropriate for clinical work, where visualization of signals and marking events is important. Therefore, there is a strong need for a common platform which would allow rapid interaction between clinical researchers in the two communities. Our goal was to develop a tool at the interface between methodologists and researchers in clinical neurophysiology. Our first objective was to design a cross-platform software which provides basic visualizations, marking tools and data export functionality. Our second objective
3 was to enable rapid incorporation of signal processing modules in order to facilitate the use of newly developed algorithms by methodologists. We present here the architecture of the AnyWave
software, with an emphasis on the signal processing plug-ins, which can be developed in C++, MATLAB or Python. Our software is available for free under the LGPL3 license, along with full documentation and examples at http://meg.univ-amu.fr/wiki/AnyWave . The source code can be obtained at https://github.com/anywave/anywave
2. Architecture and general principles
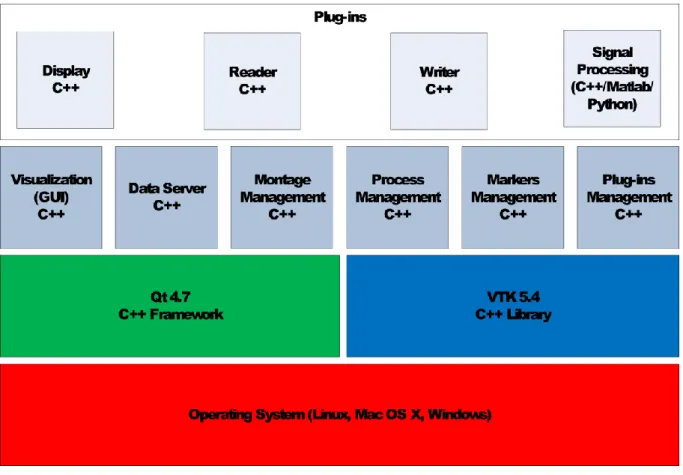
In order to combine performance and portability we have chosen the Qt framework which is
available under LGPL licensing and uses C++ as a programming language. The VTK library, also in C++ and under the LGPL license, was also used for 3D and 2D data representation, such as mappings of sensors activities for EEG or MEG recordings. A software development kit is also provided for developing plugins from MATLAB and Python scripts and incorporating them into AnyWave. This process will be described in section 4.
The VTK library was chosen because it provides algorithms (Delaunay2D, Delaunay3D, etc.) which are ready to use as well as features implementing 3D renderings. The library is only used to render 2D or 3D mapping of activities. There is no requirement to use the VTK library for developers who would like to implement their own plug-ins.
In order to save time between different reviewing sessions, filtering options, montage and
visualization settings are automatically saved along with the data file. Hence, when the user opens the data file again; all previous settings are automatically applied.
2.1 Software components
AnyWave is composed of a set of components; some of them are running in different threads of execution (see Figure 1). This allows for a responsive graphic user interface during heavy calculation or when loading a large amount of data. For example, the Data Server component can be launched several times, each time creating a new thread. In AnyWave, data is processed using a client-server mechanism. The Data Server component is the server. Others components or modules can become clients: to do so a connection must be established with the server. Opening a connection creates a new Data Server component in a new thread, providing the client with a dedicated resource from which to request data. The data flow is presented in Figure 2. The data server thread is in charge of loading the requested part of data into memory, applying montage (through the Montage Manager Component), filtering data if necessary and then sending data.
The main part of AnyWave is the Visualization component which is the graphic user interface. This component is a client of Data Server component; therefore the main interface will request data to a
4 server running in the background. When data is loaded from a file, each channel is handled based on its name. Then, the Montage Manager can apply user defined montages, e.g., bipolar montages or re-referenced data, and change the order of channels. User-defined montages can be saved to a file in order to apply that montage to another file subsequently. A data file may also contain events. Events are called markers in AnyWave and are managed by the Markers Manager component, using a dedicated user interface.
The Process Manager component handles optional signal processing algorithm modules (see next section). It is able to launch, pause or cancel signal processing modules as well as handle their input and output data.
Loading and managing optional plug-ins is the role of the Plug-ins Manager component. Signal processing plug-ins also become clients of Data Server component and then request data without being interrupted by other modules that may request data at the same time.
2.2 Plug-ins
One goal in the design of AnyWave was modularity. To achieve that, AnyWave was built with the concept of plug-in that will add features to the software. A plug-in is a C++ module built using the provided software development kit (SDK). There are several types of plug-ins that could be built using the SDK: “reader”, “writer”, “display” or “signal processing algorithms”. Signal processing algorithms can be written in MATLAB or Python, and MATLAB plugins can be compiled to avoid requiring target computers to have MATLAB installed. We are not providing a complete and monolithic solution but rather a modular way of handling input/output and signal processing. With this design, it is possible to support new file formats without requiring a new version of AnyWave, thanks to a new reader or writer plug-in. It is also possible to adapt and include an existing signal processing algorithm by implementing it in a signal processing plug-in. This is particularly easy if the original algorithm is written in MATLAB or Python language.
2.2.1 Reader and writer plug-ins
A reader plug-in is a module that opens a data file and sends data (signals and markers) to AnyWave. Currently, there are several plug-ins provided that can read several EEG or MEG file formats from different manufacturers: MicroMed (.trc), Neuroscan (.cnt), Brain Products (.vhdr), CTF (.meg4), 4D NeuroImaging, as well as EDF/BDF format (.bdf, .eeg). Adding new formats only requires writing a new reader plug-in (in C++/Qt). Writer modules are used to export data for further use in other software, and currently exported formats include Brain Vision Analyser (Brain Products GmbH) (.vhdr) and AnyWave binary format (.ades). Note that the ADES format is not the official file format associated with AnyWave. It is simply a convenient binary format with a text header, allowing exchanging data between software and platforms. The documentation is available at
5 http://meg.univ-amu.fr/wiki/AnyWave:ADESAs in the case of reader plug-ins, the list of supported file formats available to export can be extended by adding new writer modules that are independent of the main program.
2.2.2 Signal processing and Display plug-ins
Signal processing plug-ins get data from AnyWave and can return computed data directly to AnyWave (see section 4). Each plug-in corresponds to a process.
There are two main kinds of signal processing plug-ins:
(i) Those which will run in the background, independently of the visualization components. (ii) Those which will be coordinated with the visualization component.
These processes request data, run an algorithm on the data they receive, and then terminate. They can optionally return some data to the visualization component.
The difference between the two types of signal processing plug-ins (or processes) is that Background launched processes will run once when requested by the user and then terminate. Display processes are linked to what the visualization component is currently displaying. Whenever the displayed content changes, those processes are executed. For example, the time-frequency signal processing plug-in computes the time-frequency representation for one or more channels displayed by the visualization component and sends back their respective time/frequency representations. As it is designed as a signal processing linked to the display, each time the content of the channels is updated (while the user is browsing the data file) the process is run and the time/frequency
representations are updated. A Signal processing plug-in (or process) may require data from the Data Server component. This is the case for processes that are designed to run in the background.
Processes designed to be linked to the current display, will not need to request for data as the data is automatically provided by the visualization component. A process can access any piece of data if needed (based on time or markers for example). The data received by the client have been processed through the montage manager and some filtering may occur also, depending on the settings the user set. However, the process can request the Data Server component to provide unfiltered data or ask for a specific filtering to be applied on a particular channel type. Some algorithms can produce data which are not vectors of values, which is the default data type that the visualization component can display. This is the case for example, for time-frequency analyses. This is where Display plug-ins are used to extend the capabilities of the visualization component and allow displaying other data types, like 2D matrices.
6
3. Visualization
3.1 Signal visualization
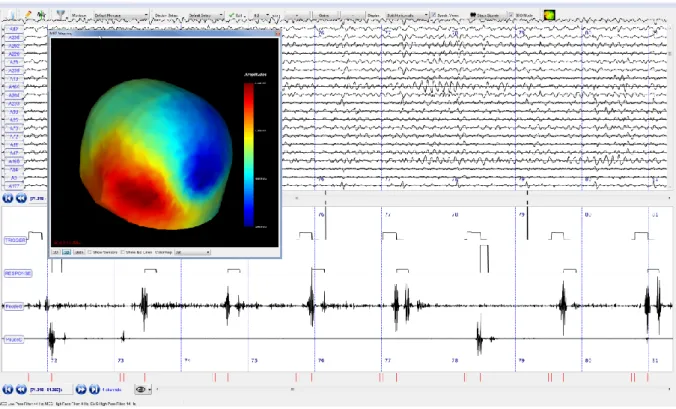
AnyWave displays signals in views. By default one main view is used to display the most common channel types (EEG, MEG, SEEG). The user can choose to add other views and can define options to handle the desired type of channels to display and how they are displayed. This permits the
visualization of different type of data or different time scales in separate views (see Figure 3). Special care has been dedicated to mapping the signal, which can be acquired at high sampling rate, to pixels on the screen. When a large amount of data is displayed on the screen, the horizontal resolution of a computer screen effectively bins together adjacent time points, and simply
downsampling the data for sake of efficiency could lead to aliasing. Instead, for each horizontal bin, we have taken into account the minimum and maximum signal within this bin in order to correctly rasterize the signal. This approach retains high frequency information such as high frequency oscillations. Figure 7 illustrates the rendering of an oscillation at two different time scales. When the horizontal scaling is changed, signals are displayed again using this technique. The visualization component is connected to a Data Server thread, as explained in section 2.1. In this scheme, handling large amount of data is done by only requesting the data part that needs to be displayed. We found that on a computer equipped with an Intel Core I7 at 2.8 GHz, the rendering of 60 channels of data on a 20 s page, sampled at 2034Hz, takes less than 250ms.
3.2 Filtering and scaling options
AnyWave can filter data differently depending on the channel type: EEG channels may have different filtering settings than MEG channels. The same principle applies to gain settings, although a global gain factor can be applied to all channels at once. The horizontal scale can be modified by setting the number of centimeters by seconds.
The filtering procedure for each channels, is dispatched on all the available CPU cores. This is accomplished using the QtConcurrent API from the Qt framework. Therefore, CPUs with 4 cores available will filter data from 4 channels at the same time.
7
3.3 Maps of sensors activities
AnyWave can generate 3D or 2D representations of the sensors and compute the mapping of their activities at a given time. Sensors coordinates must be provided in order to compute the mesh representation or the 2D projection (Figure 3). Coordinates can be read from the data file or extracted from an EEG template which is embedded in AnyWave. It is also possible to import coordinates of the sensors from a text file.
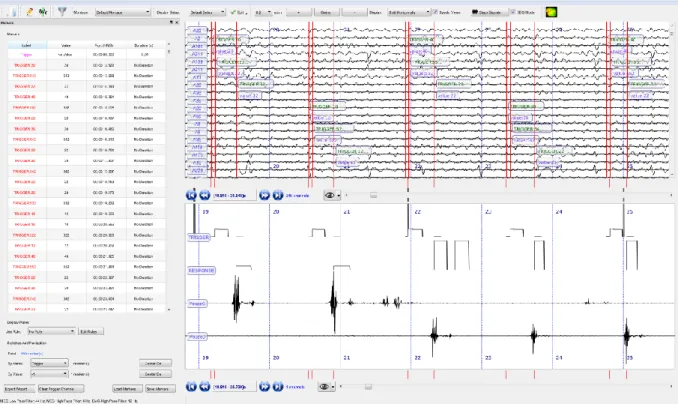
3.4 Markers
AnyWave uses markers to note particular events in signals (see Figure 4). Markers can also be read from the data file or imported afterwards. The user can also add her/his own markers manually or by using a signal processing algorithm that generates markers. Markers can consist of either selected time points or sections of data, with the option of specifying a subset of channels. AnyWave offers a dedicated user interface for managing markers, which allows the user to edit existing markers, launch signal processing on selected markers and navigate in signals through markers. When dealing with many markers, it is possible to define filtering rules that allow the user to quickly switch
between different sets of markers based on their labels, integer values, and other metadata. The software can handle a large amount of markers. The user can add markers in a convenient way, using keyboard shortcuts to navigate through existing markers for example. It is also possible to prepare a list of possible markers to add depending on the preceding event or marker. Then, when adding a marker, the user can quickly choose the type of marker he/she wants to add.
Displaying markers using filtering rules offers an ergonomic way to present only relevant markers on signal views. Markers can also be saved to a text file for processing in another software tool (MATLAB for example).
3.5 Montages
Montages are well known by clinicians who are used to review EEG or SEEG data on a daily basis. They describe which sensors or signals will be used from the data file and how they will be presented to the user. SEEG data are often visualized using bipolar montages, which can be implemented within AnyWave using the dedicated Montage user interface. A montage is involved in both the
visualization component and the data server component: the visualization component applies the defined montage to inform the signal views on what sensors should be displayed on the screen. The data server component makes use of the montage while getting data from the file, before sending them to clients. When opening a data file for the first time, a default montage is automatically defined. This montage contains all the sensors/channels as found originally in the data file. However, if the data has already been open, the last montage used with the file is automatically loaded and set.
8
4. Developing signal processing plug-ins
The most basic way of adding a plug-in is to implement the necessary C++ classes (see 2.2.2). However, MATLAB and Python are common tools for implementing signal processing algorithms; AnyWave offers a way to run processes written in these languages. To do so, a dedicated software development kit is provided with tutorials (available at http://meg.univ-amu.fr/wiki/AnyWave).
4.1 MATLAB and Python scripts
If a full copy of MATLAB is available on the system, AnyWave can run arbitrary MATLAB scripts (using the MATLAB Engine API) as plug-ins with full access to the same data as a C++ plug-in. For Python, AnyWave comes with many scientific libraries that user scripts can use, or if desired, the user can install a distribution that includes the suitable scientific libraries. Both MATLAB and Python scripts can request and process data, and optionally return data or results. On startup, AnyWave will look for plug-ins in the default directory or in the user’s home folders and automatically add them to the Processes menu. The only requirement to create a Python or a MATLAB plug-in is to create a folder and place in it at least two required files: the MATLAB main function (main.m) or the Python (__main.py__) main script. The second file is a descriptive text file that will inform AnyWave about the plug-in’s properties (name, description, etc.). The format of the descriptive text file is exactly the same for MATLAB and Python plug-ins. Once the two files are completed, the folder containing it must be placed in a location where AnyWave will notice it after a restart.
The scripting method of developing and providing plug-ins is useful because it does not require compiling code and the script that defines the plug-in can be changed on the fly to provide
immediate updates to the algorithm, allowing the developer to iterate quickly. MATLAB and Python are multiplatform languages, so developers can easily add and share their own code without targeting a particular platform. Python plug-ins offer the possibility to make a bridge between existing Python solutions as Openelectrophy (Garcia and Fourcaud-Trocmé, 2009) or MNE-Python (Gramfort et al., 2013) on the one hand and AnyWave on the other hand. An illustration is shown in the code 2 example below.
9 code 1 example:
1 % get the first 30 seconds of data 2 filters = AwFilteringOptions; 3 filters.eeg_hp = 2.0;
4 channels = AwGetData(0, 30, 'User Filtering Options', filters); 5
6 for i=1:length(channels) 7 ch = channels(i); 8
9 % extract data & time 10 y = ch.data;
11 t = [1:length(y)]/ch.samplingRate; 12
13 % threshold on 99% percentile 14 lim = quantile(y, 0.99); 15 hit = t(y>lim);
16
17 % keep first hit within 10 ms window 18 hit = hit(diff(hit) > 0.01);
19
20 % create markers 21 for j=1:length(hit)
22 AwAddMarker('hit', double(hit(j)), 42, 0.0, {ch.name}); 23 end
24 25 end
Code 1: Example of MATLAB Plug-in. This script demonstrates the use of MATLAB code as a plug-in. The script first obtains 30 seconds of data from AnyWave, with the current filter setting, detects for each channel where the signal exceeds its 99th percentile, and creates markers based on this detection. The results of the execution of this script can be seen on figure 5.
10 code 2 example:
import numpy import mne
from mne.io.array import create_info, RawArray
# get all data & create MNE data structure # using anywave.getData() method:
# first parameter is the starting position in seconds. # second parameter is the duration of data in seconds. # Specifying -1 as duration indicates ALL the data available.
anywave.getData(0, -1)
# getData() will fill an attribute if anywave module called input_channels # input_channels is an array of AwChannel objects.
# create numpy array from input_channels
data = numpy.array([ch.data for ch in anywave.input_channels])
# Get the sampling rate for data by reading sampling_rate attribute # of the fist AwChannel object in input_channels.
freq = anywave.input_channels[0].sampling_rate
# Get the electrode labels
labels = [ch.label for ch in anywave.input_channels]
# create the MNE data structure
types = ['meg'] * len(labels)
info = create_info(labels, freq, types) raw = RawArray(data, info)
# run ICA & save results
ica = mne.preprocessing.ICA(n_components = 50) ica.fit(raw, decim=3)
# Saving ica result along with data file using the data file name
ica.save(anywave.data_path + '-ica.fif')
Code 2: This script illustrates how to use MNE-Python to compute ICA on data coming from
AnyWave. AnyWave specific methods or attributes are available through an automatically imported module named anywave. Note that depending on MNE-Python version, the line importing
create_info can fail. Try importing from mne.io.meas_info instead.
4.2 MATLAB Compiled plug-ins
Python is available freely (on most common platforms), which is not the case for MATLAB. To run plug-ins without the MATLAB license, AnyWave supports plug-ins which embeds MATLAB compiled code. To build this type of plug-in, both the MATLAB Compiler and a C++ compiler are required. Fortunately, the MATLAB code can be easily ported from a MATLAB script as the MATLAB functions used to communicate with AnyWave have the same names and parameters. The final user will need only the MATLAB Compiler Runtime in order to run the plug-in (freely available at
http://www.mathworks.fr/products/compiler/mcr/). Developers have the choice of providing compiled plug-ins or Matlab scripted plug-ins. We encourage this second option. Our github (https://github.com/anywave) can host dedicated branches for new MATLAB scripted plug-ins.
11 To distribute MATLAB scripted plug-ins to end users who are not using the MATLAB software, we propose to build a compiled version for them, using the AnyWave compatible MCR version.
4.3. C++ plug-ins
C++ is the language used to build AnyWave and all its components. Therefore, it is possible to develop all types of plug-ins using C++ where MATLAB and Python can only be used to build Signal Processing Algorithms (or processes). C++ plug-ins required to be compiled for specific hardware architectures, so a Mac OS X plug-in will not run on a Linux platform, for example. However, the C++ API offers, for the moment, more features while developing plug-ins. The detailed documentation on this purpose can be found at http://meg.univ-amu.fr/wiki/AnyWave
A possible link between C++ sofwares, such as OpenVibe (Renard et al., 2010), and AnyWave can be established. For example, developers could use OpenVibe C++ API in their implementation of a C++ signal processing plug-in.
As an example of a C++ signal processing plug-in, Figure 6 shows a time-frequency representation, which uses two plug-ins of different types. The first plug-in is a signal processing algorithm that takes as input one or more signals and computes their time-frequency representation, based on Morlet wavelets (Bénar et al., 2009). For each input signal, a new signal is created as output and configured as “custom” type. As this signal does not contain a vector of value but a two dimensions matrix, the visualization component will not be able to natively display it. This is where the second plug-in, a Display plug-in, is used to render the 2D matrix in the visualization component. Note that the signal processing module is linked to display: when the user moves to another part of the file, the
corresponding time-frequency representation is automatically re-computed and display is updated. This is the default behavior for signal processing plug-in of type Display.
5. Concluding remarks and future directions
AnyWave responds to a consistent need to deliver state of the art signal processing and visualization techniques in the context of the clinic and wherever an efficient, user friendly interface is required. As a software toolbox and platform, it is not alone. In this context, academic free software have been rapidly developing. A few of those are provided as stand-alone programs, for example MNE
(http://martinos.org/mne/), Brainstorm (http://neuroimage.usc.edu/brainstorm/), openMEEG (Gramfort et al., 2010), Cartool (Brunet et al., 2011) or Python programs (Garcia and Fourcaud-Trocmé, 2009) but the most popular ones are MATLAB toolboxes (Delorme and Makeig, 2004; Oostenveld et al., 2011). In each case, the scopes of these toolboxes are oriented by original objectives of the developers. Brainstorm is oriented to source localization and presents a user-friendly windows interface although it can be batch scripted (Tadel et al., 2011). Fieldtrip is a
12 collection of scriptable functions from preprocessing to statistics but requires a certain level of programming to use effectively (Oostenveld et al., 2011). EEGLAB is well designed for processing of continuous signals and evoked activities (Delorme and Makeig, 2004) but its capacities in signal representation and handling markers are limited. Additionally, it can be easily adapted to new requirements. In particular, while algorithms can be written in C++ for full speed, we can also take advantage of the plethora of tools already available in MATLAB and Python toolboxes. Furthermore, the MATLAB and Python frameworks allow a plug-in to save data in other file formats for further processing with other tools if necessary.
We do not want to propose a replacement for existing software but rather a complementary solution with good visualization of signals and a user friendly interface. With AnyWave, it is now possible for neurophysiologists to visualize and process data through a user-friendly interface and for researchers in biomedical engineering and signal processing can easily test and put into practice new algorithms, making the collaboration between both worlds more efficient. To our knowledge, only one
development (Wendling and Badier, 1998) has had a similar goal. It was, however, developed on NextStep/OpenStep operating system, a platform that no longer exists and didn't allow for the use of multiple programming languages.
In summary, AnyWave is designed as a dynamic solution: plug-ins will add new features, new signal processing algorithms, new supported file format and so on. The software currently supports working with continuous data set. Support for epoched data and a dedicated user interface to manage
averaged files and evoked potentials is currently under development. The architecture allows future extensions to support additional types of information, such as MRIs and models for source
localization.
FIGURE LEGENDS
Figure 1: Software components, organized in layers from the operating system to the dynamically loaded plug-ins.
Figure 2: Data flow across software components (rectangles) and plug-ins (diamond shapes). Figure 3: Overview of the main window (the visualization component), presenting different type of traces of the same recording and a 3D mapping of sensors activities. Different filters have been applied for the different types of data.
Figure 4: Overview of the main window (the visualization component), showing markers. To the left, the markers’ user interface is docked and allows quick navigation through markers. Markers are visible on the top view, with their labels and associated values.
13 Figure 5: Signals with markers, added by a scripted plug-in.
Figure 6: An example of Time-Frequency representation of a signal.
Figure 7: Illustration of the visual rendering of a high frequency oscillation (red arrow) at two different time scales.
REFERENCES
Aguera PE, Jerbi K, Caclin A, Bertrand O. ELAN: a software package for analysis and visualization of MEG, EEG, and LFP signals. Comput Intell Neurosci, 2011; 2011: 158970.
Baillet S, Mosher JC, Leahy RM. Electromagnetic brain mapping. IEEE Signal Processing Magazine, 2001; 18: 14-30.
Brunet D, Murray MM, Michel CM. Spatiotemporal analysis of multichannel EEG: CARTOOL. Comput Intell Neurosci, 2011; 2011: 813870.
Bénar CG, Papadopoulo T, Torrésani B, Clerc M. Consensus Matching Pursuit for multi-trial EEG signals. Journal of neuroscience methods, 2009; 180: 161-70.
Delorme A, Makeig S. EEGLAB: an open source toolbox for analysis of single-trial EEG dynamics including independent component analysis. J Neurosc Meth, 2004; 134: 9-21.
Garcia S, Fourcaud-Trocmé N. OpenElectrophy: An Electrophysiological Data- and Analysis-Sharing Framework. Front Neuroinform, 2009; 3: 14.
Gramfort A, Luessi M, Larson E, Engemann DA, Strohmeier D, Brodbeck C, Goj R, Jas M, Brooks T, Parkkonen L, Hämäläinen M. MEG and EEG data analysis with MNE-Python. Front Neurosci, 2013; 7: 267.
Gramfort A, Papadopoulo T, Olivi E, Clerc M. OpenMEEG: opensource software for quasistatic bioelectromagnetics. Biomedical Engineering Online, 2010; 9.
Litvak V, Mattout J, Kiebel S, Phillips C, Henson R, Kilner J, Barnes G, Oostenveld R, Daunizeau J, Flandin G, Penny W, Friston K. EEG and MEG data analysis in SPM8. Comput Intell Neurosci, 2011; 2011: 852961.
Oostenveld R, Fries P, Maris E, Schoffelen JM. FieldTrip: Open source software for advanced analysis of MEG, EEG, and invasive electrophysiological data. Comput Intell Neurosci, 2011; 2011: 156869. Renard Y, Lotte F, G G, Congedo M, Maby E, Delannoy V, Bertrand O, Lécuyer A. OpenViBE: An Open-Source Software Platform to Design, Test and Use Brain-Computer Interfaces in Real and Virtual Environments. Presence : teleoperators and virtual environments, 2010; 19.
Rosenblatt B, Gotman J. Computerized EEG monitoring. Semin Pediatr Neurol, 1999; 6: 120-7. Tadel F, Baillet S, Mosher JC, Pantazis D, Leahy RM. Brainstorm: a user-friendly application for MEG/EEG analysis. Comput Intell Neurosci, 2011; 2011: 879716.
Wendling F, Badier J-M. Clinical engineering in neurophysiology: an object-oriented platform for signal visualization and processing. J Clin Eng, 1998; 23: 189-95.
14 Figure 1. Software components, organized in layers from the operating system to the dynamically loaded plug-ins.
15 Figure 3. Overview of the main window (the visualization component), presenting different types of traces of the same recording and a 3D mapping of sensors activities. Different filters have been applied for the different types of data.
Figure 4. Illustration of the visual rendering of a high frequency oscillation (red arrow) at two different time scales.
16 Figure 5. Overview of the main window (the visualization component), showing markers. To the left, the markers’ user interface is docked and allows quick navigation through markers. Markers are visible on the top view, with their labels and associated values.
17 Figure 7. An example of time-frequency representation of a signal.