HAL Id: hal-02274944
https://hal.sorbonne-universite.fr/hal-02274944
Submitted on 30 Aug 2019
HAL is a multi-disciplinary open access
archive for the deposit and dissemination of
sci-entific research documents, whether they are
pub-lished or not. The documents may come from
teaching and research institutions in France or
abroad, or from public or private research centers.
L’archive ouverte pluridisciplinaire HAL, est
destinée au dépôt et à la diffusion de documents
scientifiques de niveau recherche, publiés ou non,
émanant des établissements d’enseignement et de
recherche français ou étrangers, des laboratoires
publics ou privés.
(SteatoTest-2) for the prediction of liver steatosis
Thierry Poynard, Valentina Peta, Mona Munteanu, Frédéric Charlotte, Yen
Ngo, An Ngo, Hugo Perazzo, Olivier Deckmyn, Raluca Pais, Philippe
Mathurin, et al.
To cite this version:
Thierry Poynard, Valentina Peta, Mona Munteanu, Frédéric Charlotte, Yen Ngo, et al.. The diagnostic
performance of a simplified blood test (SteatoTest-2) for the prediction of liver steatosis. European
Journal of Gastroenterology and Hepatology, Lippincott, Williams & Wilkins, 2019, 31 (3), pp.393-402.
�10.1097/MEG.0000000000001304�. �hal-02274944�
The diagnostic performance of a simpli
fied blood test
(SteatoTest-2) for the prediction of liver steatosis
Thierry Poynarda,b, Valentina Petac, Mona Munteanuc, Frederic Charlottea, Yen Ngoc, An Ngoc, Hugo Perazzoa,b, Olivier Deckmync, Raluca Paisa,b, Philippe Mathurind, Rob Myerse, Rohit Loombafand Vlad Ratziua,b; for the FLIP consortium, the FibroFrance-CPAM group, the FibroFrance-Obese group, and the Selonsertib groupBackground Serum biomarkers of steatosis such as the SteatoTest are recommended for large-scale screening studies, because imaging is less accessible and more expensive.
Aims The primary aim of this retrospective analysis of prospective studies was to construct a new SteatoTest-2 that was not inferior to the referencefirst-generation SteatoTest, but that did not include BMI or bilirubin, as these two components can increase test variability because of the assessment of weight and height and in case of Gilbert syndrome or hemolysis, respectively.
Patients and methods Five different subsets of 2997 patients with biopsies were evaluated for test construction and validation, and four to assess the prevalence of steatosis in target populations with increasing risks of steatosis. The performance of the SteatoTest-2 was compared with the reference test, using the noninferiority test (0.10 margin) and the Lin concordance coefficient.
Results Areas under the receiver operating characteristic curve of the SteatoTest-2 were noninferior to the reference test (P< 0.001). Areas under the receiver operating characteristic curve varied in the SteatoTest-2 and the reference test according to subsets and the prevalence of steatosis, with 0.772 [95% confidence interval (CI): 0.713–0.820] versus 0.786 (95% CI: 0.729–0.832) in the 2997 cases with biopsy and 0.822 (95% CI: 0.810–0.834) versus 0.868 (95% CI: 0.858–0.878) in the 5776 cases including healthy individuals without risk factors of steatosis as controls, respectively. The Lin coefficient was highly concordant (P< 0.001), from 0.74 (95% CI: 0.74–0.74) in presumed NAFLD to 0.91 (95% CI: 0.89–0.93) in the construction subset.
Conclusion The SteatoTest-2 is simpler and noninferior to thefirst-generation SteatoTest for the diagnosis of steatosis, without the limitations of BMI and bilirubin. Eur J Gastroenterol Hepatol 31:393–402
Copyright © 2018 The Author(s). Published by Wolters Kluwer Health, Inc.
Introduction
Steatosis should be determined whenever metabolic liver disease is suspected as a primary disease or coexisting con-dition. Serum biomarkers of steatosis such as the SteatoTest
are recommended for large-scale screening studies, because of the limited access and cost of imaging [1].
European guidelines have recommended three blood tests for the diagnosis of steatosis in large studies of patients at risk of nonalcoholic fatty liver disease (NAFLD). The three most well-validated steatosis scores are the fatty liver index, the SteatoTest, and the NAFLD liver fat score, which have all been externally validated in the general population or in grade 3 obese persons to predict metabolic, hepatic, and cardiovascular outcomes/ mortality. Guidelines have also stated that these scores are associated with insulin resistance and reliably predict the presence (≥5% of hepatocytes), but not the severity, of steatosis [2].
Indeed, the evidence-based diagnostic studies published at that time did not address a major limitation that was induced by the small number of controls without steatosis [3,4]. In the ‘best’ external validation, only 5% of the population had no histological steatosis (< 5%) (15 con-trols of 496 patients at risk), which prevents any serious estimate of the specificity of steatosis tests [2]. In the usual context of use of NAFLD screening, such as diabetics or the general population, the expected prevalence of stea-tosis is not 95%, but between 20 and 50%, as presumed by proton magnetic resonance spectroscopy (MRS) [1,5]. SteatoTest was the only recommended blood test that
a
Department of Hepatology, Assistance Publique-Hôpitaux de Paris,
Pitié-Salpêtrière Hospital,bSorbonne University, INSERM, Saint-Antoine Research
Center and Institute of Cardiometabolism and Nutrition,c
BioPredictive, Paris,
dDepartment of Digestive Diseases, Hôpital Huriez, CHRU Lille, Lille, France, e
Gilead Sciences Inc., Foster City andf
Division of Gastroenterology and Epidemiology, NAFLD Research Center, University of California San Diego, California, USA
Correspondence to Thierry Poynard, MD, PhD, Salpêtrière Hospital, 57 Bd Hopital, Paris 75013, France
Fax:+ 33 014 217 7623; e-mail: thierry@poynard.com
Supplemental Digital Content is available for this article. Direct URL citations appear in the printed text and are provided in the HTML and PDF versions of this article on the journal's website, www.eurojgh.com.
Received 18 July 2018 Accepted 20 August 2018
This is an open-access article distributed under the terms of the Creative Commons Attribution-Non Commercial-No Derivatives License 4.0 (CCBY-NC-ND), where it is permissible to download and share the work provided it is properly cited. The work cannot be changed in any way or used commercially without permission from the journal.
European Journal of Gastroenterology & Hepatology 2019, 31:393–402 Keywords: control group for steatosis test, false-negative steatosis test, false-positive steatosis test, noninvasive diagnosis, SteatoTest
’
Original article
included a large number of controls without steatosis in its construction and internal validations [2,4,6].
When constructing noninvasive tests for metabolic liver disease, another underevaluated consequence of the variability of steatosis is its effect on the prevalence of NASH, which is usually defined by the American Clinical-Research-Network (CRN) and European Fatty-Liver-Inhibition-of-Progression (FLIP) scoring systems, requiring at least 5% steatosis [3].
The first SteatoTest had certain limitations, including potential variability from two components, the BMI and total bilirubin. BMI is a source of significant variability because of the methods of measurement [7] and aging [8]. Total bilirubin can induce false positives because of Gilbert syndrome or hemolysis [9]. Finally, we also evaluated the performance of these tests in assessing the quantity of steatosis.
Thus, to simplify the feasibility of the original test, our goal was to construct and validate a simplified SteatoTest-2 without BMI and total bilirubin as components. On the basis of the effect of the definition of steatosis on the construction of biomarkers, both for steatosis and NASH [3,4,10–12], we used several validation studies, including new controls without steatosis and paired biopsies, to compare the performances of these tests for various pre-valences of steatosis.
Patients and methods
All clinical studies were approved by the ethics committee at each participating institution and were performed according to good clinical practice and the Declaration of Helsinki, and all patients provided written informed con-sent. Details were provided in each publication and sum-marized in Supplementary File S1 (Supplemental digital content 1, http://links.lww.com/EJGH/A358).
Study design
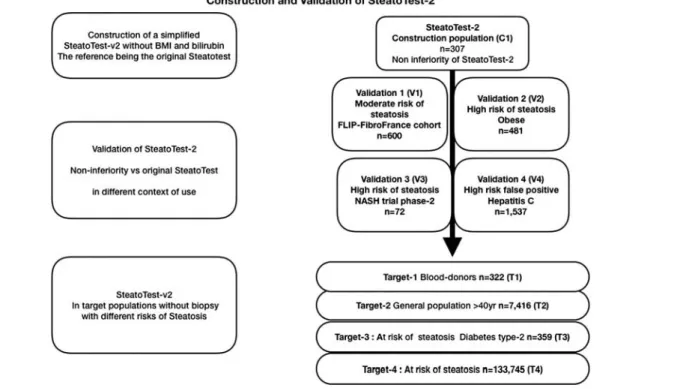
The primary aim of this retrospective study that pro-spectively analyzed patient subsets (Fig. 1) was to con-struct a new SteatoTest-2 (patent pending) that was simplified, was highly concordant with and not inferior to the first-generation SteatoTest, with greater applicability and had less risk of false positives in the general popula-tion. The SteatoTest-2 was also assessed in a prospective trial of selonsertib for the treatment of NASH on the basis of paired biopsies before and after treatment.
The secondary aim was to assess the performance of SteatoTest-2 when combined with NashTest-2, in non-invasive algorithms reproducing the histological NASH-algorithms (CRN or FLIP), which needed the presence of steatosis for the diagnostic of NASH [3,4].
We also evaluated the variability of SteatoTest-2 areas under the receiver operating characteristic curve (AUROCs) in relation to the prevalence of steatosis, the spectrum effect, degrees of inflammation, stages of fibrosis, fasting glucose, and BMI. Finally, the SteatoTest-2 was validated for the CRN grades of moderate and marked steatosis [1].
Patients and controls
A total of nine different subsets of individual data were included. All data were previously published (Fig. 1). One subset was used for the construction of the original test (C1) including 307 cases with different causes of steatosis, and controls [6]. Four subsets were used for validation: V1, including 600 patients with NAFLD [13]; V2, 481 obese patients [14]; V3, 72 patients with NASH [15]; and V4, 1537 patients with chronic hepatitis C [16]. These five subsets had biopsies and are described in Table 1. Finally, four subsets without biopsies (Table 2) were used to assess the prevalence of steatosis presumed by both SteatoTest-2
and SteatoTest, in targeted patients with increasing risks of steatosis: T1, 327 blood donors [17]; T2, 7416 healthy volunteers [18]; T3, 359 patients with type 2 diabetics [17]; and T4, 133 045 patients with NAFLD [13]. Controls with a low or very low risk are described in the Statistics section.
Histological references
All biopsies were scored by experienced pathologists, blinded to historical biopsy reports, test results, and other clinical data. Details of methods were provided in Supplementary File S1 (Supplemental digital content 1, http://links.lww.com/
EJGH/A358). The FLIP–CRN scoring system was used for the main end point [10–12]. The steatosis score (S) assesses and rates the quantity of large-sized or medium-sized lipid droplets from 0 to 3, except for foamy microvesicles (S0: <5%; S1: 5–33%, mild; S2: > 33–66%, moderate; and S3: ≥ 66%, marked). Activity grade (A, from 0 to 4) is the unweighted addition of hepatocyte ballooning (0–2) and lobular inflammation (0–2). Cases with A0 (A = 0) have no activity, A1 (A= 1) mild activity, A2 (A = 2) moderate activ-ity, A3 (A= 3) severe activity, and A4 (A = 4) very severe activity. Fibrosis stage (F) was assessed by the following score: stage 0 (F0)= none; stage 1 (F1) = 1a or 1b perisinusoidal
Table 1.Clinical and histological characteristics of patients with suspected steatosis included infive subsets with biopsies Subsets with biopsies
Characteristics Construction Validation-1 Validation-2 Validation-3 Validation-4
Context of use NAFLD, ALD, CHC NAFLD Obese NASH CHC
References Poynardet al. [6] Munteanuet al. [13] Poynardet al. [14] Loombaet al. [15] Poynardet al. [9]
N 307 600 481 72 1537
Sex (male) [n (%)] 199 (64.8) 380 (63.3) 107 (22.3) 22 (30.6) 1074 (69.9)
Age [median (IQR)] 48 (39–58) 53 (44–58) 43 (34–50) 56 (47–61) 51 (51–52)
NAFLD/CHC/CHB/ALD (n) 69/209/17/12 600/0/0/0 481/0/0/0 72/0/0/0 0/1537/0/0
Diabetes type 2 declared [n (%)] 23 (7.5) 136 (22.7) 139 (28.9) 51 (70.8) Unknown
NAFLD risk [n (%)]
Glucose< 7 and BMI < 30 kg/m2 231 (75.2) 270 (45.0) 0 (0) 15 (20.8) 1081 (70.3)
BMI≥ 30 only 53 (17.3) 194 (32.3) 342 (71.1) 26 (36.1) 348 (22.6)
Glucose≥ 7 mmol/l only 23 (7.5) 51 (8.5) 0 (0) 6 (8.3) 63 (4.1)
Glucose≥ 7 and BMI ≥ 30 0 (0) 85 (14.2) 139 (28.9) 25 (34.7) 45 (3.0)
Biopsy [median (IQR)]
Biopsy length (mm) 16 (13–20) 25 (19–27) 12 (11–12) 23 (18–27) 12 (12–13)
Biopsy-test days 1 (0–30) 0 (0–30) 0 (− 0.2–0) 0 (0.1–0.3) 162 (153–159)
Stage offibrosis (CRN/FLIP) [n (%)]
F0 nofibrosis 61 (19.9) 122 (20.3) 232 (48.2) 0 (0) 0 (0)
F1 perisinusoidal or portal 125 (40.7) 184 (30.8) 203 (42.2) 0 (0) 0 (0)
F2 sinusoidal/periportal 52 (16.9) 140 (23.3) 28 (5.8) 25 (34.7) 423 (27.5)
F3 bridgingfibrosis 36 (11.7) 121 (20.2) 12 (2.5) 47 (65.3) 459 (29.9)
F4 cirrhosis 33 (10.8) 33 (5.5) 6 (1.3) 0 (0) 655 (42.6)
Grade of steatosis (CRN/FLIP) [n (%)]
S0 0% (brunt grade for CHC)a NA NA NA NA 186 (12.1)
S0< 5% 134 (43.7) 20 (3.3) 69 (14.4) 0 (0) 732 (47.6) S1 mild 5–33% 78 (25.4) 204 (34.0) 155 (40.3) 48 (66.7) 322 (21.0) S2 moderate marked> 33% 52 (16.9) 229 (38.2) 160 (45.3) 18 (25.0) 185 (12.0) S3 marked≥ 66% 43 (14.0) 147 (24.5) 97 (20.2) 6 (8.3) 112 (7.3) CRN–FLIP-algorithm [n (%)] No-steatosis (‘No-NAFLD’) 65 (21.2) 20 (3.3) 31 (6.4) 0 (0) NA Steatosis only 200 (65.1) 150 (25.0) 326 (67.8) 0 (0) NA NASH 42 (13.7) 430 (71.7) 124 (25.8) 72 (100) NA SteatoTest 0.47 (0.27–0.71) 0.65 (0.49–0.80) 0.60 (0.46–0.81) 0.83 (0.67–0.92) 0.50 (0.35–0.74) No (S0< 0.48) 158 (51.5) 143 (23.8) 21 (4.4) 5 (6.9) 701 (45.6) Minimal (S1≥ 0.48 to <0.57) 28 (9.1) 78 (13.0) 130 (27.0) 4 (5.6) 261 (17.0) Moderate (S2≥ 0.57 to <0.69) 36 (11.7) 117 (19.5) 239 (49.7) 10 (13.9) 316 (20.6) Severe (S3≥ 0.69–1.00) 95 (27.7) 262 (43.4) 91 (18.9) 53 (73.6) 259 (16.8) SteatoTest-2 CRN-123 0.47 (0.30–0.68) 0.67 (0.51–0.80) 0.50 (0.33–0.66) 0.73 (0.64–0.85) 0.45 (0.34–0.70) No (S0< 0.40) 119 (38.8) 83 (13.8) 166 (34.5) 5 (6.9) 592 (38.5) Minimal (S1≥ 0.40 to <0.55) 75 (24.4) 106 (17.7) 117 (24.3) 4 (5.6) 479 (31.2) Moderate (S2≥ 0.55 to <0.62) 18 (5.9) 67 (11.2) 52 (10.8) 6 (8.3) 166 (10.8) Severe (S3≥ 0.62–1.00) 95 (30.9) 344 (57.3) 146 (14.6) 57 (79.2) 300 (19.5)
NashTest not requiring steatosis [n (%)] No (N0< 0.25) 11 (3.6) 9 (1.4) 173 (36.0) 0 (0) NA Minimal (N1≥0.25 to < 50) 70 (22.8) 109 (18.2) 221 (45.9) 3 (4.2) NA Moderate (N2≥ 0.50 to < 0.75) 89 (29.0) 278 (46.2) 71 (14.8) 23 (31.9) NA Severe (N3≥ 0.75-1.00) 137 (44.9) 204 (34.2) 16 (3.3) 46 (63.9) NA NashTest-2 requiring steatosisb[n (%)] No (N0< 0.25 or no steatosis)b 125 (40.7) 87 (14.5) 230 (47.8) 0 (0) NA Mild (N1≥ 0.25 to < 50) 30 (9.8) 79 (13.2) 171 (35.6) 3 (4.2) NA Moderate (N2≥ 0.50 to < 0.75) 49 (16.0) 240 (40.0) 65 (15.5) 23 (31.9) NA Severe (N3≥ 0.75-1.00) 103 (33.5) 194 (32.3) 15 (3.1) 46 (63.9) NA
aFor chronic hepatitis C, the cases with minimal steatosis (1–4%) were given and represented 732/918 (80%) of S0 as defined by CRN score. bNashTest-2 was set to Grade N0 when SteatoTest-2< 0.40, according to standard definition of histological NASH, requiring steatosis.
ALD, alcoholic liver disease; CHB, chronic hepatitis B; CHC, chronic hepatitis C; CRN, American Clinical-Research-Network; FLIP, European Fatty-Liver-Inhibition-of-Progression; IQR, interquartile range; NA, not applicable as patients had chronic hepatitis C; NAFLD, nonalcoholic fatty liver disease.
zone 3 or 1c portalfibrosis; stage 2 (F2) = perisinusoidal and periportal fibrosis without bridging; stage 3 (F3) = bridging fibrosis; and stage 4 (F4) = cirrhosis (Supplementary File S1, Supplemental digital content 1, http://links.lww.com/EJGH/ A358). To reduce interobserver variability and standardize the reading on the basis of the new SAF–FLIP histological classification, we used reports reviewed by members of the FLIP Pathology Consortium (Frederic Charlotte, for C1, V1, and V2; Pierre Bedossa for C1, V1, and V4; and Dina Tianakos for V1) or CRN (Zack Goodman for V1 and V3).
Blood tests
The FibroTest, ActiTest, and original SteatoTest are patented as ‘In Vitro Diagnostic Multivariate Index Assays’ for the diagnosis of METAVIRfibrosis stages, including cirrhosis, for
SAF-equivalent activity and for SAF-equivalent steatosis grades, respectively [10]. A quantitative NashTest-2 was constructed and internally validated in 1081 patients at risk of metabolic liver disease [4]. These tests are exclusively avail-able online and include clinical security algorithms. The recommended cutoffs were the same, whatever the chronic liver disease (Supplementary File S1, Supplemental digital content 1, http://links.lww.com/EJGH/A358). Analyzers and kits were those validated and recommended by BioPredictive, and all control assays were performed in the reference bio-chemistry department of Pitié Salpêtrière Hospital [10].
The original SteatoTest, recommended in recent NAFLD guidelines, was used as the comparator [1]. The SteatoTest-2 was constructed by regression analysis without BMI or total bilirubin as components, but with aspartate aminotransferase (AST). Thus, the new test included the following 10
Table 2.Clinical characteristics and steatosis grades, NASH grades, andfibrosis stages, presumed by blood tests in four subsets with increasing risks of steatosis
Subsets without biopsies
Characteristics Target-1 Target-2 Target-3 Target-4
Context of use Blood donors Healthy volunteers≥ 40 years Type 2 diabetes Presumed NAFLD
Risk of steatosis Low risk Intermediate risk High risk High risk
References Jacqueminetet al. [17] Poynardet al. [18] Jacqueminetet al. [17] Poynardet al. [9]
N 322 7416 359 133 045
Age (years) [median (IQR)] 32.5 (29.7–35.1) 57.8 (49.8–63.1) 59.2 (52.3–66.4) 56.2 (46.3–64.6)
Male [n (%)] 174 (54.0) 4085 (55.1) 193 (53.8) 59 756 (44.9)
Type 2 diabetes and BMI [n (%)]
No T2D and BMI< 30 300 (93.2) 6195 (83.5) 0 (0) 51 224 (38.5)
BMI≥ 30 only 22 (6.8) 913 (12.3) 0 (0) 52 994 (39.8)
T2D only 0 210 (2.8) 210 (58.5) 9531 (7.2)
T2D and BMI≥ 30 0 98 (1.3) 149 (41.5) 19 296 (14.5)
NAFLD risk [n (%)]
Glucose< 7 and BMI < 30 263 (81.2) 6195 (83.5) 62 (17.3) 51 224 (38.5)
BMI≥ 30 only 20 (6.2) 913 (12.3) 36 (10.0) 52 994 (39.8)
Glucose≥ 7 only 37 (11.5) 210 (2.8) 148 (41.2) 9531 (7.2)
Glucose≥ 7 and BMI ≥ 30 2 (0.6) 98 (1.3) 113 (31.5) 19 296 (14.5)
NAFLD sensitive risk [n (%)]
Glucose< 6.1 and BMI < 30 217 (67.4) 5489 (74.0) 34 (9.5) 42 916 (32.3)
BMI≥ 30 only 14 (4.4) 672 (9.1) 20 (5.6) 40 455 (30.4)
Glucose≥ 6.1 only 83 (25.8) 916 (12.4) 176 (49.0) 17 839 (13.4)
Glucose≥ 6.1 and BMI ≥ 30 8 (2.5) 339 (4.6) 129 (35.9) 31 835 (23.9)
Glucose< 6.1 BMI < 25 FibroTest 0.09 (0.08–0.09) 0.14 (0.09–0.21) 0.17 (0.08–0.32) 0.22 (0.10–0.46) F0≤ 0.27 312 (96.9) 6260 (84.4) 256 (71.3) 76 681 (57.6) F1> 0.27 to ≤ 0.48 10 (3.1) 910 (12.3) 67 (18.7) 25 110 (18.9) F2> 0.48 to ≤ 0.58 0 143 (1.9) 18 (5.0) 8150 (6.1) F3> 0.58 to ≤ 0.74 0 72 (1.0) 11 (3.1) 10 682 (8.0) F4> 0.74–1.00 0 31 (0.4) 7 (1.9) 12 422 (9.3) SteatoTest 0.12 (0.11–0.14) 0.33 (0.18–0.51) 0.63 (0.44–0.80) 0.71 (0.49–0.85) No (S0< 0.48) 288 (89.5) 5317 (71.7) 116 (32.3) 20 738 (15.6) Minimal (S1≥ 0.48 to <0.57) 13 (4.0) 755 (10.2) 32 (8.9) 22 524 (16.9) Moderate (S2≥ 0.57 to <0.69) 13 (4.0) 796 (10.7) 58 (16.2) 19 875 (15.0) Severe (S3≥ 0.69–1.00) 8 (2.5) 548 (7.4) 153 (42.6) 69 908 (52.5) SteatoTest-2 0.17 (0.16–0.19) 0.40 (0.27–0.56) 0.66 (0.52–0.80) 0.58 (0.42–0.74) No (S0< 0.40) 272 (84.5) 3700 (49.9) 53 (14.8) 30 837 (23.2) Minimal (S1≥ 0.40 to <0.55) 33 (10.3) 1772 (23.9) 56 (15.6) 28 471 (21.4) Moderate (S2≥ 0.55 to <0.62) 13 (4.0) 651 (8.8) 40 (11.1) 14 703 (11.0) Severe (S3≥ 0.62–1.00) 4 (1.2) 1293 (17.4) 210 (58.5) 59 034 (44.4)
NashTest not requiring steatosisa 0.24 (0.17–0.34) 0.42 (0.33–0.52) 0.48 (0.36–0.63) 0.60 (0.42–0.78)
No (N0< 0.25) 171 (53.1) 726 (9.8) 32 (8.9) 9513 (7.2)
Mild (N1≥ 0.25 to < 50) 134 (41.6) 4470 (60.3) 167 (46.5) 37520 (28.2)
Moderate (N2≥ 0.50 to < 0.75) 16 (5.0) 2027 (27.3) 125 (34.8) 47498 (35.7)
Severe (N3≥ 00.75–1.00) 1 (0.3) 193 (2.6) 35 (9.8) 38514 (28.9)
NashTest-2 requiring steatosisa 0.24 (0.17–0.34) 0.42 (0.33–0.52) 0.48 (0.36-0.63) 0.60 (0.42–0.78)
No (N0< 0.25) if S0 278 (86.3) 3808 (51.4) 72 (20.1) 34546 (26.0)
Mild (N1≥ 0.25 to < 50) 34 (10.6) 1941 (26.2) 137 (38.2) 25071 (18.8)
Moderate (N2≥ 0.50 to < 0.75) 10 (3.1) 1497 (20.2) 116 (32.3) 38321 (28.8)
Severe (N3≥ 0.75-1.00) 0 (0.0) 170 (2.3) 34 (9.5) 35107 (26.4)
aNashTest-2 was set to Grade N0 when SteatoTest-2< 0.40, according to standard definition of histological NASH, requiring steatosis.
NA, not applicable as patients with chronic hepatitis C. IQR, interquartile range; NAFLD, nonalcoholic fatty liver disease.
components in its patented formula: α-2-macroglobulin, apolipoprotein A1, haptoglobin, γ-glutamyl transferase, ala-nine aminotransferase, AST, total cholesterol, and fasting glucose, adjusted by age and sex.
Statistical analysis
The protocol and analyses followed FibroSTARD recom-mendations [19] adapted for steatosis [3,4], which are described in Supplementarty File S2 (Supplemental digital content 2, http://links.lww.com/EJGH/A359). We pre-viously discussed the limitations of the FLIP and CRN standard definitions of metabolic liver disease and their effect on the construction of noninvasive tests [3]. These limitations include the presence of appropriate histological controls in only 2.2% (13/576) of cases without steatosis and without inflammatory activity in the reference study of the CRN group [3,12].
SteatoTest-2 was constructed retrospectively (C1) on the basis of the same subset used for the construction of the original SteatoTest, from a sample size of 307 cases with all components. To ensure appropriate power for the noninferiority tests between the AUROCs of the new test and the reference test, as well as for the correlation of concordance in the different data subsets, we included more than 2000 patients at risk of metabolic or virologic steatosis, with centralized biopsies. Two validation sub-sets, V3 and V4, had not been previously published for assessing the performance of SteatoTest.
For the main end point of noninferiority, we directly compared empirically estimated AUROCs, without using nonbinary AUROCs because the same patients underwent both the new and reference tests simultaneously in each data subset (Tables 1 and 2). The primary end point was to compare test results in all included cases with biopsies for
the diagnosis of all grades of steatosis (from S1 to S3 CRN grades) to the absence of steatosis (S0).
To prevent the limitations of previous studies of bio-markers, which have included fewer than 30 cases without steatosis [20], and as discussed elsewhere [3,4], we included a large number of controls, 158 cases with histologically pro-ven grade CRN-S0 from validation subsets (V1–V4), and 2779 controls of T1 (n= 207) and T2 (n = 2562) subsets without biopsy (Table 3). These controls without biopsy were defined on the same criteria than those used for the controls of studies which assessed the performances of localized proton MRS, by hepatic triglyceride content [21]: no identifiable risk factors, a BMI below 25 kg/m2, no dia-betes, fasting glucose below 6.1 mmol/l, minimal alcohol consumption (20 g for women and 30 g for men), and no known liver disease. Secondary end points were AUROCs with specificity assessed in three control groups, biopsy + T1 controls, biopsy + T2 controls, and biopsy + T1 + T2 controls. Cutoffs were based on the method used for MRS [21]. In that study, the 95% percentile of hepatic triglyceride content, assessed in 345 controls with no risk of steatosis, was 5.56%. This corresponds to a hepatic level of 55.6 mg/g and is considered the cutoff for the upper limit of normal (ULN) on MRS, and a reference for the absence of steatosis (grade S0). In our study, we chose a cutoff that optimized a high negative predictive value (≥90%) of ST2 for the diagnosis of steatosis of at least 5%. On the basis of the usual range of the pre-valence of steatosis (17–46%) in adults [1,18,21,22], we chose 18.1% (95% confidence interval (CI): 17.2–18.9%; 1336/7395] as the predetermined prevalence to determine the negative predictive value of the new cutoff of SteatoTest-2. This prevalence was previously assessed in consecutive healthy volunteers, representative of the French population aged 40 years or older [18].
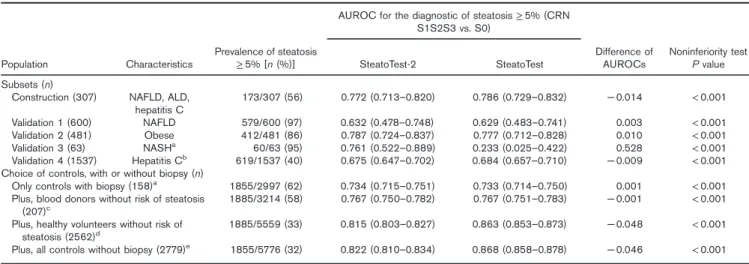
Table 3.Noninferiority of SteatoTest-2 compared with the original SteatoTest for the diagnostic of steatosis of at least 5% AUROC for the diagnostic of steatosis≥ 5% (CRN
S1S2S3 vs. S0) Population Characteristics Prevalence of steatosis ≥ 5% [n (%)] SteatoTest-2 SteatoTest Difference of AUROCs Noninferiority test P value Subsets (n)
Construction (307) NAFLD, ALD, hepatitis C 173/307 (56) 0.772 (0.713–0.820) 0.786 (0.729–0.832) − 0.014 < 0.001 Validation 1 (600) NAFLD 579/600 (97) 0.632 (0.478–0.748) 0.629 (0.483–0.741) 0.003 < 0.001 Validation 2 (481) Obese 412/481 (86) 0.787 (0.724–0.837) 0.777 (0.712–0.828) 0.010 < 0.001 Validation 3 (63) NASHa 60/63 (95) 0.761 (0.522–0.889) 0.233 (0.025–0.422) 0.528 < 0.001 Validation 4 (1537) Hepatitis Cb 619/1537 (40) 0.675 (0.647–0.702) 0.684 (0.657–0.710) − 0.009 < 0.001
Choice of controls, with or without biopsy (n)
Only controls with biopsy (158)a 1855/2997 (62) 0.734 (0.715–0.751) 0.733 (0.714–0.750) 0.001 < 0.001
Plus, blood donors without risk of steatosis
(207)c 1885/3214 (58) 0.767 (0.750–0.782) 0.767 (0.751–0.783) − 0.001 < 0.001
Plus, healthy volunteers without risk of steatosis (2562)d
1885/5559 (33) 0.815 (0.803–0.827) 0.863 (0.853–0.873) − 0.048 < 0.001 Plus, all controls without biopsy (2779)e 1855/5776 (32) 0.822 (0.810–0.834) 0.868 (0.858–0.878) − 0.046 < 0.001
ALD, alcoholic liver disease; AUROC, area under the receiver operating characteristic curve; CRN, American Clinical-Research-Network; NAFLD, nonalcoholic fatty liver disease.
aPatients with NASH were analyzed at 24 weeks’ biopsy as steatosis <5% was absent at baseline biopsy (72 cases) according to inclusion criteria in the trial. Only three
out of 63 cases analyzed at 24 weeks had no steatosis (< 5%). Because of this very small sample size, the power of the comparison is weak. For the integrated analyses, all 72 cases with baseline biopsies were included.
bThe AUROCs were highly decreased by a spectrum effect in chronic hepatitis C, as cases with minimal steatosis (1–4%) represented 732/918 (80%) of S0 as defined by
CRN score. Unfortunately, these minimal steatosis grades were not described in metabolic disease.
cThe AUROCs were increased by a spectrum effect of the control group as the blood donors had much lower steatosis test medians than controls with biopsy, increasing
the specificity. The prevalence of steatosis was not dramatically increased.
dThe AUROCs were highly affected by a dramatic increase of the prevalence of controls, despite their higher tests medians, as the prevalence of steatosis was divided by
two in comparison with the integrated population with biopsies.
eAdding the blood donor’s subset did not change significantly the AUROCs.
The performances of SteatoTest-2 were compared with the reference SteatoTest in the C1 to V4 subsets, using the noninferiority test (0.10 margin) of the difference between AUROCs predicting NAS–CRN steatosis grades 1–3 ver-sus grade 0 (no steatosis or <5% of hepatocytes). Sensitivity analyses were performed to evaluate the in flu-ence of factors of variability (inflammation grade, fibrosis stage, obesity, and fasting glucose with two cutoffs, 6.1 for insulin resistance and 7.0 for diabetes type 2).
To ensure that the prediction of the grades of steatosis was similar in all the subsets by the Steatotest-2 and the SteatoTest, the level and significance of the Lin con-cordance coefficient was assessed between the two tests.
The medians and the interquartile distribution of all tests were graphically represented according to histological scores and control subsets. The Tukey–Kramer’s test compared all pairs simultaneously with confidence inter-vals of mean differences and P values. Notched box plots were constructed using the formula: median± (1.57 × interquartile range/√n). If the notches of two boxes did not overlap, the medians were significantly different.
In patients in the selonsertib trial, liver biopsies and serum markers, including the SteatoTest, SteatoTest-2, NashTest-2, and FibroTest, were performed at baseline and at 24 weeks of treatment. The differences in paired test results at baseline and at 24 weeks of treatment were compared between patients without (nonresponders) and with (responders) a histological improvement, defined as at least one-point improvement in the NAFLD activity score. All analyses were blinded to treatment effect as set out in the protocol [15].
We assessed the influence of the definition of steatosis (presumed by the SteatoTest-2) on the prevalence of NASH, presumed by the NashTest-2 in the subsets of patients without biopsies, based on the standard CRN algorithm (steatosis≥ 5%) or the FLIP algorithm for sig-nificant activity (FLIP score A2) as previously published [3,9,16–18]. The aim, for use in large populations, was to identify a sensitive cutoff for the SteatoTest-2 for patients with at least steatosis grade S1 and to identify those cases with clinically significant NASH, that is, at least grade N2 in the CRN or the FLIP scoring system.
All statistical analyses were performed using NCSS-12.0 [23] and R [24].
Results
Characteristics of included patients
A total of 2997 patients with biopsies and histological scores were assessed by the SAF scoring system (Table 1). Although the characteristics of included patients have already been published in the original publications, the value of the present integrated database was the wide range of characteristics, making it possible to evaluate the robustness of the blood tests according to factors of variability. The interquartile range of age was between 34 and 61 years. The prevalence of histological steatosis ranged from 7.3 to 24.5%, NASH from 13.7 to 100%, cirrhosis from 0 to 42.6%, the prevalence of T2-diabetes from 7.5 to 70.8%, and obesity (BMI≥ 30) from 13.6 to 100%. The subset of obese patients was younger, with a higher percentage of women, and a lower prevalence of advancedfibrosis than the other subsets.
New SteatoTest-2
Unlike the SteatoTest, the SteatoTest-2 did not include BMI or total bilirubin but did include AST, with different inde-pendent coefficients for the remaining nine components. The values of the SteatoTest-2 in the six different subsets, from controls without risk factors to marked steatosis at biopsy, are provided in Fig. 2. Differences were all highly significant between all pairs of subsets (P< 0.001).
The clinical characteristics and grades of steatosis and NASH as well as the stages of fibrosis presumed by the blood tests in the four targeted subsets with increasing risks of steatosis are described in Table 2. As expected, the prevalence of steatosis presumed by the SteatoTest increased from 15.5% in blood donors to 84.4% in patients who underwent a FibroTest.
The AUROCs of the SteatoTest-2 were noninferior to the reference SteatoTest, which was the comparator. All non-inferiority tests were significant (P < 0.001; Table 3). Results of the AUROCs for the SteatoTest-2 and SteatoTest varied depending on the control groups and the prevalence of stea-tosis: 0.772 (95% CI: 0.713–0.820) and 0.786 (95% CI: 0.729–0.832), respectively, in the 2997 cases with biopsy (prevalence of steatosis 62%) to 0.822 (95% CI: 0.810–0.834) and 0.868 (95% CI: 0.858–0.878), respectively, in the 5776 cases including controls without risk factors of steatosis and without biopsy (prevalence of steatosis 32%; Table 3).
We evaluated the influence of the selection of controls on SteatoTest-2 AUROCs. AUROCs varied from 0.734 (95% CI: 0.715–0.751) with controls-S0-biopsy (Fig. 2a) to 0.822 (95% CI: 0.810–0.834; Fig. 2b) with controls-S0-biopsy-T1–T2. As the spectrum of cases with steatosis were always defined by biopsy (stages S1–S3), the sensi-tivity of the test did not vary. Therefore, the AUROCs were influenced by both the spectrum of the control group, which was directly related to the test specificity, and the change in the prevalence of steatosis, which varied from 32 to 62%. When controls-T1 (n= 207, median SteatoTest-2= 0.15) were added to the controls-S0-biopsy, the AUROC increased slightly from 0.734 (95% CI: 0.715–0.751) to 0.767 (95% CI: 0.750–0.782), and the prevalence of steatosis decreased from 62 to 58% (Fig. 2c). When controls-T2 (n= 2562 median SteatoTest-2 = 0.30) were added to the controls-S0-biopsy, there was both a marked increase in the AUROC 0.815 (95% CI: 0.803–0.827) as well as a marked decrease in steatosis prevalence from 62 to 34% (Fig. 2d).
The Lin coefficient was highly concordant (P <0.001), in all subsets and was between 0.74 (95% CI: 0.74–0.74) in A4 and 0.91 (95% CI: 0.89–0.93) in C1 (Supplementary File S3, Supplemental digital content 3, http://links.lww.com/EJGH/ A360).
Cutoffs for the SteatoTest-2
The upper 95% percentile (ULN) in the Steato-Test-2 was 0.40 in 177 blood donors with BMI less than 25 and fasting glucose less than 6.1. This cutoff was chosen as the ULN for ST2 to predict the presence of at least 5% of steatosis. The following cutoffs were recommended according to median values and 95% CIs: S1≥ 0.40, S2 ≥ 0.55, S3 ≥ 0.62 (Supplementary File S1, Supplemental digital content 1, http:// links.lww.com/EJGH/A358)
The sensitivity for the integrated database with biopsies using the 0.40 cutoff was 79% (95% CI: 77–85) with a 92% negative predictive value, when adjusted for the predetermined prevalence of 18%. The corresponding specificity was 50% (95% CI: 47–53) (Supplementary Table S4, Supplemental digital content 4, http://links.lww.com/EJGH/A361).
Comparison between presumed prevalences of NASH according to CRN or FLIP simplified algorithms
The prevalence of steatosis in the NAFLD subset was 84.7%. The prevalence of clinically significant NASH (moderate or severe) was 72.3% (434/600) using the CRN algorithm and 80.3% (482/600) using the FLIPA2 algorithm, which was significantly (P = 0.001) 8.0% (95% CI 3–13%) different (Supplementary Table S5A, Supplemental digital content 5, http://links.lww.com/EJGH/A362).
The prevalence of steatosis in the subset of obese patients was 65.5%. The prevalence of clinically significant NASH was 16.6% (80/481) using the CRN algorithm and 18.1% (87/481) using the FLIP-A2 algorithm, which was non-significantly 1.5% (95% CI: − 4% to 6%; P = 0.55) different (Supplementary Table S5A, Supplemental digital content 5, http://links.lww.com/EJGH/A362).
All included patients in the NASH trial subset had histological steatosis and NASH at inclusion, whatever the CRN-simplified or FLIP-simplified definition, and all had presumed steatosis by the SteatoTest-2 (Supplementary Table S5A, Supplemental digital content 5, http://links. lww.com/EJGH/A362).
The prevalence of steatosis in the blood donor subset (Supplementary Table S5B, Supplemental digital content 5, http://links.lww.com/EJGH/A362) was 15.5%. The prevalence of clinically significant NASH (moderate or severe) was 3.1% (10/322) using the CRN algorithm and 5.3% (17/322) using the FLIPA2 algorithm, which was a nonsignificant (P =0.17) 2.2% (95% CI:− 1.2 to 6.8%) difference.
The prevalence of steatosis in the subset of healthy volunteers (Supplementary Table S5B, Supplemental digi-tal content 5, http://links.lww.com/EJGH/A362) was 50.1%. The prevalence of clinically significant NASH (moderate or severe) was 22.5% (1667/7416) using the CRN algorithm and 29.9% (2220/7416) using the FLIPA2 algorithm, which was a significant (P < 0.001) 7.5% (95% CI: 6.0–8.9%) difference.
The prevalence of steatosis in the subset of patients with diabetes (Supplementary Table S5B, Supplemental digital content 5, http://links.lww.com/EJGH/A362) was 85.2%. The prevalence of clinically significant NASH (moderate or severe) was 41.8% (150/359) using the CRN algorithm and 44.6% (160/359) using the FLIPA2-algorithm, which was a nonsignificant (P = 0.45) 2.8% (95% CI: − 4.7 to 10.3%) difference.
SteatoTest-2, NashTest-2, and FibroTest improvements in the selonsertib trial
All 72 patients with NASH and stage 2 (35%) or 3 (65%) fibrosis were included. At baseline, all patients had a NAS score≥ 5 (100%). At 24 weeks, NAS improved by at least
Fig. 2.Performances [area under the receiver operating characteristic curve (AUROC)] of SteatoTest-2 according to the possible choices of controls without steatosis estimating the specificity. (a) AUROC for steatosis S1–S3 assessed using controls, with biopsy only. (b) AUROC for steatosis S1–S3 assessed using controls, also with blood donors and volunteers. (c) AUROC for steatosis S1–S3 assessed using controls, biopsy, and volunteers. (d) AUROC for steatosis S1–S3 assessed using controls, biopsy, and blood donors. (e) AUROC for steatosis S2–S3 assessed using controls, with biopsy only.
one point in 49% of patients. The SteatoTest-2 decreased by− 0.02 versus + 0.04 (P = 0.03; Fig. 3a) in patients who improved compared with those who did not, respectively, the SteatoTest by − 0.014 versus + 0.014 (P = 0.02; Fig. 3b), the NashTest-2 − 0.06 versus + 0.01 (Fig. 3c), and FibroTest− 0.02 versus + 0.02 (P = 0.04) (Fig. 3d). Despite the narrow range of NASH disease severity (only grade 2 and 3), the AUROC for predicting an improvement in NAS by NashTest-2 was 0.700 (95% CI: 0.543–0.809; P = 0.003).
Sensitivity analyses
The AUROCs of SteatoTest-2 were noninferior to the reference SteatoTest, whatever the associated in flamma-tory activity (Supplementary Table S6A, File S6, Supplemental digital content 6, http://links.lww.com/ ejgh/a363), fibrosis stage (Supplementary Table S6B, File S6, Supplemental digital content 6, http://links.lww.com/
ejgh/a363), fasting glucose level (Supplementary Table S6C, File S6, Supplemental digital content 6, http://links. lww.com/ejgh/a363, or obesity (Supplementary Table S6D, File S6, Supplemental digital content 6, http://links. lww.com/ejgh/a363). The only exception was the small subset of patients with hepatitis C without activity, in which only 11 cases had steatosis. Statistical compar-isons were not possible in two subsets because of a 98% prevalence of steatosis, that is, in obese patients with advanced fibrosis and with fasting glucose of at least 7 mmol/l.
Association with grades of CRN steatosis
Significant differences were found in all different stages of disease by histological grade with the SteatoTest-2 (Fig. 2; Supplementary File S7, Supplemental digital content 7, http:// links.lww.com/EJGH/A364). The medians were 0.40, 0.53, 0.60, and 0.64 for S0, S1, S2, and S3, respectively.
Fig. 3.Decrease of steatosis, NASH, andfibrosis biomarkers in the selonsertib trial. (a–d) SteatoTest-2 decrease by − 0.02 versus + 0.04 (P = 0.03), SteatoTest− 0.014 versus + 0.014 (P = 0.02), NashTest-2 − 0.06 versus + 0.01, and FibroTest − 0.02 versus + 0.02 (P =0.04), in patients who improved NAS versus those who did not improved at 24 weeks.
Discussion
In this study, we constructed and describe a new blood test for the diagnosis of steatosis and have validated that its results are not inferior to the reference SteatoTest, a recog-nized comparator [1]. This new test has the advantage of not including BMI or total bilirubin in its components, which are two causes of significant variability [1,6–8].
Noninferiority and concordance with the comparator
We have confirmed that Steato-test2 was noninferior to the comparator for the most frequent causes of liver steatosis, in patients with metabolic liver disease (over-weight, diabetes type 2, and dyslipidemia) as well as in those with chronic hepatitis C, with biopsies. To evaluate its specificity, we also demonstrated the noninferiority of this new test in subsets with a lower risk of steatosis, including the general population and very low risk groups such as blood donors, healthy volunteers, and hepatitis C without steatosis. Furthermore, the highly significant quantitative concordance between these two tests was confirmed in all subsets. The comparison of AUROCs demonstrated noninferiority after the major sources of variability were taken into account, in particular, the prevalences of steatosis, stages of fibrosis, grades of inflammatory activity as well as the prevalence of diabetes, obesity, and increase in fasting glucose with standard cutoffs (6.1 and 7.0 mmol/l).
Choices and effect of controls
Our study emphasized the importance of control (without steatosis) and case (with steatosis) selection in studies evaluating the AUROCs of biomarkers [2,4]. The con-struction of this new test took into account the methodo-logical limitations of previous studies, concerning sample size as well as the definitions of steatosis and controls and their effect on AUROCs.
Because of the ethical limitations of performing biopsies in healthy controls or in cases with metabolic liver disease and normal liver function tests, we used the same inclusion criteria as those used for MRS as our reference to define the presence or absence of steatosis and define the ULN in SteatoTest-2 [21]. We feel that these criteria should be recommended in guidelines to standardize the methodol-ogy when constructing steatosis biomarkers, thus pre-venting artificial disagreement.
The selection of patients with steatosis in whom biopsy is indicated on the basis of MRS or not can significantly influence the AUROCs in biomarker studies. If a study is designed with MRSfirst, then biopsy is only performed in patients with steatosis on MRS, and controls to evaluate specificity will be those patients with steatosis on MRS but not on biopsy. This is obviously rare and does not corre-spond to a frequent context of use. Thus, these studies cannot reliably assess specificity and AUROCs for stea-tosis. This strategy is also questionable to assess the value of NASH biomarkers because ballooning and lobular inflammation may be present with or without steatosis of less than 5% at biopsy. Because of these limitations, we decided to assess the specificity of steatosis biomarkers in large samples. Like the first-generation SteatoTest, we included all available biopsies from 498 patients with
chronic viral hepatitis, [6] as well as 1537 patients with no risk of steatosis as controls, using the ULN for MRS as the basis of our ULN [21].
In this study, we demonstrated the influence of the arbitrary selection of controls when evaluating steatosis noninvasive tests by AUROCs. Without changing the test sensitivity, AUROCs‘artificially’ varied from 0.734 with biopsy controls (Fig. 2a) to 0.822 (Fig. 2b) with biopsy-+ T1 biopsy-+ T2 controls. The results were influenced by both the spectrum of the control group and the change in the pre-valence of steatosis varying from 32 to 62% according to the selection of cases without steatosis. As the prevalence of steatosis varies between 20 and 50%, presumed by MRS [1,5], the performances of new biomarkers of stea-tosis must be assessed according to these sources of variability, and avoiding indirect comparison of AUROCs.
Performance for marked (grade S2) and severe (S3) CRN grades of steatosis
We also show, for the first time, that SteatoTest-2 sig-nificantly discriminates among the four stages of the CRN score [1,2]. Although the semi-quantitative correlations and significant differences among histological stages in our study are not similar to the results of MRS, which has a better correlation with percentages of hepatocyte steatosis than any blood test [1,20,21], our aim was to validate a robust test without the practical limitations of MRS. Although the main value of SteatoTest-2 is its sensitivity and associated high negative predictive value (92%) for the diagnosis of steatosis of at least 5%, there was also a significant correlation between test values and histological grades of steatosis. Furthermore, the clinical value of the AUROC (0.603; 95% CI: 0.577–0.229; P < 0.001 vs. random) for the diagnosis of S2S3 versus S1 is limited. Indeed, this AUROC was assessed in a narrow range of steatosis spectrum, without S0 controls, or controls with no risk of steatosis (Fig. 2e).
Validation in NASH paired biopsies
We have demonstrated for thefirst time in a phase-2 trial of selonsertib that the changes in the three noninvasive tests, SteatoTest-2, NashTest-2 and FibroTest, can reliably predict improvement in the NAS score in patients with NASH (Fig. 3). This confirmed that the paired SteatoTest-2 detected an improvement in steatosis in patients with moderate and severe grades of steatosis, which was also observed in biopsies and MRS.
Our study has several limitations, including its retro-spective design and the absence of a large subset of cases with MRS as a quantitative reference for liver triglyceride content. Prospective external and independent validations with MRS are needed. However, despite the retrospective design, the SteatoTest-2 was clearly noninferior to and highly concordant with the reference SteatoTest that has been extensively used and validated by guidelines for the diagnostic of steatosis.
Conclusion
The new multianalyte SteatoTest-2 simplifies, and was found to be noninferior to, the reference SteatoTest for the diag-nosis of steatosis, without the variability induced by BMI and the risk of false positives related to unconjugated bilirubin.
Acknowledgements
The research leading to these results has received funding from the European Community’s Seventh Framework Program (FP7/2007–2013) under grant agreement HEALTH-F2–2009–241762 for the project FLIP.
Valentina Peta, Olivier Deckmyn, Mona Munteanu, Yen Ngo, An Ngo, and Fabienne Drane are full-time employees of BioPredictive.
Author contributions: T.P. was involved in study con-cept and design, analysis and interpretation of data, sta-tistical analysis, drafting, and study supervision. M.M., Y.N., and O.D. were involved in acquisition of data, analysis and interpretation of data, statistical analysis, drafting, and critical revision of the manuscript. Q.A., F.C., R.L., and V.R. were involved in acquisition of data, drafting, and critical revision of the manuscript. G.M., E.B., M.T., M.R.G., C.O., C.D., J.F.D., S.B., and P.B. were involved in acquisition of data and drafting.
All authors approved thefinal version of the manuscript. Co-authors members of the FLIP Consortium, the FibroFrance Group, and the Selonsertib group are listed in Supplementary File 1 (Supplemental digital content 1, http://links.lww.com/EJGH/A358).
Conflicts of interest
Thierry Poynard is the guarantor of the article. Thierry Poynard is the inventor of SteatoTest-2 and SteatoTest, founder of BioPredictive. The patents belong to the public organization Assistance Publique Hôpitaux de Paris. Valentina Peta, Olivier Deckmyn, Mona Munteanu, Yen Ngo, and An Ngo are full-time employees of BioPredictive. Rob Myers is full-time employee of Gilead Science. For the remaining authors, there are no conflicts of interest.
References
1 European Association for the Study of the Liver (EASL); European Association for the Study of Diabetes (EASD); European Association for the Study of Obesity (EASO). EASL-EASD-EASO Clinical Practice Guidelines for the management of non-alcoholic fatty liver disease. J Hepatol 2016; 64:1388–1402.
2 Fedchuk L, Nascimbeni F, Pais R, Charlotte F, Housset C, Ratziu V, et al. Performance and limitations of steatosis biomarkers in patients with nonalcoholic fatty liver disease. Aliment Pharmacol Ther 2014; 40:1209–1222.
3 Poynard T, Munteanu M, Charlotte F, Perazzo H, Ngo Y, Deckmyn O, et al. Impact of steatosis and inflammation definitions on the perfor-mance of NASH tests. Eur J Gastroenterol Hepatol 2018; 30:384–391. 4 Poynard T, Munteanu M, Charlotte F, Perazzo H, Ngo Y, Deckmyn O, et al. Diagnostic performance of a new noninvasive test for nonalcoholic steatohepatitis using a simplified histological reference. Eur J Gastroenterol Hepatol 2018; 30:569–577.
5 Kotronen A, Peltonen M, Hakkarainen A, Sevastianova K, Bergholm R, Johansson LM, et al. Prediction of non-alcoholic fatty liver disease and liver fat using metabolic and genetic factors. Gastroenterology 2009; 137:865–872.
6 Poynard T, Ratziu V, Naveau S, Thabut D, Charlotte F, Messous D, et al. The diagnostic value of biomarkers (SteatoTest) for the prediction of liver steatosis. Comp Hepatol 2005; 4:10.
7 Butler R, McClinchy J, Morreale-Parker C, Marsh W, Rennie KL. BMI calculation in older people: the effect of using direct and surrogate measures of height in a community-based setting. Clin Nutr ESPEN 2017; 22:112–115.
8 Sorkin JD, Muller DC, Andres R. Longitudinal change in height of men and women: implications for interpretation of the body mass index: the Baltimore Longitudinal Study of Aging. Am J Epidemiol 1999; 150:969–977. 9 Poynard T, Munteanu M, Deckmyn O, Ngo Y, Drane F, Messous D,
et al. Applicability and precautions of use of liver injury biomarker FibroTest. A reappraisal at 7 years of age. BMC Gastroenterol 2011; 11:39.
10 Bedossa P, Poitou C, Veyrie N, Bouillot JL, Basdevant A, Paradis V, et al. Histopathological algorithm and scoring system for evaluation of liver lesions in morbidly obese patients. Hepatology 2012; 56:1751–1759.
11 Bedossa P. FLIP Pathology Consortium. Utility and appropriateness of the fatty liver inhibition of progression (FLIP) algorithm and steatosis, activity, andfibrosis (SAF) score in the evaluation of biopsies of non-alcoholic fatty liver disease. Hepatology 2014; 60:565–575.
12 Kleiner DE, Brunt EM, van Natta M, Behling C, Contos MJ, Cummings OW, et al. Design and validation of a histological scoring system for nonalcoholic fatty liver disease. Hepatology 2005; 41:1313–1321.
13 Munteanu M, Tiniakos D, Anstee Q, Charlotte F, Marchesini G, Bugianesi E, et al. Diagnostic performance of FibroTest, SteatoTest and ActiTest in patients with NAFLD using the SAF score as histological reference. Aliment Pharmacol Ther 2016; 44:877–889.
14 Poynard T, Lassailly G, Diaz E, Clement K, Caïazzo R, Tordjman J, et al. Performance of biomarkers FibroTest, ActiTest, SteatoTest, and NashTest in patients with severe obesity: meta analysis of individual patient data. PLoS One 2012; 7:30325.
15 Loomba R, Lawitz E, Mantry PS, Jayakumar S, Caldwell SH, Arnold H, et al. The ASK1 inhibitor selonsertib in patients with nonalcoholic steatohepatitis: a randomized, phase 2 trial. Hepatology 2017. [Epub ahead of print].
16 Poynard T, Munteanu M, Colombo M, Bruix J, Schiff E, Terg R, et al. FibroTest is an independent predictor of virologic response in chronic hepatitis C patients retreated with pegylated interferon alfa-2b and ribavirin in the EPIC program. J Hepatol 2011; 54:227–235.
17 Jacqueminet S, Lebray P, Morra R, Munteanu M, Devers L, Messous D, et al. Screening for liverfibrosis by using a noninvasive biomarker in patients with diabetes. Clin Gastroenterol Hepatol 2008; 6:828–831. 18 Poynard T, Lebray P, Ingiliz P, Varaut A, Varsat B, Ngo Y, et al.
Prevalence of liverfibrosis and risk factors in a general population using non-invasive biomarkers (FibroTest). BMC Gastroenterol 2010; 10:40. 19 Boursier J, de Ledinghen V, Poynard T, Guéchot J, Carrat F, Leroy V,
et al. An extension of STARD statements for reporting diagnostic accuracy studies on liver fibrosis tests: the Liver-FibroSTARD stan-dards. J Hepatol 2015; 62:807–815.
20 Doycheva I, Cui J, Nguyen P, Costa EA, Hooker J, Hofflich H, et al. Non-invasive screening of diabetics in primary care for NAFLD and advanced fibrosis by MRI and MRE. Aliment Pharmacol Ther 2016; 43:83–95. 21 Szczepaniak LS, Nurenberg P, Leonard D, Browning JD, Reingold JS,
Grundy S, et al. Magnetic resonance spectroscopy to measure hepatic triglyceride content: prevalence of hepatic steatosis in the general population. Am J Physiol Endocrinol Metab 2005; 288:462–468. 22 Vernon G, Baranova A, Younossi ZM. Systematic review: the
epide-miology and natural history of alcoholic fatty liver disease and non-alcoholic steatohepatitis in adults. Aliment Pharmacol Ther 2011; 34:274–285.
23 Hintze JL. NCSS 2011 user guide. Kaysville, UT: Number Cruncher Statistical Systems Software (NCSS); 2011.
24 R Core Team. R: A language and environment for statistical computing. Vienna: R Foundation for Statistical Computing; 2015.


![Fig. 2. Performances [area under the receiver operating characteristic curve (AUROC)] of SteatoTest-2 according to the possible choices of controls without steatosis estimating the speci fi city](https://thumb-eu.123doks.com/thumbv2/123doknet/14460786.520405/8.880.80.821.92.551/performances-receiver-operating-characteristic-steatotest-according-steatosis-estimating.webp)

