HAL Id: hal-01481057
https://hal-amu.archives-ouvertes.fr/hal-01481057
Submitted on 2 Mar 2017
HAL is a multi-disciplinary open access
archive for the deposit and dissemination of
sci-entific research documents, whether they are
pub-lished or not. The documents may come from
teaching and research institutions in France or
abroad, or from public or private research centers.
L’archive ouverte pluridisciplinaire HAL, est
destinée au dépôt et à la diffusion de documents
scientifiques de niveau recherche, publiés ou non,
émanant des établissements d’enseignement et de
recherche français ou étrangers, des laboratoires
publics ou privés.
in dyslexia
Laurence Casini, Catherine Pech-Georgel, Johannes C Ziegler
To cite this version:
Laurence Casini, Catherine Pech-Georgel, Johannes C Ziegler. It’s about time: revisiting
tempo-ral processing deficits in dyslexia. Developmental Science, Wiley, 2017, �10.1111/desc.12530�.
�hal-01481057�
Developmental Science. 2017;e12530. wileyonlinelibrary.com/journal/desc
|
1 of 14https://doi.org/10.1111/desc.12530 © 2017 John Wiley & Sons Ltd
P A P E R
It’s about time: revisiting temporal processing deficits in
dyslexia
Laurence Casini
1,2| Catherine Pech-Georgel
3| Johannes C. Ziegler
4,5,21Aix Marseille Univ, CNRS, LNC, Laboratoire de Neurosciences Cognitives, Marseille, France 2Aix Marseille Univ, CNRS, FR 3C, Marseille, France 3Centre de Références des Troubles d’Apprentissages, Institut du Développement de l’Enfant et de sa Communication (IDEC), Hôpital Salvator, Marseille, France 4Aix Marseille Univ, CNRS, LPC, Laboratoire de Psychologie Cognitive, Marseille, France 5 Brain and Language Research Institute, Aix-Marseille University, Marseille, France Correspondence Laurence Casini, LNC, Pole 3C, Case C, 3 place Victor Hugo, 13331 Marseille cedex 3, France. Email: [email protected]
Abstract
Temporal processing in French children with dyslexia was evaluated in three tasks: a word identification task requiring implicit temporal processing, and two explicit tem- poral bisection tasks, one in the auditory and one in the visual modality. Normally de-veloping children matched on chronological age and reading level served as a control group. Children with dyslexia exhibited robust deficits in temporal tasks whether they were explicit or implicit and whether they involved the auditory or the visual modality. First, they presented larger perceptual variability when performing temporal tasks, whereas they showed no such difficulties when performing the same task on a non- temporal dimension (intensity). This dissociation suggests that their difficulties were specific to temporal processing and could not be attributed to lapses of attention, re-duced alertness, faulty anchoring, or overall noisy processing. In the framework of cognitive models of time perception, these data point to a dysfunction of the ‘internal clock’ of dyslexic children. These results are broadly compatible with the recent tem-poral sampling theory of dyslexia.RESEARCH HIGHLIGHTS
• The first study to link temporal processing deficits in dyslexia with psychophysical methods and models of time perception. • Children with dyslexia have deficits in explicit and implicit estima-tion of time in both the visual and the auditory domain. • One of the rare studies to show that a low-level temporal deficit ‘survives’ the comparison with reading-level controls. • Children with dyslexia are impaired in temporal bisection but not in intensity bisection tasks. • Temporal deficits are not caused by lapses of attention or by faulty anchoring.1 | INTRODUCTION
Developmental dyslexia is characterized as a specific disability in learning to read fluently despite normal intelligence, adequate instruc-tion and appropriate socio- cultural opportunities, and in the absence of sensory deficiencies in vision or hearing (American Psychiatric
Association, 1994). The prevailing view concerning the cause of dys-lexia points to phonological processing problems (Goswami, 2015; Ramus et al., 2003; Snowling, 2001). Phonological processing includes various abilities, such as phonological awareness, phonological decod-ing and phonological memory. However, it is still unclear whether these phonological processing deficits are the primary cause of dys-lexia or whether they are secondary to impairments in the processing of basic acoustic parameters of the speech signal (Ahissar, Protopapas, Reid, & Merzenich, 2000; Lachmann, Berti, Kujala, & Schröger, 2005; Richardson, Thomson, Scott, & Goswami, 2004; Ziegler, Pech- Georgel, George, & Lorenzi, 2009). According to one of the most influential theories, Tallal’s rapid
tem-poral processing deficit hypothesis (Tallal, 1980), phonological deficits
in dyslexia would be secondary to low- level auditory temporal pro-cessing impairments. Children with dyslexia would have difficulties in perceiving auditory stimuli that have short duration and occur in rapid succession. Such a deficit at the basic auditory level would lead to an inability to integrate sensory information delivered in rapid succession and thus would prevent a correct temporal analysis of speech at the phoneme level, which consequently results in abnormal phonological
development (Tallal, Miller, & Fitch, 1993). Indeed, impoverished pho-neme representations or poor phoneme discrimination are detrimental for learning- to- read because the precise mapping of letters onto pho-nemes is at the heart of reading acquisition during the initial phases of reading development (Ziegler et al., 2014). Several behavioral studies using speech or non- speech stimuli have supported this hypothesis by showing deficits in rapid auditory tempo-ral processing in dyslexic children and adults (Cohen- Mimran & Sapir, 2007; Fostick, Bar- El, & Ram- Tsur, 2012; Fostick, Eshcoli, Shtibelman, Nechemya, & Levi, 2014; Habib, 2000; Rey, De Martino, Espesser, & Habib, 2002; for a review see Farmer & Klein, 1995). In particular, Vandermosten and colleagues (2010, 2011) showed that children and adults with dyslexia were specifically impaired at categorizing speech and non- speech sounds that differed in terms of rapidly changing acous-tic cues (i.e. temporal cues) but not when categorizing steady- state speech and non- speech sounds. However, there are also studies that failed to show relationships between temporal auditory processing abil-ity and phonological deficits (Breier, Fletcher, Foorman, Klaas, & Gray, 2003; Bretherton & Holmes, 2003; Share, Jorm, MacLean, & Matthews, 2002). Some of Tallal’s original findings have been criticized because errors in temporal- order judgments of syllables and tones might reflect the difficulty in identifying similar (and therefore confusable) syllables or tones rapidly rather than a general deficit in the rate of auditory percep-tion (for a review, see Studdert- Kennedy & Mody, 1995). A recent theory of dyslexia, the temporal sampling theory, has put temporal processing back in the center of attention (Goswami, 2011). The theory is based on the assumption that phonological coding of speech relies on the ‘sampling’ of the speech stream by auditory corti- cal networks operating at different time scales or oscillatory frequen-cies (Giraud & Poeppel, 2012). The theory assumes that deficits in temporal sampling and inefficient phase locking at one or more tem- poral rates could explain abnormal phonological development in chil-dren with dyslexia across languages (Goswami et al., 2002; Goswami, Fosker, Huss, Mead, & Szucs, 2011; Goswami, Gerson, & Astruc, 2010). Moreover, building on the magnocellular- dorsal (M- D) theory, which attributes dyslexia to impairments in the M- D pathway that is sensitive to rapidly changing information (Facoetti, 2012; Livingstone, Rosen, Drislane, & Galaburda; Stein & Walsh, 1997), some authors suggested that temporal sampling deficits could extend to the visual modality (Facoetti, Corradi, Ruffino, Gori, & Zorzi 2010; Gori, Cecchini, Bigoni, Molteni, & Facoetti, 2014; Gori & Facoetti, 2015). In the present study, we used the theoretical and methodological tools of time perception to revisit the claim that developmental dys-lexia is related to a domain- general temporal processing deficit that can be found for both speech and non- speech stimuli and in both the auditory and the visual domain. It is actually surprising that research on temporal processing deficits in dyslexia has remained discon-nected from cognitive theories and experiments on time perception. Most of the models that have been proposed to explain performance on temporal tasks (e.g. Allan & Gibbon, 1991; Ferrara, Lejeune, & Wearden, 1997; Wearden, 1991) are based on scalar timing theory (Gibbon, 1977; Gibbon, Church, & Meck, 1984). Scalar timing the-ory proposes that the raw material for time judgments comes from
a pacemaker- accumulator internal clock. However, the models also involve memory and comparison processes. According to this the-ory, people are supposed to estimate time intervals using an internal clock consisting of three components: (1) a clock stage composed of a pacemaker- counter device, (2) a memory stage, and (3) a decision- comparison stage (Gibbon, 1977; Gibbon et al., 1984). An interval is specified by the accumulation of pulses emitted at a regular rate from a pacemaker. The more pulses that are accumulated, the longer the sub-jective estimation of duration. In the present research, we used this well- established theoretical framework to shed new light on temporal processing deficits in dyslexia. Temporal processing was evaluated in three tasks that involved explicit and implicit temporal processing both in the auditory and in the visual modality (see Figure 1).
The explicit timing task was a temporal bisection task (adminis-tered in both the auditory and the visual modalities), in which par-ticipants were initially trained to discriminate between a short- and a long- duration signal (i.e. the anchor durations). Subsequently, they classified probe signals as short or long, relative to the anchor dura-tions experienced in training. Some of these probe signals were the same as the anchor durations, but most were of intermediate dura-tion. The implicit timing task was a speech perception task, in which participants were presented with two words, ‘cache’ (/ka∫/) or ‘cage’ (/kaʒ/), for which the final consonant was replaced by a white noise, creating minimal pairs that differed only with respect to vowel length (‘cache’ has a short /a/, while ‘cage’ has a long /a/). The length of the vowel was then parametrically varied and people were asked to decide whether they heard ‘cache’ or ‘cage’. Previous studies indeed showed that adults more often perceived ‘cache’ for short /a/ durations and ‘cage’ for long /a/ durations (Casini, Burle, & Nguyen, 2009; Casini, Ramdani- Beauvir, Burle, & Vidal, 2013).
Whereas most of the studies investigating the link between timing and dyslexia used tasks that do not directly assess temporal processing, here we used a temporal bisection task, which presents three advantages. First, it allows us to assess temporal processing directly. Second, it allows us to hold constant memory, decision and comparison processes across the different conditions (speech versus
F I G U R E 1 Illustration of the three tasks performed in Experiment
1: the word identification task, the visual temporal bisection task, and the auditory temporal bisection task
/ka∫/
/ka /
short
long
/ka
/
non- speech) and modalities (visual versus auditory). Third, it allows us to analyze classic psychophysical variables that can be interpreted in the context of the pacemaker- counter clock model. In the classic temporal bisection or categorical speech perception task, two dependent variables can be analyzed and provide different but complementary information. First, the difference limen (DL) is a measure of the ‘slope’ of the participants’ response function when plotted. It can be interpreted as a measure of participants’ precision in their judgment, because steep slopes are indicative of a precise judgment, whereas shallow slopes indicate greater variability in the judgment (Wearden, 1991; Wearden & Ferrara, 1995). In the frame-work of the pacemaker- counter clock model, increased variability in the temporal bisection procedure suggests a problem at the level of the pacemaker- counter device (Droit- Volet, 2003). Hypothetically, in-creased variability could be indicative of a deficit in temporal sampling (noisy oscillators, inefficient phase locking). Second, the point of sub-jective equality (PSE) is the signal duration at which a participant is equally likely to classify the signal as short or long. It quantifies a shift of the psychophysical function, which makes it possible to estimate whether the participants presented a bias in their temporal judgments towards either an underestimation or an overestimation of durations (Wearden, 1991; Wearden & Ferrara, 1995). In the framework of the pacemaker- counter clock model, time overestimation may indicate systematic distortions of the anchor durations stored in reference memory (Droit- Volet & Wearden, 2001; Wearden, 1991).
In sum, in Experiment 1, children with developmental dyslexia were tested on two explicit and one implicit temporal processing
tasks, along with a large battery of phonological and reading measures. The explicit temporal processing tasks were administered both in the visual and in the auditory modality. The performance of the children with dyslexia was compared with that of both reading age (RA) and chronological age (CA) matched controls. The comparison with RA controls is crucial as it rules out that potential deficits in temporal pro-cessing are simply the consequence of a lack of reading experience (Goswami, 2015).
According to the hypothesis of a domain- general temporal pro-cessing deficit at the origin of the phonological deficit in dyslexia, it is expected that children with dyslexia should be impaired in the three temporal tasks (Experiment 1). A second experiment was conducted to investigate whether attentional load would affect performance in both a temporal and a non- temporal bisection task (intensity discrim-ination). This was done to investigate the hypothesis that temporal processing is particularly affected in children with dyslexia in highly attention- demanding situations, such as speech perception.
2 | EXPERIMENT 1
2.1 | Methods
2.1.1 | Participants
The main characteristics of the sample are provided in Table 1. Fifty- five children (all mono- lingual French native speakers) par-ticipated in this study. Nineteen dyslexic children were recruited
T A B L E 1 Experiment 1. Characteristics of dyslexics, chronological- age controls (CA controls) and reading-level age controls (RA controls).
Representation of p- values: * = p < .05, ** = p < .01, *** = p < .001, ns = non- significant. Standard deviation in ()
Dyslexics CA controls RA controls
Dys/CA (t, p- value) Dys/RA (t, p- value) Number 19 18 18 Age 10.3 (0.8) 10.4 (0.7) 7.8 (0.5) 0.31, ns 10.3, *** Reading age 7.6 (0.8) 9.6 (0.3) 8.2 (0.8) 9.03, *** 0.79, ns Non- verbal IQ 99.2 (12.1) 105 (19.1) 106.7 (11.2) 1.11, ns 1.73, ns Reading tests One- minute- reading 49.6 (21.4) 82.1 (14.2) 61.9 (12.8) 5.39, *** 1.88, p < .10 Regular words (/10) 9.6 (0.7) 10 (0) 2.58, ** Irregular words (/10) 7.4 (2.6) 9.8 (0.4) 4.03, *** Nonwords (/20) 14.9 (4) 19.8 (0.5) 5.01, *** Phonology assessment Syllable deletion (time in s) 45.6 (12.8) 29.1 (6.4) 49.1 (23.1) 4.95, *** 0.65, ns Syllable deletion (errors) 1.1 (1.7) 0.2 (1) 0.2 (0.8) 1.91, * 1.96, * Phoneme deletion CVC (time in s) 46.8 (23.1) 27.9 (5.6) 36.3 (11.4) 3.37, ** 1.31, ns Phoneme deletion CVC (errors) 1.2 (2.2) 0.1 (0.3) 0 (0) 1.93, * 2.06, * Phoneme deletion CCV (time in s) 54.6 (15.1) 37.1 (6.7) 66.1 (31.7) 4.33, *** 1.5, ns Phoneme deletion CCV (errors) 4.1 (2.3) 1 (1.1) 1.8 (1.6) 4.62, *** 3.18, ** Memory tests Forward digit span 2.7 (1.4) 3.5 (0.8) 3.5 (0.9) 2.02, * 1.9, p < .10 Backward digit span 2.1 (0.9) 3.1 (1.2) 2.11 (0.8) 2.87, ** 0.02, ns
from one of the national assessment centers for dyslexia (Centre de Référence pour les Troubles des Apprentissage), in Marseille, France. They were formally diagnosed by an interdisciplinary team of speech therapists, psychologists and neuro- pediatricians. To qualify for the study, the children had to be between 9 and 11 years old1 , attain a partial nonverbal IQ above 80 on the basis of two
subtests (concept identification and matrices) from the French Wechsler Intelligence Scale for Children (WISC- IV), and have a reading age at least 18 months below the age norm on a standard-ized reading test (Alouette-R, Lefavrais, 2005). This is the standard criterion used by the national assessment centers in France on the Alouette reading test, which is one of the most commonly used tests in France (Bertrand, Fluss, Billard, & Ziegler, 2010). A reading delay of 18 months corresponds to approximately 2 SDs. Note, however, that all children with dyslexia had been formally diagnosed using a large battery of reading tests. Thus, the Alouette reading test was not the only diagnostic reading test, but it allowed us to assess the reading level just before the experiment. Children with dyslexia were excluded from the study if they had any diagnosed neurologi-cal or sensory deficits.
Two control groups were selected from nearby schools. The first group of 18 children was matched on chronological age (CA controls), and the second group of 18 children was matched on reading age (RA controls), as calculated on the basis of the same standardized reading test (Alouette-R, Lefavrais, 2005) described above. All con-trols had normal IQ (>80), no history of written or spoken language impairment, and their reading age was in the normal range (they were excluded if their reading age was 6 months below their chronological age). They were all French native speakers. The study was conducted with the understanding and consent of the participants and their parents.
2.1.2 | General procedure
Children performed the whole experiment in two sessions: one consisted of the neuropsychological and reading assessments, and the other was devoted to the psychophysical tasks, namely a word identification task (corresponding to an implicit temporal task), an auditory temporal bisection task, and a visual temporal bisection task (Figure 1). For the psychophysical tasks, the participants were seated in a quiet room. They faced a black panel (situated at a dis-tance of 1 m) containing one light- emitting diode (LED) serving as stimulus in the visual task. Auditory stimuli were delivered through headphones (white noise for the auditory task and phonetic stimuli for the linguistic task). The intensity of the stimuli was adapted to each child and corresponded to a comfortable level of hearing at about 73 dB. Two response keys were available, one for each hand (index fingers were used). The experiment was controlled by a mi-crocomputer running t- scope (Stevens, Lammertyn, Verbruggen, & Vandierendonk, 2006).
The order of auditory and visual bisection tasks was counterbanced across participants, but the word identification task was al-ways performed first to ensure that participants did not focus on the duration of the vowel. Each session lasted about 15 minutes, and ses-sions were separated by a break of 10 minutes.
2.1.3 | Neuropsychological tests
Additional reading tests Reading speed and accuracy were further assessed with the French version of the one- minute- reading test (Lecture en Une Minute, LUM, Khomsi, 1999), which requires the child to read out loud as many words as possible in one minute. The dependent variable was cor-rectly read words per minute. The reading performance of children with dyslexia and CA controls was further assessed with a list of reg-ular and irregwith dyslexia and CA controls was further assessed with a list of reg-ular words and non- words taken from the L2MA test (Chevrie- Muller, Simon, Fournier, & Brochet, 1997). The three lists were composed of 10 regular and 10 irregular words and 20 non- words. The child was asked to read out loud each list. The dependent variable was correctly read words.Phonological awareness
Phonological awareness skills were tested with a computerized test (Sprenger- Charolles, Colé, Bechennec, & Kipffer- Piquard, 2005), in which children were presented with the stimuli through headphones and gave their responses orally. In the syllable dele-tion task, they were presented with 10 tri- syllabic pseudo- words through headphones and asked to suppress the first syllable. In the phoneme deletion task, they were presented with 24 triphonemic pseudo- words, 12 with a CVC structure and 12 with a CCV struc-ture, and asked to suppress the first phoneme. The number of errors and the overall time to perform each series of pseudo- words were recorded. Short- term memory We used forward and backward digit span. In the forward span task, the child had to repeat a sequence of numbers spoken aloud by the experimenter. In the backward span task, the child had to repeat a se-quence of numbers in reversed order. In both tasks, the length of each sequence increased as the child responded correctly.
2.1.4 | Word identification task
The auditory stimuli were synthesized using the HLSyn speech syn- thesis system (Sensimetrics). The HLSyn control parameters were de-rived from the word cache /ka∫/ recorded beforehand by a French male speaker and submitted to a detailed acoustic analysis. A series of five stimuli was generated from this synthetic sequence. Each stimu-lus contained the sequence /ka/ immediately followed by white noise that replaced the final consonant (/∫/ or /ʒ/). Vowel durations varied from 150 to 430 ms in 70- ms steps. For more linguistic and acoustic details, see Casini et al. (2009). The words ‘cache’ [hide] and ‘cage’ [cage] both have a low lexical frequency in French (3.88 and 16.61 per million, respectively) according to the Lexique 3 French lexical database (see New, Pallier, Brysbaert, & Ferrand, 2004). The numbers of CVC phonological neighbors ending
in the same rhyme are almost identical for the two words according to the Vocolex database (cache: 9, cage: 7, see Dufour, Peereman, Pallier, & Radeau, 2002). Auditory stimuli were delivered to children through headphones, and children were required to indicate whether the presented stim-uli corresponded to the beginning of the word cache (/ka∫/, voiceless final consonant) or cage (/kaʒ/, voiced consonant) by pressing the ap-propriate response key with the left or right index finger, depending on the word. The correspondence between the finger used and the response provided (cache versus cage) was counterbalanced between participants. The experimental block contained 50 trials correspond-ing to five different auditory stimuli, each delivered 10 times (inter- trial interval = 1.5 s).
In the training session, children were required to listen to male speakers pronouncing alternatively the words « cache » and « cage ». Then, they performed the word identification task with each of only two stimuli corresponding to the shortest and the longest /a/ dura- tion. Ten stimuli (five with short /a/ and five with long /a/) were ran-domly presented. If the performance was 70% or below, participants performed the training session again.
2.1.5 | Auditory and visual temporal bisection tasks
In the training phase, participants learned to distinguish the anchor durations (auditory modality: 150 and 430 ms; visual modality: 300 and 900 ms). Different duration ranges were used in each modality because their respective temporal thresholds are known to be differ-ent (Lhamond & Goldstone, 1974). The training phase consisted of two parts. First, participants were presented with the two standard durations, each presented five times in alternation. In the auditory modality, a white noise was delivered through headphones, and in the visual modality a red diode was on. Participants were instructed just to listen to or to look at the stimuli with no response required. The stimuli were described for the participants by the experimenter, who indicated in French whether a stimulus was ‘short’ or ‘long’ in tandem with its presentation. Next, the two anchor durations were randomly presented 10 times, and subjects indicated whether the stimulus presented was short or long by pressing the appropriate response key, using either the right or left index finger. The associa-tion between the response (short or long) and the hand used (right or left) was counterbalanced between participants. Feedback was not given after each response, as in the test phase. If the perfor- mance was 70% or below, participants performed the training ses-sion again. In the test phase, in the auditory modality, white noise could be of five different durations (150, 220, 290, 360, 430 ms), and, in the visual modality, the red diode was on for five different durations (300, 450, 600, 750, 900 ms). Participants were required to indicate whether the presented stimuli were short or long by pressing the appropriate re-sponse key. Feedback was not given after each trial. Each session contained two blocks (one in each modality) of 50 trials corresponding to five stimuli (= 5 durations), each delivered 10 times (inter- trial interval = 2 s).
2.2 | Results
The classification data obtained in the word identification task (cache versus cage) and the two temporal bisection tasks can be quantified as the proportion of long (or cage) responses the participant made at each signal duration, and these data can be fitted by a sigmoidal function for each participant. This function allowed us to estimate the two dependent variables: the DL and the PSE. The DL is a meas-ure of the slope of the participants’ response function when plotted. It is calculated by subtracting the duration the participant classifies as long 25% of the time from the duration the participant classifies as long 75% of the time and dividing by two. It can be interpreted as a measure of participants’ precision. The PSE is the signal duration at which a participant is equally likely to classify the signal as short or long. It represents the subjective midpoint between the short and long anchor values. An increase in the PSE (a rightward shift of the curve) means that participants chose more often to respond ‘short’ (or ‘cache’) and thus underestimated durations; conversely, a decrease in the PSE (a leftward shift of the curve) means that par- ticipants were biased to respond ‘long’ (or ‘cage’) and thus overesti-mated durations. Some participants were not able to perform one or more of the three tasks. Six children with dyslexia, seven RA controls and one CA control were not able to perform the word identification task; one dys-lexic and two RA controls were not able to perform the auditory task; and one dyslexic, three RA controls and one CA control failed to do the visual task. These participants obtained a percentage of long (or cage) responses close to 50% whatever the duration of the stimuli, prevent-ing the estimation of the two variables, DL and PSE. For each task, a one- way ANOVA was performed on DL and PSE indices, and then Newman–Keuls tests were carried out for pairwise comparisons. Homogeneity of variance was tested for each dependent variable and each task using the nonparametric version of Levene’s test of equality of error variances. The error variances between groups were not statistically different in any of the three tasks.2.2.1 | Word identification task
As illustrated in Figure 2a, which shows the DL indices for the three groups, there was a significant effect of the factor Group [F(2, 38) = 4.65,
p = .01]. More specifically, the mean DL was larger for children with
dyslexia than for CA controls (107 ms versus 68 ms, p = .03, effect size: Cohen’s d = .61) and RA controls (107 ms versus 53.5 ms, p = .01, effect size: Cohen’s d = .89). This suggests that children with dyslexia were in- deed more variable in their judgments and had more difficulty in discrim-inating between the short (‘cache’) and long (‘cage’) vowel durations. Concerning the mean PSE, there was also a main effect of Group [F(2, 38) = 3.09, p = .05]. As illustrated in Figure 2b, the PSE tended to be larger for the dyslexic group in comparison with the CA group (305 ms versus 274 ms, p = .07, effect size: Cohen’s d = .57), but there was no significant difference between dyslexic children and RA controls (305 ms versus 296 ms, p = .50, effect size: Cohen’s
underestimated the duration of the /a/, which led to a greater number of ‘cache’ responses as compared with CA controls.
2.2.2 | Auditory temporal bisection task
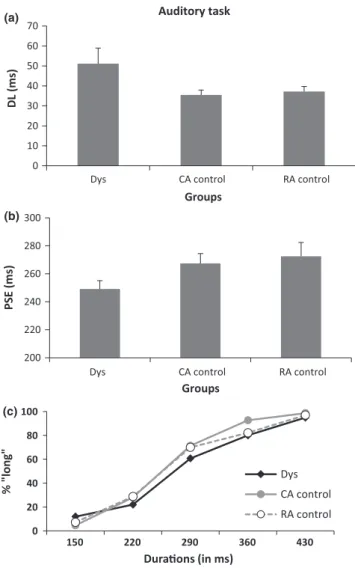
In the auditory temporal bisection task, the factor Group was signifi-cant for DL [F(2, 49) = 3.07, p = .05] but just failed to reach signifi-cance for PSE [F(2, 49) = 2.92, p = .06]. As illustrated in Figure 3a, the mean DL was larger for dyslexic children than for CA controls (51 ms versus 35 ms, p = .05, effect size: Cohen’s d = .59) and tended to be larger than for RA controls (51 ms versus 37 ms, p = .07; ef-fect size: Cohen’s d = .52), suggesting that dyslexic children had more difficulty in discriminating between the short and long stimuli
compared with control children. The mean PSE tended to be inferior for the dyslexic group (249 ms) in comparison with the two control groups (CA controls: 267 ms, p = .07, effect size: Cohen’s d = .51; RA controls: 273 ms, p = .06, effect size: Cohen’s d = .58.). This indicates that dyslexic children tended to overestimate intermediate durations (Figure 3b).
2.2.3 | Visual temporal bisection task
In the visual modality, there were significant group differences on the DL [F(2, 47) = 3.35, p = .03] but not on the PSE [F(2, 47) = .29, p = .74]. Figure 4a shows an increase in mean DL for dyslexic children (130 ms) compared with both control groups (CA controls: 130 ms versus 96 ms, p = .03, effect size: Cohen’s d = .65; RA controls: 130 ms versus 95 ms, p = .06; effect size: Cohen’s d = .64), again suggesting that children with F I G U R E 2 Experiment 1. Word identification task. (a) Mean difference limen (DL in ms) for the three groups (Dys = Dyslexics, CA control = controls matched with chronological age, RA control = controls matched with reading- level age). (b) Mean point of subjective equality (PSE in ms) in the three groups. An increase in PSE means that dyslexics more often perceived /ka∫/ and thus underestimated durations. Error bars are standard of the means. (c) Mean proportion of ‘cage’ responses plotted against stimulus duration for the three groups of children
Word identification task
0 20 40 60 80 100 120 140
Dys CA control RA control
DL (ms) Groups 200 220 240 260 280 300 320 340
Dys CA control RA control
PSE (ms) Groups 0 20 40 60 80 100 150 220 290 360 430 % "cag e" Durations (in ms) Dys CA control RA control (a) (b) (c) F I G U R E 3 Experiment 1. Auditory temporal task. (a) Mean difference limen (DL in ms) for the three groups (Dys = Dyslexics, CA control = controls matched with chronological age, RA control = controls matched with reading- level age). (b) Mean point of subjective equality (PSE in ms) in the three groups. A decrease in PSE means that dyslexics overestimated durations. Error bars are standard of the means. (c) Mean proportion of ‘long’ responses plotted against stimulus duration for the three groups of children Auditory task 0 10 20 30 40 50 60 70 (a) (b) (c)
Dys CA control RA control
DL (ms) Groups 200 220 240 260 280 300
Dys CA control RA control
PSE (ms) Groups 0 20 40 60 80 100 150 220 290 360 430 % "long" Dura ons (in ms) Dys CA control RA control
dyslexia were more variable in their judgments of intermediate dura-tions. As illustrated in Figure 4b, there was no group effect on PSE.
2.2.4 | Comparison between word identification and
auditory temporal tasks
Because the same durations were used in the speech and non- speech tasks, we compared DL and PSE obtained in the two tasks. A two- way ANOVA including the factors Group and Task was carried out. As illus-trated in Figure 5a, DL was larger in the word identification task than in the auditory task for the three groups [Group: F(2, 36) = 6.2, p = .004; Task: F(1, 36) = 24.06, p < .0001], but the interaction between Group and Task failed to reach significance [F(2, 36) = 2.12, p = .13]. Concerning the PSE, there was a main effect of Task [F(1, 36) = 25.1,
p < .0001] and a significant Group × Task interaction [F(2, 37) = 5.58, p = .007], reflecting the fact that the biggest task differences were
obtained for the children with dyslexia, who showed a remarkable in- crease in PSE in the word identification task as compared with the audi-tory task (249 ms versus 305 ms, p < .0001, effect size: Cohen’s d = 1.21). There were no task differences for the two control groups (CA controls: 267 ms versus 274 ms, p = .52, effect size: Cohen’s d = .13; RA controls: 273 ms versus 296 ms, p = .12, effect size: Cohen’s d = .48) (see Figure 5b). This means that children with dyslexia largely underestimated durations in the word identification task as compared with the auditory task.
2.2.5 | Correlation analysis
Correlation coefficients were computed between temporal variability in the three tasks and performance in reading and phonological aware-ness for dyslexic children only. Results revealed that the variability in the auditory bisection task was clearly related to the performance in reading tests [one- minute- reading test: r(18) = −.50, p = . 03; regular word reading: r(18) = −.75, p = .0003] and in the phonological aware-ness tasks [sum of CCV + CVC + syllable deletion times: r(17) = .68; p =.002]. The more variable dyslexic children were in the explicit tem-poral task, the more impaired they were in reading and phonologi-cal tasks. Performance in the word identification task was correlated only with performance in reading tests [one- minute- reading test:
r(13) = −.76, p = .002; regular word reading: r(13) = −.71, p = .007;
irregular word reading: r(13) = −.70, p = .007], whereas performance F I G U R E 4 Experiment 1. Visual temporal task. (a) Mean difference limen (DL in ms) for the three groups (Dys = Dyslexics, CA control = controls matched with chronological age, RA control = controls matched with reading- level age). (b) Mean point of subjective equality (PSE in ms) in the three groups. Error bars are standard of the means. (c) Mean proportion of ‘long’ responses plotted against stimulus duration for the three groups of children Visual task 0 50 100 150 200
Dys CA control RA control
DL (ms) Groups 500 540 580 620 660
Dys CA control RA control
PSE (ms) Groups 0 20 40 60 80 100 300 450 600 750 900 % "long" Durations (in ms) Dys CA control RA control (a) (b) (c) F I G U R E 5 Experiment 1. (a) Mean difference limen (DL in ms) for the three groups (Dys = Dyslexics, CA control = controls matched with chronological age, RA control = controls matched with reading- level age in the two tasks). (b) Mean point of subjective equality (PSE in ms) in the three groups and the two tasks. An increase of the PSE in the word identification task for the dyslexics means that they underestimated durations. Error bars are standard of the means 0 20 40 60 80 100 120 140 (a) (b)
Dys CA control RA control
DL (ms)
Groups
Auditory task
Word identification task
200 250 300 350
Dys CA control RA control
PSE (ms)
Groups
Auditory task Word identification task
in the visual bisection task was correlated only with phonological awareness [sum of CCV + CVC + syllable deletion times: r(17) = .67; p = .002]. Together, these fairly strong correlations suggest that there is a link between temporal processing abilities and reading and phono-logical abilities in children with dyslexia.
2.3 | Discussion
The results of Experiment 1 clearly showed that children with dys-lexia were impaired when performing implicit or explicit temporal judgments both in the visual and in the auditory modality. In particu-lar, children with dyslexia presented larger perceptual variability in the three tasks, even in comparison with RA controls. The results are compatible with the strong predictions of the temporal sampling the-ory, namely that temporal deficits are domain- general (i.e. they can be found in the visual and auditory modality of speech and non- speech stimuli) and survive the comparison with RA controls. In the frame-work of the pacemaker- counter clock model, increased variability in the temporal bisection procedure, as revealed by a shallower slope of the psychophysical function (DL), points to a dysfunction of the internal clock, namely at the switch level. If the brain’s internal clock is deficient, we would indeed expect to see inefficient phase locking and poor extraction of temporal cues, as documented by Goswami and colleagues (e.g. Power, Mead, Barnes, & Goswami, 2013). However, before embracing such a general account, it is neces-sary to rule out one alternative hypothesis, which is that the greater perceptual variability (poorer discrimination, shallower slopes) could be caused by a general reduced level of alertness or lapses of atten-tion in children with dyslexia (Davis, Castles, McAnally, & Gray, 2001). Indeed, in the framework of the pacemaker- counter clock model, an increase in the variability of switch latency could be caused by a re-duced alertness level (Allan, 1992; Droit- Volet, 2003; Whiterspoon & Allan, 1985). That is, in order to detect the visual or the auditory stim-ulus as soon as it occurs, subjects have to increase and maintain their alertness until the stimulus starts. If they fail to do so, the variability of switch latency may increase, thus reducing temporal sensitivity. A similar explanation could be proposed for the rightward shift of the PSE in the word identification task, which suggests that children with dyslexia underestimated durations in the context of a linguistic task. Given that the speech task is more attention- demanding (because children need to process both temporal and spectral information), it could be that more pulses are lost owing to lapses of attention (Brown, 1997; Burle & Casini, 2001), which would lead to an underestimation of vowel duration, as was indeed found in the present experiment. This alternative hypothesis was tested in Experiment 2 by means of comparing a temporal with a non- temporal bisection task and by adding an attentional load manipulation. If reduced alertness levels are the cause of the greater perceptual variability and poorer discrim-ination of children with dyslexia, one should find increased variability and shallower slopes both in the temporal and in the non- temporal bi-section task. If lapses of attention are responsible for underestimated durations in the linguistic task, then we would expect that attentional load would amplify the PSE shift.3 | EXPERIMENT 2
In the present experiment, children with dyslexia and CA controls performed two auditory tasks, a temporal one and a non- temporal one. The non- temporal task required a judgment of intensity. The two tasks were performed either with a normal or with a high attentional load. In addition to providing a potential replication of the temporal processing deficit found in Experiment 1, the aim of Experiment 2 was to investigate whether lapses of attention or reduced alertness in chil-dren with dyslexia could explain their temporal processing deficits. If so, temporal and non- temporal tasks should be affected similarly and attentional load should amplify the impairments.
3.1 | Methods
3.1.1 | Participants
Thirty- two children participated in this study (16 dyslexics and 16 CA controls). None of the children had participated in Experiment 1. Dyslexic children were recruited from the same national reference center and with the same criteria as in Experiment 1. The children in the control group were recruited from several schools in Marseille with the same criteria as described in Experiment 1. The characteristics of the participants are shown in Table 2. The study was conducted with the understanding and consent of the participants and their parents.
3.1.2 | Procedure
Participants performed a temporal bisection task and a loudness bi- section task either under normal conditions or in the presence of a dis-tractor task (high attentional load). Participants were seated in a quiet room facing a video- screen. Auditory stimuli were delivered through headphones. Two response keys were available, one for each hand (index fingers were used). The experiment was controlled by a micro-computer running t- scope (Stevens et al., 2006). For each task, before the test phase, participants undertook a training session.3.1.3 | Auditory temporal bisection task
The procedure for the training and the test phase was strictly identical to the one used in the auditory temporal bisection task presented in Experiment 1. The same durations were used.
3.1.4 | Loudness bisection task
The procedure for the training and the test phase was identical to the one used in the auditory temporal bisection task. First, participants were presented with the two anchor intensities (I min and I max), each presented five times in alternation. Participants were instructed sim-ply to listen to the sounds with no response required. The stimuli were described for the participants by the experimenter, who indicated in
French whether a stimulus was ‘soft’ or ‘loud’ in tandem with its pres-entation. Next, the two anchor intensities were randomly presented 10 times, and children indicated whether the stimulus presented was soft or loud by pressing the appropriate response key, using either the right or left index finger. The association between the response (soft or loud) and the index finger used (right or left) was counterbalanced between participants. Feedback was not given after each response, but only at the end of the block of trials. In the test phase, white noise could be of five different intensities (I min = soft, I2, I3 = comfortable, I4, I max = loud). The intensities were adapted to each child. The intermediate intensity I3 was fixed at a com-fortable level of hearing at about 73 dB (the same level as used for the temporal bisection task). The two low intensities corresponded to a decrease of respectively 5% and 10% in hearing level, and the two high intensities to an increase of respectively 5% and 10%. In order to make comparisons possible between subjects, arbitrary values of 0.9, 0.95, 1, 1.05, 1.1 were respectively given to I min, I2, I3, I4, I max. A white noise was delivered at each trial, and participants were re-quired to indicate whether the presented stimulus was soft or loud by pressing the appropriate response key. Feedback was not given after each trial.
3.1.5 | Attentional load manipulation
In the dual task condition (high attentional load), participants were asked to look at pictures appearing on the screen while performing the audi-tory bisection tasks. The images contained different animals. Children were required to look at them and were told that after the experiment some questions about the pictures would occasionally be asked.
3.1.6 | Procedure
Each participant performed four blocks (2 tasks × 2 attentional load con-ditions) of 50 trials corresponding to five stimuli (five different durations or five different intensities), each delivered 10 times (inter- trial inter-val = 2 s). The order of the tasks and conditions was counterbalanced across participants. The entire session lasted about 40 minutes. The an-chor values used in each task were chosen from pilot studies to make the difficulties of the two tasks as similar as possible. The percentage of correct responses for controls in the training phase was 97.5% (SD = 4.5) in the temporal bisection task and 98.7% (SD = 3.4) in the loudness bi-section task. This difference was not significant [t(15) = 1; p = .33].3.1.7 | Neuropsychological assessments
As in Experiment 1, in addition to IQ tests and reading scores, com-plementary neuropsychological assessments were performed for both groups of children: reading performance, phonological awareness, and memory were evaluated for all children. The differences between the groups were assessed using independent sample t- tests. The data are summarized in Table 2.3.2 | Results
As in Experiment 1, sigmoidal functions were fitted to the response functions of each participant in each task. This function allowed us to estimate the two dependent variables: DL and PSE. First, we compared performance between the two groups in the bisection tasks performed under normal conditions (no dual task) to Dyslexics CA controls Dys/CA (t value, p) Number 16 16 Age 9.6 (0.8) 9.4 (0.8) 0.34, ns Reading age 7.5 (0.6) 10.4 (1.7) 6.37, *** Non- verbal IQ 94.7 (18) 103.4 (25.4) 1.12, ns Reading tests One- minute- reading 43.1 (15.7) 80.3 (16.2) 6.6, *** Regular words (/10) 9.8 (0.4) 10 (0) 1.9, p = .07 Irregular words (/10) 7 (2.2) 9.4 (0.7) 4.22, *** Pseudo- words (/20) 15.7 (3.6) 20 (0) 4.8, *** Phonology assessment Syllable deletion (time in s) 38 (7.9) 28.5 (4.9) 4.07, *** Syllable deletion (errors) 2.4 (3.1) 0.1 (0.3) 3.14, ** Phoneme deletion CVC (time in s) 34.7 (8.1) 25.6 (3.5) 4.08, *** Phoneme deletion CVC (errors) 2.1 (3.6) 0.1 (0.3) 2.55, ** Phoneme deletion CCV (time in s) 48.8 (12.8) 33.9 (7.5) 4.03, *** Phoneme deletion CCV (errors) 5 (3) 1.3 (1.2) 4.82, *** Memory tests Forward digit span 1.94 (1.2) 3.1 (1.2) 2.8, ** Backward digit span 1.06 (0.8) 3.2 (1.1) 6.4, *** T A B L E 2 Experiment 2. Characteristics of dyslexics and chronological- age controls (CA controls). Representations of p- values: ns = non- significant; * = p < .05, ** = p < .01, *** = p < .001. Standard deviations in ()investigate whether the temporal deficits could be replicated in our new sample of children with dyslexia. Second, a two- way ANOVA in-cluding the factors Group (dyslexic versus AC control) and Attentional Load (with or without attentional load) was carried out to assess the effect of attentional load on the performance in the two bisection tasks. Homogeneity of variance was tested for each dependent vari-able and each task using the nonparametric version of Levene’s test of equality of error variances. The error variances between groups were not statistically different in either of the two tasks.
3.2.1 | Comparison between groups
Because loudness and temporal bisection tasks are on different scales, we normalized the indices to facilitate the comparison between the two tasks.2
Temporal bisection task
Figure 6a reveals that the normalized variability index (Weber Fraction, WF) was larger in the dyslexic group than in the control group [F(1, 29) = 4.31, p = .04, effect size: Cohen’s d = .77], show-ing that children with dyslexia were more variable in their temporal judgments than control children of the same age. In addition, the shift of the PSE was larger for the dyslexic group compared with the control group [F(1, 29) = 3.95, p = .05; effect size: Cohen’s
d = .74] (see Figure 6b). This indicates that children with dyslexia
overestimated durations (dyslexics: PSE = 252 ms; AC control: PSE = 270 ms). Loudness bisection task As can be seen in Figure 6, there were no differences between groups either for the variability index [F(1, 27) = 1.64, p = .21], or for the PSE [F(1, 27) < 1]. That is, children with dyslexia performed the loudness bisection as well as the controls and there was no shift of the PSE in this task.
3.2.2 | Effect of attentional load on the two tasks
Temporal bisection task
There was no effect of the attentional load manipulation condition on the index of variability DL [F(1, 29) = 2.31; p = .13], nor a signifi-cant Group × Attentional Load interaction [F(1, 29) = 2.47; p = .13]. Concerning the PSE, there was a main effect of the Attentional Load [F(1, 29) = 22.6, p < .00001, effect size: Cohen’s d = 1.77]. The PSE was larger when participants had to judge the duration of sounds in the high attentional load condition than in the normal condition, which suggests that there was a clear shift of the PSE under high attentional load in both groups. Moreover, the Group × Attentional Load interac-tion was significant [F(1, 29) = 4.99, p = .03], suggesting that the shift was larger for dyslexics than for controls (Dyslexics: 253 ms versus 294 ms; Controls: 270 ms versus 283 ms). However, this effect ap- pears to be driven by the ‘normal’ condition, where children with dys-lexia clearly overestimated the duration.
Loudness bisection task
We observed no effect of Attentional Load on the PSE [F(1, 27) = 2.3, p = .14], nor a significant Group × Condition interaction [F(1, 27) < 1]. Concerning the variability index (DL), there was no sig-nificant effect of Attentional Load [F(1, 27) < 1] and no sig[F(1, 27) < 1]. Concerning the variability index (DL), there was no sig-nificant Group × Condition interaction [F(1, 27) < 1], suggesting that paying attention to images did not impair the judgment of loudness in either of the groups.
3.2.3 | Correlation analysis
Correlations were computed between temporal variability in the temporal bisection task without distractor and performance in read-ing and phonological awareness for dyslexic children only. Significant correlations were obtained between temporal sensitivity and some reading scores [one- minute- reading test: r(15) = −.54, p = .03; non- word reading: r(15) = −.76, p = .001] and also abilities in phonological awareness [sum of CCV + CVC + syllable deletion times: r(15) = .56,
p = .02].
Correlation analyses were also run with the data of Experiments 1 and 2 put together and they revealed significant correlations between temporal sensitivity in the auditory temporal task and both reading performance [one- minute- reading test: r(33) = −.50, p = .003; irregu-lar word reading: r(33) = −.36, p = .04; non- word reading: r(33) = −.48, F I G U R E 6 Experiment 2. (a) Variability expressed by the mean Weber fraction (WF) for the two groups (Dys = Dyslexics, CA control = controls matched with chronological age) in the temporal bisection task and in the loudness bisection task. (b) Percentage of overestimation calculated from the PSE in the two groups and in the two bisection tasks. Error bars are standard of the means 0 0.05 0.10 0.15 0.20 0.25 (a) (b)
Temporal bisection Loudness bisection
WF Tasks Dys CA control 0 5 10 15 20
Temporal bisection Loudness bisection
% of overestimation
Tasks
Dys CA control
p = .004] and abilities in phonological awareness [sum of CCV + CVC + syllable deletion times: r(33) = .55, p = .001]. Examples of correla-tions with reading performance and phonological awareness are given in Figure 7.
3.3 | Discussion
The results of Experiment 2 can be summarized as follows. First, the results from the temporal bisection task without distractors perfectly replicated the temporal processing deficit found in Experiment 1 in a new sample of dyslexic children. That is, children with dyslexia showed larger perceptual variability associated with a leftward shift of the PSE (systematic overestimation). Second, lapses of attention or reduced alertness in children with dyslexia cannot explain the greater perceptual variability in the temporal bisection task because this should have affected the loudness bisection task in the same way, which is not what we found. Indeed, children with dyslexia were not impaired in the loudness bisection task, although the two tasks were matched in terms of difficulty. Note that the dissociation between deficits in temporal and loudness bisection tasks also rules out the theory according to which people with dyslexia fail to form perceptual anchors (Ahissar, 2007). If they failed to form perceptual anchors in the temporal task, they should have also failed in the loudness bisec- tion task (see also Ziegler, 2008). Third, the attentional load manipula-tion (dual task) had no significant effect on the perceptual variability index. It only affected the PSE in ways that are fully expected from the literature on time perception (Brown, 1997; Casini & Macar, 1997; Hicks, Miller, Gaes, & Bierman, 1977; Macar, Grondin, & Casini, 1994; Zakay, 1989). That is, attentional load tends to result in a rightward shift of the function, which indicates that subjects start to underesti-mate durations under high attentional load.3 This was indeed the case both for children with dyslexia and controls. However, the significant interaction between Attentional Load and Group on PSE was driven by the fact that children with dyslexia massively overestimated dura-tions in normal conditions, not that they abnormally underestimated durations under high load conditions.4 | GENERAL DISCUSSION
Two experiments were carried out to investigate whether chil-dren with dyslexia presented deficits in temporal tasks. The results showed that children with dyslexia presented larger perceptual vari-ability when performing temporal tasks whether they were explicit or implicit and whether they involved the auditory or the visual modal-ity. It is worth noting that although the sample size was rather small in each experiment, which remains one limitation of our study, tem-poral deficits were found in both experiments with two independent samples of participants. The temporal processing deficits were sig-nificant when compared against reading- age controls in Experiment 1, which suggests that these deficits are fundamental and not simply the result of a lack of reading experience (Goswami, 2015). At the same time, children with dyslexia had no deficits in a loudness bisec-tion task (see Pasquini, Corriveau, & Goswami, 2007), which had the same attentional demands and memory and decision processes as the temporal bisection task. This finding suggests that lapses of attention (Davis et al., 2001), reduced attentional alertness, or impoverished anchoring are not at stake because such deficits should have affected the loudness bisection task in the same way. Finally, increased atten- tional load shifted the response functions but had no significant ef-fect on perceptual variability. Altogether, the results suggest that there are specific impairments in the ‘internal clock’ of children with dyslexia.
Temporal processing deficits have a long history in dyslexia re-search (Farmer & Klein, 1995; Tallal, 1984; Tallal & Benasich, 2002; Wright, Brown, & Zecker, 2000), and various studies converge to sug-gest that children with dyslexia have deficits in temporal processing, temporal alignment, temporal sequencing and temporal sampling (Goswami et al., 2002, 2010; Thomson & Goswami, 2008; Thomson, Fryer, Maltby, & Goswami, 2006; Vandermosten et al., 2010, 2011). The present study significantly adds to this accumulated evidence by showing that children with dyslexia have a deficit in explicit and im-plicit estimation of time both in the visual and in the auditory domain that cannot be reduced to deficits in attention or memory. The prom-inent role of temporal processing throughout the history of dyslexia research is hardly surprising given that the core deficit of dyslexia is phonological and that current models of speech processing strongly acknowledge that ‘speech is inherently tied to time’ (Kotz & Schwartze, F I G U R E 7 Correlations with data of Experiments 1 and 2. Correlation plots between the temporal sensitivity and the score in the one- minute- reading test (upper part) or the global time in the syllable and phoneme deletion tests (lower part) (33 subjects) 0 20 40 60 80 100 0 20 40 60 80 100 120 140
Correct read word
s Temporal sensitivity (DL) 0 20 40 60 80 100 0 20 40 60 80 100 120 140 Phonological awarenes s Temporal sensitivity (DL)
2010, p. 392). Indeed, Kotz and Schwartze (2010) suggest that ‘tem-poral processing mechanisms (i.e., mechanisms underlying the explicit encoding, decoding and evaluation of temporal information) need to be involved in the interpretation of the temporal structure of speech’ (p. 392). Timing originates in evolutionary primitive brain structures such as the cerebellum and the basal ganglia (Buhusi & Meck, 2005). Interestingly, the cerebellar theory of dyslexia (Nicholson, Fawcett, & Dean, 2001) has already highlighted a dysfunction of the cerebellum as a possible biological cause of dyslexia. However, while this theory has focused on the cerebellum’s role in skill automatization, the pres-ent research suggests that it might be deficient temporal processing in the cerebellum that causes abnormal speech processing and phono-logical development. A recent theory of speech processing has proposed that accurate perception of the speech signal at multiple temporal scales is import-ant for the efficient extraction of meaningful phonological elements, and that oscillatory entrainment mechanisms may contribute to this process (Poeppel, 2003; Ghitza & Greenberg, 2009). Based on such theorizing and on the behavioral relationships observed between rise time discrimination, rhythmic performance and phonological difficulties, the temporal sampling framework proposed that the phonological deficits found in dyslexia may arise in part because of atypical ‘temporal sampling’ of the speech signal by neuroelectric oscillations (Goswami, 2011). Specifically, temporal sampling theory proposes that a key impairment in dyslexia involves atypical auditory oscillatory phase- locking to slower temporal modulations below 10 Hz (Goswami & Leong, 2013; Soltesz, Szu, Leong, White, & Goswami, 2013). Interestingly, the detection of temporal regularity necessitates an explicit internal representation of temporal structure generated by temporal processing systems. Although we can only speculate at this point, it is tempting to conclude that the greater variability in time estimation that we attributed to a dysfunction of the ‘internal clock’ in children with dyslexia might be directly related to poor temporal sampling and impaired phase locking by oscillatory networks.
The causal link between poor temporal processing and dyslexia has been recently supported by the results of an intervention study, which showed that music training based on rhythm has strong ben- eficial effects on phonological awareness and reading in severely im-paired dyslexic children (Flaugnacco et al., 2015). As an explanation for this cross- domain transfer between music and reading, the authors refer to the precise auditory timing hypothesis (PATH) (Tierney & Kraus, 2014). According to this hypothesis, the enhanced phonological abilities in musically trained children are related to the high degree of precision in audio- motor timing required by music, possibly leading to an enhanced perception of the timing of speech sounds. NOTES 1 Children in France start primary school and formal reading instruction at the age of 6. Dyslexic children in France are typically diagnosed between the ages of 9 and 11.
2 DL was normalized by dividing raw values by PSE, which corresponds
to the Weber Fraction (WF) and indicates the variability (Droit- Volet & Izaute, 2009; Droit- Volet & Wearden, 2001; Millot, Laurent, & Casini,
2016). The PSE were transformed as follows: (PSE – midpoint value)/ midpoint value (the midpoint values were the intensity of 1 and the dura-tion of 290 ms), which corresponds to the percentage of PSE shift. 3 The explanation is that each time attention is distracted towards non- temporal parameters, the switch opens which would stop the accumu-lation of pulses and lead to durations judged as shorter (Burle & Casini, 2001; Casini & Macar, 1997). REFERENCES Ahissar, M. (2007). Dyslexia and the anchoring- deficit hypothesis. Trends in Cognitive Sciences, 11, 458–465. Ahissar, M., Protopapas, A., Reid, M., & Merzenich, M.M. (2000). Auditory processing parallels reading abilities in adults. Proceedings of the National Academy of Sciences, USA, 97, 6832–6837.
Allan, L.G. (1992). The internal clock revisited. In F. Macar, V. Pouthas & W. Friedman (Eds.), Time, action, and cognition: Towards bridging the gap (pp. 191–202). Dordrecht: Kluwer, Academic Publishers.
Allan, L.G., & Gibbon, J. (1991). Human bisection at the geometric mean. Learning and Motivation, 22, 39–58.
Bertrand, D., Fluss, J., Billard, C., & Ziegler, J.C. (2010). Efficacité, sensibil-ité, spécificité: Comparaison de différents tests de lecture [Efficiency, sensitivity, specificity: Comparison of different reading tests]. Annee Psychologique, 110, 299–320.
Breier, J.L., Fletcher, J.M., Foorman, B.R., Klaas, P., & Gray, L.C. (2003). Auditory temporal processing in children with specific reading disabil-ity with and without attention deficit/hyperactivity disorder. Journal of Speech, Language and Hearing Research, 46, 31–42.
Bretherton, L., & Holmes, V.M. (2003). The relationship between auditory temporal processing, phonemic awareness, and reading disability. Journal of Experimental Child Psychology, 84, 218–243.
Brown, S.W. (1997). Attentional resources in timing: Interference effects in concurrent temporal and nontemporal working memory tasks. Perception and Psychophysics, 59, 1118–1140.
Buhusi, C.V., & Meck, W.H. (2005). What makes us tick? Functional and neural mechanisms of interval timing. Nature Reviews Neuroscience, 6, 755–765.
Burle, B., & Casini, L. (2001). Dissociation between activation and atten-tion effects in time estimation: Implications for internal clock models. Journal of Experimental Psychology: Human Perception and Performance, 27, 195–205.
Casini, L., Ramdani-Beauvir, C., Burle, B., & Vidal, F. (2013). How does one night of sleep deprivation affect the internal clock? Neuropsychologia, 51, 275–283.
Casini, L., Burle, B., & Nguyen, N. (2009). Speech perception engages a general timer: Evidence from a divided attention word identification task. Cognition, 112, 318–322.
Casini, L., & Macar, F. (1997). Effects of attention manipulation on perceived duration and intensity in the visual modality. Memory and Cognition, 25, 812–818.
Chevrie-Muller, C., Simon, A.M., Fournier, S., & Brochet, M.O. (1997). Batterie langage oral – langage écrit, mémoire – attention. L2MA. Paris: Editions du Centre de Psychologie Appliquée.
Cohen-Mimran, R., & Sapir, S. (2007). Auditory temporal processing deficits in children with reading disabilities. Dyslexia, 13, 175–192.
Davis, C., Castles, A., McAnally, K., & Gray, J. (2001). Lapses of concen-tration and dyslexic performance on the Ternus task. Cognition, 81, B21–31.
Droit-Volet, S. (2003). Alerting attention and time perception in children. Journal of Experimental Child Psychology, 85, 372–384.
Droit-Volet, S., & Izaute, M. (2008). Improving time discrimination in chil-dren and adults in a temporal bisection task: The effects of feedback and no forced choice on decision and memory processes. Quarterly Journal of Experimental Psychology, 62, 1173–1188.
![Figure 6a reveals that the normalized variability index (Weber Fraction, WF) was larger in the dyslexic group than in the control group [F(1, 29) = 4.31, p = .04, effect size: Cohen’s d = .77], show-ing that children with dyslexia were more vari](https://thumb-eu.123doks.com/thumbv2/123doknet/14517243.530732/11.892.105.401.562.986/figure-reveals-normalized-variability-fraction-dyslexic-children-dyslexia.webp)
