HAL Id: hal-02288610
https://hal-amu.archives-ouvertes.fr/hal-02288610
Submitted on 15 Sep 2019
HAL is a multi-disciplinary open access
archive for the deposit and dissemination of
sci-entific research documents, whether they are
pub-lished or not. The documents may come from
teaching and research institutions in France or
abroad, or from public or private research centers.
L’archive ouverte pluridisciplinaire HAL, est
destinée au dépôt et à la diffusion de documents
scientifiques de niveau recherche, publiés ou non,
émanant des établissements d’enseignement et de
recherche français ou étrangers, des laboratoires
publics ou privés.
Photochemistry of CH 3 Cl: Dissociation and CH
×××Cl
Hydrogen Bond Formation
Vanessa de Medeiros, Railton de Andrade, Ezequiel Leitão, Elizete Ventura,
Glauco Bauerfeldt, Mario Barbatti, Silmar Do Monte
To cite this version:
Vanessa de Medeiros, Railton de Andrade, Ezequiel Leitão, Elizete Ventura, Glauco Bauerfeldt, et
al.. Photochemistry of CH 3 Cl: Dissociation and CH
×××Cl Hydrogen Bond Formation.
Jour-nal of the American Chemical Society, American Chemical Society, 2016, 138 (1), pp.272-280.
�10.1021/jacs.5b10573�. �hal-02288610�
1
Photochemistry of CH
3
Cl: Dissociation and CH∙∙∙Cl hydrogen bond
formation
Vanessa C. de Medeiros
†, Railton B. de Andrade
†, Ezequiel F. V. Leitão
†, Elizete Ventura
†,
Glauco F. Bauerfeldt
‡, Mario Barbatti
§*, Silmar A. do Monte
†*
†Departamento de Química, CCEN, Universidade Federal da Paraíba 58059‐900, João Pessoa‐PB, Brazil. ‡ Departamento de Química, Instituto de Ciências Exatas, UFRRJ, Pavilhão Roberto Alvahydo (PQ), sala 44. km 7, Rodovia Br 465, Seropédica, RJ 23890‐000, Brazil §Aix Marseille Université, CNRS, ICR UMR7273, 13397 Marseille, France (ORCID ID: 0000‐0001‐9336‐6607) KEYWORDS: Methyl chloride, photodissociation, ion‐pair, MR‐CISD, Rydberg states.
ABSTRACT: State‐of‐the‐art electronic structure calculations (MR‐CISD) are used to map five different dissociation
channels of CH3Cl along the C – Cl coordinate: i) CH3(X2A2´´) + Cl(2P), ii) CH3(3s2A1´) + Cl(2P), iii) CH3+(1A1´) + Cl(1S), iv)
CH3(3p 2E´) + Cl(2P), and v) CH3(3p 2A2´´) + Cl(2P). By the first time these latter four dissociation channels, accessible
upon VUV absorption, are described. The corresponding dissociation limits, obtained at the MR‐CISD+Q level, are 3.70, 9.50, 10.08, 10.76, and 11.01 eV. The first channel can be accessed through n* and n3s states, while the second channel can be accessed through ne3s, ne3p, and 3s states. The third channel, corresponding to the CH3+ + Cl ion‐pair, is accessed
through ne3pe states. The fourth is accessed through ne3pe, ne3p, and 3p, while the fifth through 3pe and CH* states.
The population of the diverse channels is controlled by two geometrical spots, where intersections between multiple states allow a cascade of nonadiabatic events. The ion‐pair dissociation occurs through formation of CH3+∙∙∙Cland
H2CH+∙∙∙Cl intermediate complexes bound by 3.69 and 4.65 eV. The enhanced stability of the H2CH+∙∙∙Cl complex is due
to a CH∙∙∙Cl hydrogen bond. A time‐resolved spectroscopic setup is proposed to detect those complexes.
■
INTRODUCTION
As it is well known, Cl atoms catalyze O3
decomposition.1,2 Thus, a detailed mapping of its sources
is a fundamental environmental issue. In the stratosphere, these atoms are significantly generated from photolysis of methyl chloride (CH3Cl) making this compound
particularly important for atmospheric photochemistry.3,4 The lowest photodissociation channel of clorofluorcarbons (CFCs) and halocarbons usually involves excitations from chlorine lone pairs (n) into C – Cl antibonding (*) orbitals5‐7 induced by UVB or low UVC radiation.8 Although a large percentage of these molecules photodissociate in the stratosphere via this low‐lying channel, the surviving molecules can reach the ionosphere, where vacuum UV (VUV) opens new dissociation channels after excitation into higher states.9 Moreover, because some of these high excitations have large transition moments,10,11 the action spectrum is shifted to high energies, making them specially relevant from the photochemical point of view.
The photodissociation of CH3Cl has been studied at
193.3,12,13 157.6,14‐19 and 121.6 nm.13,20 While the first two excitation wavelengths yield CH3 + Cl as the main
photoproducts, the latter also leads to the generation of H atoms with high yields. Excitation at 193.3 nm (6.41 eV) is expected to reach the long‐wavelength absorption limit of the nσ* band,21 while at 157.6 nm (7.87 eV) it should reach a region of much larger absorption cross section, already belonging to the n3s band.21,22 Apart from the well‐known photodissociation channels forming neutral fragments, Tuckett et al.23,24 measured the cross sections for Cl generation following photoexcitation of CH3Cl in the range from 8 to 35 eV and
obtained the most intense peak in the region from 10.5 to 11.9 eV. Moreover, this peak is much more intense than that reported for CH2Clformation.23,24 According to a
detailed analysis of the photoabsorption spectrum of CH3Cl in the region from 6 to 12 eV provided by Locht et al.,11 the Clpeak should correspond to ns, np, and nd Rydberg states. Previous high‐level calculations at the MR‐CISD+Q level indicate that the σ3s and σ3p Rydberg
2 states lie in the region from 11 to 12 eV,22 matching the
Cl peak.23,24,
Given the relevance of methyl chloride for atmospheric photochemistry, it is somewhat surprising how little theoretical information is available about its photodissociative processes. Apart from the study of Granucci et al.,7 in which potential energy surfaces for the
first three singlet states of CH3Cl have been calculated at
the CASPT2 level, theoretical reports concerning the photochemical mechanisms of CH3Cl fragmentation in
the upper atmosphere are scarce.
In this work, we aim at filling this knowledge gap by a thorough description of the main photodissociation channels of methyl chloride into CH3 + Cl and CH3+ + Cl.
High‐level ab initio potential energy profiles for a dozen singlet excited states are computed along the dissociation coordinate, comprising essentially the same energy range we have studied previously, but limited to the Franck‐ Condon region.22 Strong multi‐reference character, very diffuse Rydberg states, diverse avoided crossings, exotic complexes, and five different dissociation channels compose the intricate electronic structure emerging from this study. Naturally, the description of these channels requires a deep degree of technicality. We have, however, made a great effort to rationalize all this information in terms of a simple picture where CH3Cl relaxes through a
cascade of nonadiabatic processes taking place in two geometrical spots featuring multiple conical intersections, and feeding the dissociation channels on the way down, during the relaxation. This picture is possibly shared by Cl dissociation in many other CFCs and halocarbons.
Along one of these dissociation channels, we show that Clproduction is associated to strongly bound CH3+∙∙∙Cl
and H2CH+∙∙∙Cl intermediate complexes. We discuss
below that the latter one, in particular, is stabilized by a CH∙∙∙Cl hydrogen bond. CH∙∙∙Cl hydrogen bonds are odd chemical structures. They have been almost exclusively reported in the solid state,25‐28 where steric effects hold the complexes together. They are invariably weak, with the H‐Cl distance approximately corresponding to the sum of H and Cl van der Waals radii (3.0 Å). Searching over thousands of entries in the Cambridge Structural Database, this distance is never inferior to 2.4 Å.26‐2728 CH∙∙∙Cl hydrogen bonds may also occur aided by metallic bonds29 or by trapping the Cl within the cavities of macromolecules.30,31 In the present case of the H2CH+∙∙∙Cl
complex, we have not only found out that a CH∙∙∙Cl double‐charge‐assisted hydrogen bond may occur in the gas phase, but also—which is even more astonishing— that it may be very strong, with a bond distance of only 1.9 Å.
■
COMPUTATIONAL DETAILS
In most of the calculations, the Cs symmetry has been
used and the symmetry plane corresponds to the yz plane. The 3p lone pair of the Cl atom, which is along the C – Cl
bond, has been named 3p. It interacts with the 2p
orbital of the CH3 moiety to yield the CCl and CCl*
orbitals, hereafter referred as and *. The degenerate lone pairs (3px, 3py) are simply designated as ne. Three
valence (CH) orbitals of CH3, as well as the 3s(C), 3p(C),
and 3pe(C) Rydberg orbitals, have also been included in
the present study. The n = 3 notation for the Rydberg orbitals has been chosen on the basis of that of Rogers et
al.,23 Antol et al.,32 and Medeiros et al.22
For the muticonfigurational self‐consistent (MCSCF) calculations, a valence complete active space (CAS) was chosen with twelve electrons (four from the ne orbitals,
two from the bond, and six from the CH orbitals) and
seven orbitals (the ne orbitals, and *, and the three
valence CH orbitals). These valence orbitals have been
included following the results of Mebel and Lin,33 which reported a valence state between the two 3p states of CH3.
Besides, inclusion of these orbitals is crucial to guarantee a flexible occupied space and keep the correct shape of the high‐lying 3p(C) Rydberg orbitals upon dissociation. Four Rydberg orbitals (3s(C), 3p(C), 3pe(C)) have been
included in the auxiliary (AUX) space and only single CAS → AUX excitations were allowed. Eleven singlet states with equal weights have been included in the state‐ averaged MCSCF calculations. As Cs symmetry has been
used and the actual symmetry along the potential energy curves is C3v one needs to compute the average energies of
the correct pairs of A´ and A´´ roots to get the energies of the E states. At the equilibrium geometry the correspondences are 11A1 – 11A´; 11E – (21A´ + 11A´´); 21E –
(31A´ + 21A´´); 21A
1 – 41A´; 31E ‐ (51A´ + 31A´´); 11A2 – 41A´´;
41E – (61A´ + 51A´´); 31A1 – 71A´; 41A1 – 81A´; 51E – (91A´ +
61A´´); 51A1 – 101A´.
For the multi‐reference configuration interactions calculations with singles and doubles (MR‐CISD), a slightly different orbital scheme for generating the reference configuration state functions (CSF) has been used; that is, the three CH orbitals are included in the
restricted active space (RAS). The ne, , and * orbitals
have been included in the CAS space, while the 3s(C), 3p(C), 3pe(C) Rydberg orbitals are in the auxiliary (AUX)
space. Only single RAS→CAS and CAS→AUX excitations are allowed. The total CSF space was built through single and double excitations from all internal (active + doubly occupied) into all virtual orbitals. On the basis of previous results obtained for the CF3Cl molecule,5,6 the K + L shells
of Cl atom along with the K shell of C atom were kept frozen in all MR‐CISD calculations. The interactive space restriction34 approach has been used at this latter level.
Size‐extensivity corrections have been taken into account by the generalized Davidson method (MR‐ CISD+Q).35,36 The COLUMBUS program system37‐40 was
used for all calculations. The atomic orbitals (AO) integrals and AO gradient integrals were calculated through program modules taken from DALTON.41 The aug‐cc‐pVXZ (X=D,T) basis sets for H and Cl and the d‐
3 aug‐cc‐pVXZ (X=D,T) basis set for C42‐45 have been used.
The d‐aug basis set has been chosen centered on the C atom as the Rydberg orbitals become more localized on CH3 fragment as the C – Cl distance increases.
The geometries along the potential energy curves have been partially optimized for the ground state (relaxed scan along the C – Cl distance) at the MR‐CISD level us‐ ing only the ne, , and * orbitals in the CAS space at
both MCSCF and MR‐CISD levels. The potential energy curves consist of single‐point calculations at these geome‐ tries, performed using the aforementioned CAS→AUX and the RAS→CAS→AUX orbitals schemes at the MCSCF and MR‐CISD levels, respectively. The potential energy curves have been computed with the mixed aug‐cc‐pVDZ (H,Cl)/d‐aug‐cc‐pVDZ(C) and aug‐cc‐pVTZ(H,Cl)/d´´‐ aug´‐cc‐pVTZ(C) basis sets, where d´´‐aug´ refers to dou‐ ble augmentation of the cc‐pVTZ basis set for carbon atom, without f function in the aug‐ set and without one d and one f functions in the d‐ set.
Dissociation limits have been calculated by performing single‐point calculation using the supermolecule ap‐ proach for a CH3 – Cl distance of 50 Å with the aug‐cc‐
pVTZ(H,Cl)/d‐aug‐cc‐pVTZ(C) basis set.
Additional full geometry optimizations at the MR‐CISD level have been performed for the CH3+∙∙∙Cl
and H2CH+∙∙∙Cl
complexes as well as for the conical intersec‐ tion between the ne* and ne3s states with the aug‐cc‐
pVTZ(H,Cl)/d‐aug‐cc‐pVTZ(C) basis set. In these cases, the CH orbitals have been left in the doubly occupied
space, while the CAS space is the same as that used for generating the geometries in the relaxed scan. For the conical intersection only one Rydberg orbital (3s(C)) has been included in the AUX space, while for the complexes no Rydberg orbital has been used. Such choice is justified by the high relative energies of the remaining states at these geometries. Moreover, geometry optimizations for the ground state as well as frequencies calculations have been performed for CH3Cl, CH3, and CH3+ at the same
level. For CH3Cl only the valence ne(Cl), , and * orbitals
have been included in the CAS space at both MCSCF (the lowest three valence states have been averaged) and MR‐ CISD levels. For methyl radical, the three CH and the 2p
orbitals have been included in the CAS space, while the four Rydberg orbitals (3s(C) and 3p(C)) are in the AUX space at both levels. As before, only single CAS → AUX excitations are allowed. At the MCSCF level, five states (the ground state, one 2p3s(C), and three 2p3p(C)) have
been averaged. For methyl cation, the three CH and the
2porbitals have been included in the CAS space at both levels, and two states (the ground and the CH2p states)
have been averaged at the MCSCF level.
Analytical gradient techniques46‐49 have been employed for all geometry optimizations at the MR‐CISD level, including optimization at the crossing seam, which also counted on analytical non‐adiabatic coupling vectors.50,51
■
RESULTS AND DISCUSSION
The ground state equilibrium geometry, calculated at the MR‐CISD level with the aug‐cc‐pVTZ(H,Cl)/d‐aug‐cc‐ pVTZ(C) basis set, is in good agreement with the experi‐ mental one.52 The main difference has been obtained for the C – Cl bond distance, whose calculated value is 1.818 Å (see Figure 5), ~0.042 Å larger than the experimental value. A better agreement can be achieved through the use of more flexible basis sets and/or even more accurate potential energy surfaces (e.g. at the multi‐reference ave‐ raged quadratic coupled level, MR‐AQCC40). However, this is not the purpose of the present investigation.
Vertical Excitation Energies: The vertical excitation
energies of CH3Cl, calculated at the experimental geo‐
metry, have been previously discussed.22 In that work, ten singlet states (including the ground state) have been stu‐ died, namely: 11A1, 11E, 21E, 21A1, 31E, 11A2, 41E, 31A1, 41A1, and
51E. Here, the 51A1 state was additionally included and a
total of 11 states was obtained. Since slight modifications in the active space and overall computational procedures have been adopted in this work with respect to the pre‐ vious one, a brief discussion of the state characters and vertical excitation energies is in order.
The correspondences between Cs and C3v symmetries
have been double‐checked using as criteria both energy and the characters of each state (the latter, defined in terms of the MR‐CISD weights of all configurations and adopting a 0.1 cutoff value). The excited states are verti‐ cally assigned to the following excitations (only the dom‐ inant excitations are reported; a complete description of the characters and weights of each state is given in Table 1): 11E (ne→σ*); 21E (ne→3s(C)); 21A1(ne→3pe(C));
31E(ne→3pe(C)); 11A2 (ne→3pe(C)); 41E (ne→3pσ(C)); 31A1
(σ→3s(C)); 41A1 (σ→3pσ(C)); 51E (σ→3pe(C)); 51A1
(σCH→σ*). Vertical excitation energies, obtained at MR‐
CISD and MR‐CISD+Q levels with the aug‐cc‐ pVXZ(H,Cl)/d‐aug‐cc‐pVXZ(C) (X=D,T) basis sets are included in Table 1.
MR‐CISD+Q and MR‐CISD vertical excitation energy values generally agree within 0.2 eV, except for the 5 1A1
state, for which an expressive Davidson correction of ca. 1 eV is observed. Excluding the 51A1 state, the root‐mean‐
square deviation (RMSD) between the two levels is 0.1 eV for both basis sets. Consequently, and different from the MR‐CISD picture, the 51A1 state is predicted to appear
below the 51E at the MR‐CISD+Q level. This result is probably an artifact, as a high density of states is expected in the region above 10.0 eV11,22 and only some of the total number of states in this region have been included in the actual calculations22 due to the very high computational demand. It is worth mentioning that the vertical excita‐ tion energies of the last three states are higher than the ionization threshold of 11.29 eV.11 Results obtained with both basis sets deviate less than 0.3 eV, suggesting that the aug‐cc‐pVDZ(Cl,H)/d‐aug‐cc‐pVDZ(C) basis set is
4 satisfactory for describing the vertical excitation profile.
Including the 51A1 state, the RMSD between MR‐CISD
results with both basis sets is only 0.04 eV; for MR‐
CISD+Q, it is 0.1 eV. This result supports the subsequent potential energy curves calculations with the aug‐cc‐ pVDZ(Cl,H)/d‐aug‐cc‐pVDZ(C) basis set.
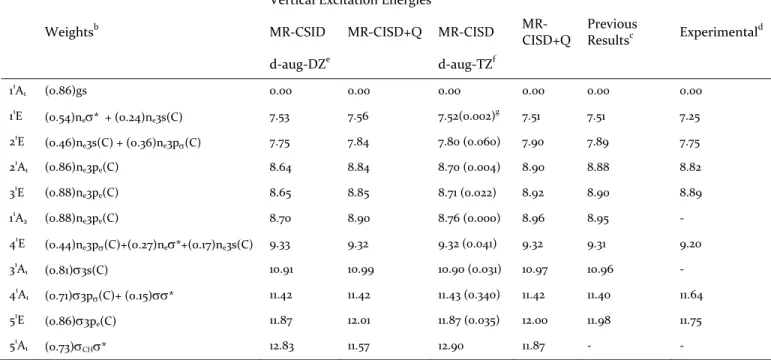
Table 1. Configuration weights and vertical excitation energies (in eV) at the MR‐CISD and MR‐CISD+Q levels. Oscillator strengths are given in parenthesis. The ground state total energies (in hartrees) are given as foot‐ notes.a
Vertical Excitation Energies
Weightsb MR‐CSID MR‐CISD+Q MR‐CISD MR‐ CISD+Q Previous Resultsc Experimental d d‐aug‐DZe d‐aug‐TZf 11A1 (0.86)gs 0.00 0.00 0.00 0.00 0.00 0.00 11 E (0.54)ne* + (0.24)ne3s(C) 7.53 7.56 7.52(0.002) g 7.51 7.51 7.25 21E (0.46)ne3s(C) + (0.36)ne3p(C) 7.75 7.84 7.80 (0.060) 7.90 7.89 7.75 21 A1 (0.86)ne3pe(C) 8.64 8.84 8.70 (0.004) 8.90 8.88 8.82 31E (0.88)ne3pe(C) 8.65 8.85 8.71 (0.022) 8.92 8.90 8.89 11 A2 (0.88)ne3pe(C) 8.70 8.90 8.76 (0.000) 8.96 8.95 ‐ 41E (0.44)ne3p(C)+(0.27)ne*+(0.17)ne3s(C) 9.33 9.32 9.32 (0.041) 9.32 9.31 9.20 31 A1 (0.81)3s(C) 10.91 10.99 10.90 (0.031) 10.97 10.96 ‐ 41A1 (0.71)3p(C)+ (0.15)* 11.42 11.42 11.43 (0.340) 11.42 11.40 11.64 51 E (0.86)3pe(C) 11.87 12.01 11.87 (0.035) 12.00 11.98 11.75 51A1 (0.73)CH* 12.83 11.57 12.90 11.87 ‐ ‐ a Ground state (gs) total energies (in hartrees): ‐499.4275695 (MR‐CISD/d‐aug‐DZ); ‐499.4642611 (MR‐CISD+Q/d‐aug‐DZ); ‐
499.5216686 (MR‐CISD/d‐aug‐TZ);‐499.5677825 (MR‐CISD+Q/d‐aug‐TZ). b At the MR‐CISD/d‐aug‐DZ level. c MR‐CISD+Q, taken from reference 22. d Taken from reference 11. e aug‐cc‐pVDZ(Cl,H)/d‐aug‐cc‐pVDZ(C). f aug‐cc‐pVTZ(Cl,H)/d‐aug‐cc‐ pVTZ(C). g Oscillator strengths.
A general agreement between the MR‐CISD and MR‐ CISD+Q results obtained in this work and the experi‐ mental data11 is observed. An excellent agreement is also observed between the actual and the previous results.22 In fact, all modifications introduced in the active space and general computational procedures do not affect the theo‐ retical results. As a detailed analysis of the vertical excita‐ tion energies has already been done,22 they will not be further discussed.
Potential Energy Curves: Potential energy profiles
along the C – Cl internal coordinate have been computed for all states. As expected, the CH3 fragment geometry
smoothly changes from pyramidal to planar geometry along the dissociation curve, and, at the dissociation lim‐ it, this fragment is better characterized as having D3h
symmetry. Excited states were obtained as vertical excited states at each point. The obtained potential curves are shown in Figure 1.
The ground state curve has a typical dissociation profile for a bonded species. Along this dissociation curve, the
character of the molecular orbitals smoothly changes. The orbital, for instance, changes to a Cl n(3p(Cl)) orbital, whereas the orbital becomes the CH3 2p orbital. The
main configuration of the lowest state changes from a closed shell, doubly occupied configuration, to the (n(Cl))1(2p(C))1 configuration, which better characteriz‐ es this state at the dissociation limit. The 11E state also changes its character from ne* (which is dominant at the equilibrium geometry) to the (ne(Cl))1(2p(C))1, accompa‐ nying the change on the orbital character and leading to the same dissociation limit as that observed for the 11A1 curve, namely the CH3(X2A2´´) + Cl(2P) dissociation (see Figure 1).
Four other dissociation limits are observed, which can be assigned to the CH3(3s 2A1´) + Cl(2P) (in Figure 1, the
21E and 31A
1 curves), CH3(3p 2E´) + Cl(2P) (the 41A1, 31E, 41E,
and 11A2 curves), CH3(3p 2A2´´) + Cl(2P) (the 51E and 51A1
curves), and the ion‐pair state CH3+(1A1´) + Cl(1S) (the 21A1
curve). These dissociation limits are justified by the con‐ nection between the dominant configurations assigned
5 vertically at the equilibrium distance and those obtained
for each state at larger displacements (10 Å).
Along the 21E curve the main configuration is the ne3s,
evolving into the (ne(Cl))1(3s(C))1 configuration at dis‐
placements larger than 5 Å, and asymptotically leading to the CH3(3s 2A1´) + Cl(2P) dissociation limit. The 31A1 po‐
tential curve, for which the 3s character changes to the (n(Cl))1(3s(C))1 as the C – Cl distance increases, also tends to the same dissociation limit. The 41A1 state chang‐
es from 3p to the (ne(Cl))1(3pe(C))1 configuration at
larger displacements, while the 31E and 11A2 states change
from ne3pe configuration to (ne(Cl))1(3pe(C))1, and the 41E
changes from ne3p to (n(Cl))1(3pe(C))1; all four states go
asymptotically to the CH3(3p 2E´) + Cl(2P) dissociation
limit. Finally, the 51A1(CH*) and 51E (3pe) states change,
respectively, to the (n(Cl))1(3p(C))1 and (ne(Cl))1(3p(C))1 configurations at larger displacements,
yielding the CH3(3p 2A2´´) + Cl(2P) dissociation limit.
No significant differences are observed for the potential energy profiles calculated at the MR‐CISD level with the aug‐cc‐pVDZ(Cl,H)/d‐aug‐cc‐pVDZ (C) and the aug‐cc‐ pVTZ(Cl,H)/d´´‐aug´‐cc‐pVTZ (C) basis sets, as shown in Figure 2. Minor differences are only observed at the avoided crossing between the 31A1 and 41A1 states, which is
slightly higher at the TZ basis set and displaced from ~2.4 Å to 3.0 Å. The TZ profiles also show a non‐physical dis‐ continuity in the 11A2 curve. Small deviations (~0.25 eV)
are obtained at the edge of the curves calculated at the MR‐CISD level with the aug‐cc‐pVDZ(Cl,H)/d‐aug‐cc‐ pVDZ (C) and the aug‐cc‐pVTZ(Cl,H)/d´´‐aug´‐cc‐pVTZ (C) basis sets, as can be seen in Figure 2.
Figure 1. Potential energy curves obtained at the MR‐CISD level with the aug‐cc‐pVDZ(Cl,H)/d‐aug‐cc‐pVDZ (C) basis set.
Figure 2. Detailed view of the potential energy curves obtained at the MR‐CISD level with (A) aug‐cc‐pVDZ(Cl,H)/d‐aug‐cc‐ pVDZ(C) and (B) aug‐cc‐pVTZ(Cl,H)/d´´‐aug´‐cc‐pVTZ(C) basis sets. The arrows indicate the two geometrical spots with multi‐ ple crossings.
Several avoided crossings are observed in these poten‐ tial curves, yielding changes on the configurations of the states and leading to different photodissociation chan‐
nels. A detailed discussion of these crossings is done be‐ low, based on the results obtained with the aug‐cc‐
6 pVDZ(Cl,H)/d‐aug‐cc‐pVDZ(C) basis set, for which more points have been calculated. 1 E Curves: The potential energy profiles with emphasis on the 1E curves are shown in Figure 3. Three main cross‐ ings are observed, between the 11E and 21E states at ca 1.8
Å, between the 21E and 41E states at 2.0 Å, and between the 41E and 51E states at 3.3 Å. Configuration exchanges are indicated for two of these crossings in the figure.
The avoided crossing between the 11E and 21E states is characterized by the exchange between the ne* and
ne3s(C) configurations, with some influence of the
ne3p(C) configuration too. As the C – Cl distance in‐
creases, the weight of the ne3p(C) configuration decreas‐
es in the 21E state, which is dominated by the ne3s(C)
configuration from 2.2 Å on.
Figure 3. Detailed view of the potential energy curves for the
1E states, obtained at the MR‐CISD level with aug‐cc‐
pVDZ(Cl,H)/d‐aug‐cc‐pVDZ basis set. Configurations in‐ volved in the main avoided crossings are indicated.
A large‐gap avoided crossing (not explicitly indicated in Figure 3) takes place between the 21E and 41E states at 2.0 Å, characterized by the exchange between the ne3p(C)
and ne3s(C) configurations. For displacements larger than
2.2 Å, the 41E state is better represented by the ne3p(C)
configuration. This configuration can be viewed as a con‐ taminating configuration in the 11E and 21E states, which can be justified on symmetry grounds. The final ne* and
ne3s(C) configurations for the 11E and 21E states are re‐
sponsible for the CH3(X2A2´´) + Cl(2P) and CH3(3s 2A1´) +
Cl(2P) dissociation channels (see Figure 1). Additional details concerning the configurations around the 11E/21E and 21E/41E avoided crossings are given in the Supporting
Information.
In the avoided crossing between the 41E and 51E states, the (ne3p) and (nσ3pe) dominant configurations are in‐
terchanged. After the avoided crossing, the 41E curve (now with the dominant (nσ3pe) configuration) dissoci‐
ates as CH3(3p 2E´) + Cl(2P) and the 51E curve (ne3p)
yields (along with the 51A 1 state) the CH3(3p 2A2´´) + Cl(2P) channel (see Figure 1). Figure 4. Detailed view of the potential energy curves for the 1A
1 states, obtained at the MR‐CISD level with aug‐cc‐
pVDZ(Cl,H)/d‐aug‐cc‐pVDZ basis set. An avoided crossing is indicated by dotted lines. The vertical dotted line indicates the 1A1 states at the experimental C – Cl distance.
Jahn‐Teller effect in the 11E and 21E states: As dis‐
cussed above, an avoided crossing between the 11E and 21E states takes place at 1.8 Å, slightly before the equilibrium distance (see Figure 3). As both states have E representa‐ tion, they are subject to the Jahn‐Teller effect. Excitation to the 11E state, which at the equilibrium geometry corre‐ sponds to an nσ* state, should induce symmetry‐breaking vibrational movements, lowering the symmetry from C3v
to Cs.11 However, both 21A´ and 11A´´ states are highly
repulsive along the C – Cl coordinate. Thus, departure from C3v symmetry hardly affects the CH3 + Cl dissocia‐
tion channel, as at very large distances the degeneracy is recovered. Besides, it is clear from Figure 1 that they also become degenerate with the 11A´ state due to the equiva‐ lence between the three Cl lone pairs orbitals.
On the other hand, the Jahn‐Teller effect in the 21E (n3s) state may play a different role in the appearance of the CH3 + Cl dissociation channel. As in the case of 11E state,
vertical excitation to 21E also leads to Cs symmetry. Con‐
sequently, an energy splitting of the 1A´ and 1A´´ compo‐ nents of both 11E and 21E states can yield a crossing be‐ tween the 31A´ and 11A´´ states, as at C
3v symmetry the
energy difference between the 11E and 21E states is already small (~0.3 eV, see Figure 3). Such crossing is actually a conical intersection which, after full geometry optimiza‐ tion, leads to the structure shown in the Supporting In‐ formation, where this conical intersection is discussed in detail.
7
1
A1 curves: Figure 4 delivers a detailed view of the 1A1
potential energy curves. Avoided crossings between the 21A1 and 31A1 and between the 31A1 and 41A1 states are ob‐
served around 2.1 and 2.4 Å, respectively.
At 1.7 Å, the dominant configurations of the 41A1, 31A1,
and 21A1 states are σ3pσ, σ3s, and ne3pe, respectively, alt‐
hough the former also shows minor contribution of the σσ* excitation. The first observed change of configura‐ tions is between the 41A
1 and 31A1 states (around 1.9 Å),
where the weight of the σσ* excitation increases in the wave function of the 31A1 state. An avoided crossing is
then observed between the 31A1 and 21A1 states around 2.1
Å, from which the σσ* character is transferred to the 21A1
state. Moreover, around 2.4 Å, the 31A
1 and 41A1 states
exchange characters again, the former gaining (nσ
(Cl))1(3s(C))1 character, whereas the latter becomes a ne3pe state, which originally was the main component of
the 21A1 state.
The σσ* character remains dominant in the 21A1 state up
to approximately 2.6 Å (not shown in Figure 4), where the
closed shell configuration, formerly observed in the 11A1
(ground state), mixes with the σσ* excitation. A broad avoided crossing is observed between these states. In the region from 2.7 – 3.0 Å, the shapes and characters of or‐ bitals are also changing, from the σ and σ* molecular orbitals to Cl nσ(3pσ(Cl)) and 2pσ(CH3) orbitals. The σσ*
and the closed shell configurations are, in this region, better characterized as (nσ(Cl))1(2pσ(CH3))1 and
(nσ(Cl))2(2pσ(CH3))0, respectively. After the avoided cross‐
ing, these are the dominant configurations in 11A1 and 21A1
states, leading to the homolytic ground state dissociation (curve 11A1 in Figure 1) and to the CH3+∙∙∙Cl complex for‐
mation (as it will be discussed later), which further disso‐ ciates into CH3+ and Cl
ions (curve 21A1 in Figure 1).
At very large distances (~15 Å) there is an avoided cross‐ ing between the 21A1 and 31A1 states. Thus, after 15 Å, one
has 21E and 21A1 dissociating as CH3(3s 2A1´) + Cl(2P), while
31A
1 correlates with the CH3+(1A1´) + Cl (1S) dissociation channel (see Table 2 and Figure 5). Figure 5. Avoided crossing between the 21A1 and 31A1 states. (A) General overview. (B) Detailed view. The dissociation
channels involving these two states are also shown. Before the avoided crossing 31A
1 is degenerate with 21E, while after it
becomes degenerate with 21A1 (see Figure 1).
Dissociation limits: Dissociation limits were deter‐
mined from the potential curves extended to 50 Å, rela‐ tive to the calculated ground state energy at the experi‐ mental geometry. This large displacement was adopted to guarantee a negligible interaction between the fragments, which is especially important for the ionic dissociation limit due to the Coulomb attractive potential. Neverthe‐ less, the relative energy for the latter (taken from the potential energy curve) was further corrected by the R‐1 Coulomb term (which is 0.29 eV at 50 Å).
The ground state dissociation energy has been deter‐ mined by Chen and coworkers as 3.59 eV.53 The CH3Cl
and CH3 vibrational zero point energies (ZPE), as com‐
puted at MR‐CISD level with the aug‐cc‐pVTZ(Cl,H)/d‐ aug‐cc‐pVTZ(C) basis set, are 8544 and 6529 cm‐1, respec‐ tively, yielding an estimate of 3.84 eV for the corrected ground state dissociation limit. Our calculated dissocia‐ tion limit, at the MR‐CISD+Q level with the mixed aug‐ cc‐pVTZ(Cl,H)/d‐aug‐cc‐pVTZ(C) basis set, is 3.70 eV, which is in very good agreement with the value of 3.84 eV.
8 The energies of the CH3(3s 2A1´) + Cl(2P), CH3(3p2E´) +
Cl(2P), and CH3(3p2A2´´) + Cl(2P) dissociation channels
can be obtained from the vertical excitation energies of the CH3 radical. These latter energies have been comput‐
ed by Mebel and Lin as 5.86, 6.95, and 7.37 eV (X
2
A2´´→3s 2A1´, X2A2´´→3p2E´, and X2A2´´→3p2A2´´,
respectively).33 Later, Bauerfeldt and Lischka reported values of 5.81 and 7.07 eV, at the MR‐CISD+Q/d‐aug‐cc‐ pVDZ level, for theX2
A2´´→3s 2A1´ and X2A2´´→3p2A2´´
excitations,54 in good agreement with the aforementioned
results.33 As the most complete set of results has been reported by Mebel and Lin, their values are taken for comparison. By summing their results with the corrected experimental ground state dissociation energy (3.84 eV), the CH3(3s 2A1´) + Cl(2P), CH3(3p2E´) + Cl(2P), and CH3(3p 2
A2´´) + Cl(2P) dissociation limits can be predicted as 9.70,
10.79, and 11.21 eV. At the MR‐CISD+Q level, our calculat‐ ed values for the corresponding dissociation limits are 9.50, 10.76, and 11.01 eV, which agree well with the refer‐ ence values.
Literature data for the CH3 vertical ionization energy
and for the chlorine atom electron affinity were used to predict the reference value for the CH3+(1A1´) + Cl(1S)
dissociation limit. The vertical ionization energy of CH3
has been determined by Houle and Beauchamp as 9.84 eV.55 The Cl electron affinity, 3.61 eV, was taken from NIST.56 Using these values along with the corrected
ground state dissociation energy (3.84 eV), the ionic dis‐ sociation limit is predicted as 10.07 eV, while the calculat‐
ed value at the MR‐CISD+Q level with the aug‐cc‐ pVTZ(Cl,H)/d‐aug‐cc‐pVTZ(C) basis set is 10.08 eV.
The results for dissociation limits and literature data are summarized in Table 2, holding very good agreement with the reference values.
Characterization of the CH3+∙∙∙Cl
and H2CH+∙∙∙Cl
complexes: An analysis of the 21A1 curve in Figure 1 sug‐
gests that a stationary point correlating with the CH3+ +
Cldissociation should be found at ca. 3.4 Å. To assess its structure, a full geometry optimization under Cs sym‐
metry restrictions has been performed at the MR‐CISD level. It converged to a CH3+∙∙∙Cl
electrostatic complex with a C3v geometry in which the C – Cl axis lies perpen‐
dicular to the plane containing the CH3 fragment (the C –
Cl distance is 3.298 Å, see Figure 6). This complex is strongly bound by 3.69 eV (MRCI+Q; ZPE corrected) with respect to the CH3+(1A1´) + Cl(1S) dissociation limit.
A normal mode analysis showed that this electrostatic complex is not a minimum and has two imaginary fre‐ quencies (322i and 321i cm‐1). After following the normal modes corresponding to those imaginary frequencies, a new geometry optimization revealed the true minimum, a H2CH+∙∙∙Cl complex. This latter complex has C2v sym‐
metry and is also shown in Figure 6. A similar complex was observed for the CH3F molecule, as reported by Bau‐
erfeldt and Lischka.54
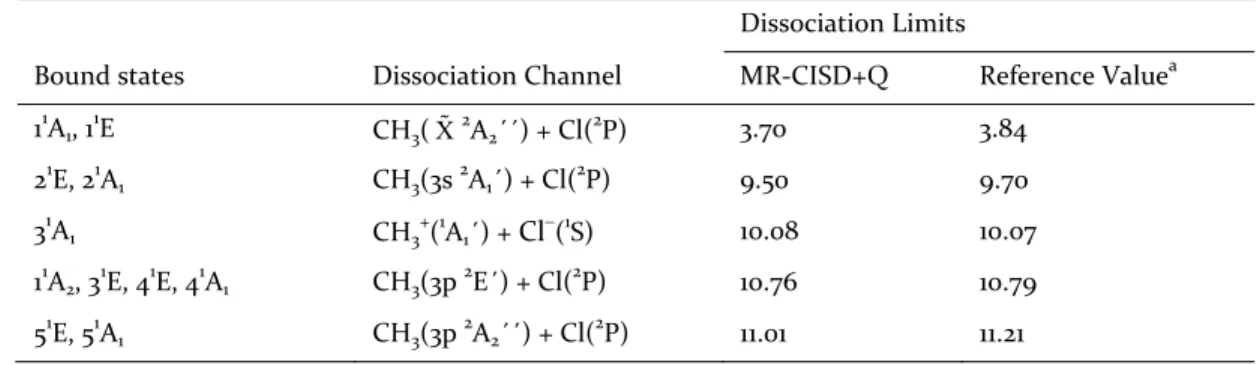
Table 2. Dissociation limits calculated at the MR‐CISD+Q level with the mixed aug‐cc‐pVTZ (Cl,H)/d‐aug‐cc‐ pVTZ(C) basis set. All values are expressed in eV.
Dissociation Limits
Bound states Dissociation Channel MR‐CISD+Q Reference Valuea 11A1, 11E CH3( X 2A2´´) + Cl(2P) 3.70 3.84
21E, 21A1 CH3(3s 2A1´) + Cl(2P) 9.50 9.70
31A1 CH3+(1A1´) + Cl(1S) 10.08 10.07
11A2, 31E, 41E, 41A1 CH3(3p 2E´) + Cl(2P) 10.76 10.79
51E, 51A1 CH3(3p 2A2´´) + Cl(2P) 11.01 11.21 a
See text for details.
Figure 6. Structures of CH3Cl ground state (left) and of the
CH3+∙∙∙Cl (center) and H2CH+∙∙∙Cl (right) complexes. Bond
distance values are in Å. The structures have been obtained at the MR‐CISD level with the aug‐cc‐pVTZ(Cl,H)/d‐aug‐cc‐ pVTZ(C) basis set. In the H2CH+∙∙∙Cl complex, the C – Cl and C – H´ dis‐ tances are 3.044 and 1.152 Å. The ClCH´ angle is 0.0o. The C – H distances are 1.082 Å and the HCH and HCH´ an‐ gles are 116.5o and 121.7o, respectively. The following vibra‐ tional frequencies were obtained for the H2CH+∙∙∙Cl com‐
plex: 3330, 3251, 2346, 1536, 1481, 1425, 796, 434, and 277 cm‐1. The Cl – H´ distance of 1.892 Å in the complex is much longer than the 1.275 Å of the bound HCl,57 but
9 much still shorter than 2.95 Å, the sum of van der Waals
radii of H and Cl.
At the geometry corresponding to the CH3+∙∙∙Cl elec‐
trostatic complex (the minimum of the 21A
1 curve in Fig‐
ure 1), a reasonably high admixture between closed‐shell ionic and * configurations has been obtained: 0.59(n(Cl))2 + 0.25*. However, for the H2CH+∙∙∙Cl
complex (which is a minimum in the 31A´ surface), such admixture is significantly reduced: 0.75(n(Cl))2 + 0.11*. Both species are very polar. In particular, the H2CH+∙∙∙Cl
complex has dipole moment of 10.41 D (MR‐CISD level) and large charge separation; it can be described as (H2CH)+ ∙∙∙Cl, with = 0.88 (from Mulliken’s popula‐
tion analysis).
The H2CH+∙∙∙Cl complex lies 4.88 eV above the ground
state (CH3Cl(11A1)) and is strongly bound by 4.65 eV
(MRCI+Q; ZPE corrected) with respect to the CH3+(1A1´) +
Cl(1S) dissociation limit. (The total energies of the H2CH+∙∙∙Cl
complex at the MR‐CISD and MR‐CISD+Q levels, with the aug‐cc‐pVTZ(H,Cl)/d‐aug‐cc‐pVTZ(C) basis set, are ‐499,3262452 and ‐499,3809926 hartrees, respectively). The CH∙∙∙Cl hydrogen bond: We have seen that along the 21A 1 state, a CH3+∙∙∙Cl electrostatically bound complex is formed. Upon rotational relaxation, it gives origin to a H2CH+∙∙∙Cl complex, 0.96 eV more stable. In this latter
geometry, the linearity of the CH∙∙∙Cl atoms arrangement immediately poses the question whether there is a hydro‐ gen bond contributing to hold the H2CH+∙∙∙Cl complex
together. This is not a straight forward question to answer first because we are dealing with a ion‐pair where the electrostatic attraction naturally overpowers the dipole‐ induced dipoles; second, we are dealing with electronical‐ ly excited species; third, as we discuss in the Introduction, CH∙∙∙Cl hydrogen bonds are rare and restricted to mole‐ cules very different from that we investigate here.
We have, therefore, tackled the problem from a formal perspective. In 2011, IUPAC has proposed an updated definition of hydrogen bond, flexible enough to encom‐ pass the large variety of bonds that lies under this catego‐ ry.58,59 It has also proposed a series of criteria that a bond should satisfy to be characterized as hydrogen bond. In the Supporting Information, we analyze the CH∙∙∙Cl bond in the H2CH+∙∙∙Cl complex against this definition and
each of these criteria, and show that it may be character‐ ized as a hydrogen bond. In fact, to be more precise, the bond holding the H2CH+∙∙∙Cl complex together is primar‐
ily a monopole‐monopole bond, with additional (strong) stabilization due to an underlying CH∙∙∙Cl hydrogen bond. All reported cases of CH∙∙∙Cl hydrogen bonds so far take place within sterically restricted environments of crystals and molecular cavities. In the case of the H2CH+∙∙∙Cl
complex, the monopole‐monopole interaction plays the same role as those steric interactions, holding together
the bonded groups allowing the CH∙∙∙Cl stabilization. In terms of the chemical leitmotif described by Gilli and Gilli,60 this bond can be considered a double‐charge as‐ sisted hydrogen bond.
Nonadiabatic relaxation and formation of Cl: The
connection between previously reported experimental results related to the ionic dissociation channel and the theoretical results obtained in this work is worthy of at‐ tention. As already mentioned, the Clcross section peaks in the region from 10.5 – 11.9 eV.23 Moreover, the chloride
anion channel was shown to prevail over the appearance of other possible anions. Based on the theoretical results, we may propose the following formation mechanism for Cl.
The Cl elimination should start with photoexcitation of CH3Cl into the 41A1 state, a bright state with 0.340 oscil‐
lator strength and 11.42 eV vertical excitation according to MR‐CISD+Q (see Table 1). The system should then quick‐ ly relax by stretching the C – Cl distance to 2.5 Å (see Figure 1). There, a cascade of nonadiabatic processes starts, bringing the molecule to lower excited states. From Figure 1, we see that there are two main spots for this nonadiabatic cascade: 1) the multiple crossings between 41A1, 31A1, 41E, 11A2, and 31E states occurring at ~2.4 Å; and
2) the multiple crossings between 11A 2, 31E, and 21A1 states at ~1.8 Å. These two spots are indicated by arrows in Fig‐ ure 2‐A. Following this deactivation process, all five dissociation channels can be populated. The fraction of the population that ends up in the 21A1 state may form the
CH3+∙∙∙Clelectrostatic complex and finally dissociate
along the CH3+ + Cl channel. The H2CH+∙∙∙Cl complex
should not be formed because of the large excess of the vibrational energy in the 21A1 state.
The origin of the cross section at 10 eV (see Figure 4(b) from ref.23) matches very well our dissociation limit for the 21A1 ion‐pair state (10.08 eV, Table 2). The vibrational
structure in this experimental band also indicates that bound states are populated during the predissociation. These bound states should mainly be the 41A1 state (which
is initially photoexcited), along with the 31A1 and 51E
states. All these three states have clear wells with minima above 9.3 eV (Figure 1). The fading of the vibrational structure at ~11 eV also corroborates this assignment, matching our calculated dissociation limit at 10.76 eV (Table 2). If the bound state were the 41E, the spectrum would start at ~9 eV; if it were the 21E, we would not see any vibrational progression because of the dissociation limit at 9.5 eV.
Detection of the H2CH+∙∙∙Cl complex: We have
shown that the H2CH+∙∙∙Cl complex is very stable. How‐
ever, because its minimum geometry is much displaced in relation to the Franck‐Condon region, we should not expect a vibrationally resolved band in the absorption
10 spectrum of CH3Cl around 6 eV, the bottom of 21A1 state.
Indeed, no sign of vibrational structure corresponding to this complex can be seen in the experimental absorption spectrum (see, for instance, Figure 2 from ref.21).
Alternatively, the H2CH+∙∙∙Cl complex may be detecta‐
ble by time‐resolved spectroscopy. This is still not trivial because, due to the same displacement of the minimum, it should not be possible to directly excite the 21A1 from
the ground state. Therefore, as schematically depicted in Figure 7, the detection of the H2CH+∙∙∙Cl
complex may require a sequence of three femtosecond‐resolved laser pulses, to indirectly excite and probe the 21A1 state.
The first pulse (h1 ~ 7 eV) should excite the 11E band.
After a short delay (1), probably inferior to 100 fs, the
second pulse (h2 ~3eV) should populate the 21A1 state,
where the H2CH+∙∙∙Cl
complex is formed. Finally, the third pulse delayed by 2 should ionize the complex. Tak‐
ing into account that the ionization potential of CH3Cl is
11.29 eV,11 a third pulse set to h3 ~5 eV will probe only the
complex. Such a three pulses scheme should make CH3Cl
a show case for femtosecond 2D Fourier transform spec‐ troscopy.61
Figure 7. Scheme of a sequence of three time‐resolved ultra‐ short laser pulses for detection of the H2CH+∙∙∙Cl complex.
Only the relevant states are shown.
■
CONCLUSION
For the first time, highly correlated electronic structure calculations (MR‐CISD) have been performed to elucidate the CH3Cl photodissociation pathways. The yielded po‐
tential energy curves, along with complementary energet‐ ic data, can be the grounds for a comprehensive assign‐ ment and interpretation of the experimental data con‐ cerning the electronic states of the generated photofrag‐ ments.
Five dissociation channels along the C – Cl coordinate have been identified and characterized: i) CH3(X2A2´´) +
Cl(2P), ii) CH
3(3s2A1´) + Cl(2P), iii) CH3+(1A1´) + Cl
(1S), iv)
CH3(3p 2E´) + Cl(2P), and v) CH3(3p 2A2´´) + Cl(2P). The
first channel can be accessed through n* and n3s states, while the second channel can be accessed through ne3s,
ne3p, and 3s states. The third channel, corresponding to
an ion‐pair formation, is accessed through ne3pe states.
The fourth is accessed through ne3pe, ne3p, and 3p,
while the fifth through 3pe and CH* states. Their rela‐
tive dissociation limits deviate by at most 0.2 eV from previously reported data.
Our theoretical analysis provides a complete rationali‐ zation for the nonadiabatic relaxation of CH3Cl and, in
particular, the formation mechanism of Clafter photoex‐ citation. It confirms the assumption made by Rogers et
al.23 that chloride anion is formed indirectly by crossing
Rydberg states of the parent molecule until the ion‐pair surface is reached. We discuss that there are two geomet‐ rical spots at C – Cl distances of 1.8 and 2.4 Å, where mul‐ tiple state intersections should promote a cascade of nonadiabatic events, bringing the molecule to lower ex‐ cited states and feeding the diverse channels.
Finally, we show that along the ion‐pair state (21A1), a
strongly bound CH3+∙∙∙Cl electrostatic complex is formed
at C – Cl distance of 3.3 Å. Upon rotational relaxation, this complex is further stabilized by a CH∙∙∙Cl double‐charge‐ assisted hydrogen bond, giving rise to a H2CH+∙∙∙Clcomplex. Based on the theoretical results, a
three‐pulses time‐resolved spectroscopic setup is suggest‐ ed to detect the H2CH+∙∙∙Cl complex. ASSOCIATED CONTENT Supporting Information: Conical intersection between the nσ* and n3s states; analysis of the avoided crossings; analysis of the CH∙∙∙Cl bond; Cartesian coordinates of all species. This material is available free of charge via the Internet at
http://pubs.acs.org. AUTHOR INFORMATION Corresponding Authors * M. Barbatti (mario.barbatti@univ‐amu.fr) * S. A. do Monte (silmar@quimica.ufpb.br). ACKNOWLEDGMENT
The authors are thankful to CNPq and CAPES for financial support. MB thanks the support of the A*MIDEX grant (n° ANR‐11‐IDEX‐0001‐02) funded by the French Government « Investissements d’Avenir » program.
■
REFERENCES
(1) Molina, M. J.; Rowland, F. S. Nature 1974, 249, 810–812. (2) Rowland, F. S.; Molina, M. J. Science 1975, 190, 1038. (3) Khalil, M. A. K. The handbook of environmental chemistry, Part 4E, Reactive Halogen Compounds in the Atmosphere; Febian, P., Singh, O. N., Eds.; Springer, 1999.
(4) Hamilton, J. T. G.; McRoberts, W. C.; Keppler, F.; Kalin, R. M.; Harper, D. B. Science (New York, N.Y.) 2003, 301, 206–209.
11
(5) Lucena, J. R.; Ventura, E.; do Monte, S. A.; Araújo, R. C. M. U.; Ramos, M. N.; Fausto, R. Journal of Chemical Physics 2007, 127, 164320–164331.
(6) Medeiros, V. C. de; Ventura, E.; do Monte, S. A.
Chemical Physics Letters 2012, 546, 30–33.
(7) Granucci, G.; Medders, G.; Maria, A. Chemical Physics
Letters 2010, 500, 202–206.
(8) Yen, M.; Johnson, P. M.; White, M. G. Journal of
Chemical Physics 1993, 99, 126–139.
(9) Mayor, E.; Velasco, A. M.; Martín, I. Journal of Physical
Chemistry A 2004, 108, 5699–5703.
(10) Gilbert, R.; Sauvageau, P.; Sandorfy, C. The Journal of
Chemical Physics 1974, 60, 4820–4824.
(11) Locht, R.; Leyh, B.; Hoxha, A.; Jochims, H. W.; Baumgärtel, H. Chemical Physics 2001, 272, 259–275.
(12) Kawasaki, M.; Kasatani, K.; Sato, H.; Shinohara, H.; Nishi, N. Chemical Physics 1984, 88, 135–142.
(13) Brownsword, R. A.; Hillenkamp, M.; Laurent, T.; Vatsa, R. K.; Volpp, H.‐R.; Wolfrum, J. Journal of Chemical Physics 1997,
106, 1359–1366.
(14) Matsumi, Y.; Das, P. K.; Kawasaki, M. Journal of
Chemical Physics 1992, 97, 5261–5261.
(15) Matsumi, Y.; Das, P. K.; Kawasaki, M. Journal of
Chemical Physics 1990, 92, 1696–1701.
(16) Matsumi, Y.; Tonokura, K.; Kawasaki, M.; Inoue, G.; Satyapal, S.; Bersohn, R. Journal of Chemical Physics 1991, 94, 2669–2674.
(17) Tonokura, K.; Matsumi, Y.; Kawasaki, M.; Kasatani, K.
Journal of Chemical Physics 1991, 97, 5065–5071.
(18) Tonokura, K.; Mo, Y.; Matsumi, Y.; Kawasaki, M.
Journal of Physical Chemistry 1992, 96, 6688–6693.
(19) Lin, J. J.; Chen, Y.; Lee, Y. Y.; Lee, Y. T.; Yang, X.
Chemical Physics Letters 2002, 361, 374–382.
(20) Amaral, G.; Xu, K.; Zhang, J. Journal of Physical
Chemistry A 2001, 105, 1115–1120.
(21) Eden, S.; Limão‐Vieira, P.; Hoffmann, S. V.; Mason, N. J. Chemical Physics 2007, 331, 232–244.
(22) De Medeiros, V. C.; do Monte, S. A.; Ventura, E. RSC
Adv. 2014, 4, 64085–64092.
(23) Rogers, N. J.; Simpson, M. J.; Tuckett, R. P.; Dunn, K. F.; Latimer, C. J. Physical Chemistry Chemical Physics: PCCP 2010, 12, 10971–10980.
(24) Simpson, M. J.; Tuckett, R. P. International Reviews in
Physical Chemistry 2011, 30, 197–273.
(25) Zhong, Y. R.; Cao, M. L.; Mo, H. J.; Ye, B. H. Cryst.
Growth Des. 2008, 8, 2282–2290.
(26) Thallapally, P. K.; Nangia, A. Cryst Eng Comm 2001, 3, 114–119.
(27) Taylor, R.; Kennard, O. J Am Chem Soc 1982, 104, 5063– 5070.
(28) Aakeroy, C. B.; Evans, T. A.; Seddon, K. R.; I., P. New
Journal Chemistry 1999, 23, 145–152.
(29) Yamabe, S.; Yamazaki, S. J Phys Org Chem 2009, 22, 1094–1103.
(30) Li, Y.; Flood, A. H. Angew. Chem. Int. Ed. 2008, 47, 2649–2652.
(31) Tresca, B. W.; Zakharov, L. N.; Carroll, C. N.; Johnson, D. W.; Haley, M. M. Chem. Commun. 2013, 49, 7240–7242.
(32) Antol, I.; Eckert‐Maksić, M.; Müller, T.; Dallos, M.; Lischka, H. Chemical Physics Letters 2003, 374, 587–593.
(33) Mebel, A. M.; Lin, S. Chemical Physics 1997, 215, 329– 341.
(34) Bunge, A. The Journal of Chemical Physics 1970, 53, 20–28. (35) Langhoff, S. R.; Davidson, E. R. International Journal of Quantum Chemistry 1974, 8, 61–72. (36) Bruna, P. J.; Peyerimhoff, S. D.; Buenker, R. J. Chemical Physics Letters 1980, 72, 278–284. (37) Lischka, H.; Shepard, R.; Brown, F. B.; Shavitt, I. Int. J. Quantum Chem., Quantum Chem. Symp 1981, 15, 91.
(38) Shepard, R.; Shavitt, I.; Pitzer, R. M.; Comeau, D. C.; Pepper, M.; Lischka, H.; Szalay, P. G.; Ahlrichs, R.; Brown, F. B.; Zhao, J. Int. J. Quantum Chem., Quantum Chem. Symp. 1988, 22, 149–165.
(39) Lischka, H.; Shepard, R.; Shavitt, I.; Pitzer, R. M.; Dallos, M.; Müller, T.; Szalay, P. G.; Brown, F. B.; Ahlrichs, R.; Böhm, H. J.; Chang, A.; Comeau, D. C.; Gdanitz, R.; Dachsel, H.; Ehrhardt, C.; Ernzerhof, M.; Höchtl, P.; Irle, S.; Kedziora, G.; Kovar, T.; Parasuk, V.; Pepper, M. J. M.; Scharf, P.; Schiffer, H.; Schindler, M.; Schüler, M.; Seth, M.; Stahlberg, E. A.; Zhao, J.‐G.; Yabushita, S.; Zhang, Z.; Barbatti, M.; Matsika, S.; Schuurmann, M.; Yarkony, D. R.; Brozell, S. R.; Beck, E. V; Blaudeau, J.‐P.; Ruckenbauer, M.; Sellner, B.; Plasser, F.; Szymczak, J. J., COLUMBUS, an ab‐initio electronic structure program, release 7.0, 2012.
(40) Lischka, H.; Shepard, R.; Pitzer, R. M.; Shavitt, I.; Dallos, M.; Müller, T.; Szalay, P. G.; Seth, M.; Kedziora, G. S.; Yabushita, S.; Zhang, Z. Physical Chemistry Chemical Physics 2001, 3, 664–673.
(41) Helgaker, T.; Jensen, H. J. A.; Jørgensen, P.; Olsen, J.; Ruud, K.; Agren, H.; Andersen, T.; Bak, K. L.; Bakken, V.; Christiansen, O.; Dahle, P.; Dalskov, E. K.; Enevoldsen, T.; Fernandez, B.; Heiberg, H.; Hettema, H.; Jonsson, D.; Kirpekar, S.; Kobayashi, R.; Koch, H.; Mikkelsen, K. V.; Norman, P.; Packer, M. J.; Saue, T.; Taylor, P. R.; Vahtras, O., DALTON, an ab‐initio
electronic structure program, release 1.0, 1997.
(42) Dunning, T. H. The Journal of Chemical Physics 1989,
90, 1007–1023.
(43) Dunning T.H., J.; Peterson, K. a.; Wilson, a. K. Journal
of Chemical Physics 1993, 98, 1358–1371.
(44) Kendall, R.; Jr., Dunnin, T.; Harrison, R. Journal of
chemical physics 1992, 96, 6796–6806.
(45) Woon, D. E.; Dunning Jr., T. H. The Journal of
Chemical Physics 1994, 100, 2975–2988.
(46) Shepard, R. Int. J. Quant. Chem. 1987, 31, 33–44. (47) Shepard; R.; Lischka; H.; Szalay; G, P.; Kovar; T.; Ernzerhof; M. J. Chem. Phys. 1992, 96, 2085–2098.
(48) Shepard, R. In Modern Electronic Structure Theory Part
I; Yarkony, D. R., Ed.; World Scientific, Singapore, 1995; p 345.
(49) Lischka, H.; Dallos, M.; Shepard, R. Molecular Physics 2002, 100, 1647–1658.
(50) Lischka, H.; Dallos, M.; Szalay, P. G.; Yarkony, D. R.; Shepard, R. Journal of Chemical Physics 2004, 120, 7322–7329.
(51) Dallos, M.; Lischka, H.; Shepard, R.; Yarkony, D. R.; Szalay, P. G. Journal of Chemical Physics 2004, 120, 7330–7339
(52) Jensen, P.; Brodersen, S.; Guelavich, G. Journal of Molecu‐
lar Spectroscopy 1981, 88, 378‐393.
(53) Chen, E. C. M.; Albyn, K.; Dussack, L.; Wentworth, W. E. Journal of Physical Chemistry 1989, 93, 6827–6832.
(54) Bauerfeldt, G. F.; Lischka, H. Journal of Physical
Chemistry A 2004, 108, 3111–3118.
(55) Houle, F. A.; Beauchamp, J. L. Journal of the American
Chemical Society 1979, 101, 4067–4074.
(56) NIST Computational Chemistry Comparison and Benchmark Database NIST Standard Reference Database Number 101 Release 16a, August 2013, Editor: Russell D. Johnson III . http://cccbdb.nist.gov/.
12
(57) Huber, K. P.; Herzberg, G. Molecular Spectra and Molecular Structure. IV. Constants of Diatomic Molecules. van Nostrand Reinhold Co; New York, 1979.
(58) Arunan, E.; DesirajuGautam, R.; Klein Roger, A.; Sadlej, J.; Scheiner, S.; Alkorta, I.; Clary David, C.; Crabtree Robert, H.; Dannenberg Joseph, J.; Hobza, P.; Kjaergaard Henrik, G.; Legon Anthony, C.; Mennucci, B.; Nesbitt David. J Pure Appl. Chem. 2011, 83, 1619–1636.
(59) Arunan, E.; DesirajuGautam, R.; Klein Roger, A.; Sadlej, J.; Scheiner, S.; Alkorta, I.; Clary David, C.; Crabtree Robert, H.; Dannenberg Joseph, J.; Hobza, P.; Kjaergaard Henrik, G.; Legon Anthony, C.; Mennucci, B.; Nesbitt David. J. Pure Appl. Chem. 2011, 83, 1637–1641. (60) Gilli, P.; Gilli, G. J. Mol. Struct. 2010, 972, 2–10. (61) Jonas, D. M. Annu. Rev. Phys. Chem. 2003, 54, 425–463. .