Multifactorial Analysis of Differences Between Sporadic Breast
Cancers and Cancers Involving BRCA1 and BRCA2 Mutations
Sunil R. Lakhani, Jocelyne Jacquemier, John P. Sloane, Barry A. Gusterson,
Thomas J. Anderson, Marc J. van de Vijver, Linda M. Farid, Deon Venter,
Antonios Antoniou, Amy Storfer-Isser, Elizabeth Smyth, C. Michael Steel, Neva Haites,
Rodney J. Scott, David Goldgar, Susan Neuhausen, Peter A. Daly, Wilma Ormiston,
Ross McManus, Siegfried Scherneck, Bruce A. J. Ponder, Debbie Ford, Julian Peto,
Dominique Stoppa-Lyonnet, Yves-Jean Bignon, Jeffery P. Struewing, Nigel K. Spurr,
D. Timothy Bishop, J. G. M. Klijn, Peter Devilee, Cees J. Cornelisse, Christine Lasset,
Gilbert Lenoir, Rosa Bjork Barkardottir, Valgardur Egilsson, Ute Hamann,
Jenny Chang-Claude, Hagay Sobol, Barbara Weber, Michael R. Stratton,
Douglas F. Easton*
Background: We have previously demonstrated that breast
cancers associated with inherited BRCA1 and BRCA2 gene
mutations differ from each other in their histopathologic
appearances and that each of these types differs from breast
cancers in patients unselected for family history (i.e.,
spo-radic cancers). We have now conducted a more detailed
ex-amination of cytologic and architectural features of these
tumors. Methods: Specimens of tumor tissue (5-µm-thick
sec-tions) were examined independently by two pathologists,
who were unaware of the case or control subject status, for
the presence of cell mitosis, lymphocytic infiltration,
con-tinuous pushing margins, and solid sheets of cancer cells; cell
nuclei, cell nucleoli, cell necrosis, and cell borders were also
evaluated. The resulting data were combined with previously
available information on tumor type and tumor grade and
further evaluated by multifactorial analysis. All statistical
tests are two-sided. Results: Cancers associated with BRCA1
mutations exhibited higher mitotic counts (P = .001), a
greater proportion of the tumor with a continuous pushing
margin (P<.0001), and more lymphocytic infiltration (P =
.002) than sporadic (i.e., control) cancers. Cancers associated
with BRCA2 mutations exhibited a higher score for tubule
formation (fewer tubules) (P = .0002), a higher proportion of
the tumor perimeter with a continuous pushing margin
(P<.0001), and a lower mitotic count (P = .003) than control
cancers. Conclusions: Our study has identified key features
of the histologic phenotypes of breast cancers in carriers of
mutant BRCA1 and BRCA2 genes. This information may
improve the classification of breast cancers in individuals
with a family history of the disease and may ultimately aid in
the clinical management of patients. [J Natl Cancer Inst
1998;90:1138–45]
*Affiliations of authors: S. R. Lakhani, Department of Histopathology,
Uni-versity College of London Medical School, U.K.; J. Jacquemier, H. Sobol, Departement d’Oncologie-Genetique et Laboratoire d’Anatomie et de Cytologie Pathologiques, Institut National de la Sante´ et de la Recherche Me´dicale CRI 9703, Institut Paoli-Calmettes, Marseille, France; J. P. Sloane, Department of Pathology, University of Liverpool, U.K.; B. A. Gusterson, D. Ford, J. Peto, M. R. Stratton, Sections of Cancer Genetics, Epidemiology, and Cell Biology and Experimental Pathology, Institute of Cancer Research, Haddow Laboratories, Sutton, Surrey, U.K.; T. J. Anderson, Department of Pathology, The University of Edinburgh Medical School, U.K.; M. J. van de Vijver, The Netherlands Cancer Institute, Antoni van Leeuwenhoek Huis, Amsterdam; L. M. Farid, De-partment of Pathology and Laboratory Medicine, University of Pennsylvania Medical Center, Philadelphia; D. Venter, Peter MacCallum Cancer Institute, Melbourne, Australia, and Department of Pathology, University of Melbourne, Parkville, Victoria, Australia; A. Antoniou, Statistical Laboratory, Department of Pure Mathematics and Mathematical Statistics, Cambridge, U.K.; A. Storfer-Isser, D. F. Easton, Cancer Research Campaign Genetic Epidemiology Group, Department of Community Medicine, Institute of Public Health, University of Cambridge, U.K.; E. Smyth, Medical Research Council Human Genetics Unit, Western General Hospital, Edinburgh, U.K.; C. M. Steel, School of Biological and Medical Sciences, University of St. Andrews, Fife, U.K.; N. Haites, Medical Genetics, Department of Medicine and Therapeutics, University of Aberdeen, U.K.; R. J. Scott, Humangenetik, Department Forschung, Kantonsspital, Basel, Switzerland; D. Goldgar, G. Lenoir, International Agency for Research on Can-cer, Lyon, France; S. Neuhausen, Genetic Epidemiology, Department of Medical
Informatics, University of Utah, Salt Lake City; P. A. Daly, W. Ormiston, R. McManus, Department of Medicine, Trinity College Medical School, Dublin, Ireland; S. Scherneck, Max-Delbruck-Centrum fur Moleculare Medizin, Tumor-genetik, Berlin, Germany; B. A. J. Ponder, Cancer Research Campaign Human Cancer Genetics Research Group, Level 3, Laboratories Block, Addenbrookes Hospital, Cambridge, U.K.; D. Stoppa-Lyonnet, Unite´ de Genetique On-cologique, Institut Curie, Paris, France; Y.-J. Bignon, Centre Jean Perrin, Labo-ratoire d’Oncologie Moleculaire, Clermont-Ferrand, France; J. P. Struewing, Genetic Epidemiology Branch, Division of Cancer Epidemiology and Genetics, National Cancer Institute, Bethesda, MD; N. K. Spurr, Cancer Molecular Ge-netics, Imperial Cancer Research Fund, Leeds, U.K.; D. T. Bishop, Imperial Cancer Research Fund Genetic Epidemiology Laboratory, St. James University Hospital, Leeds, U.K.; J. G. M. Klijn, Daniel den Hoed Cancer Centre, Rotter-dam, The Netherlands; P. Devilee, C. J. Cornelisse, Department of Genetics and Pathology, Leiden University, The Netherlands; C. Lasset, Centre Leon Bernard, Lyon, France; R. B. Barkardottir, V. Egilsson, Laboratory of Cell Biology, University Hospital of Iceland, Reykjavik; U. Hamann, J. Chang-Claude, Divi-sion of Epidemiology and Molecular Genome Analysis, Deutsches Krebsforsch-ungszentrum, Heidelberg, Germany; B. Weber, University of Pennsylvania Can-cer Center, Philadelphia.
Correspondence to: M. R. Stratton, M.D., Ph.D., Haddow Laboratories,
In-stitute of Cancer Research, 15 Cotswold Rd., Sutton, Surrey SM2 5NG, U.K. E-mail: mikes@icr.ac.uk
See ‘‘Notes’’ following ‘‘References.’’
Two highly penetrant breast cancer predisposition genes,
BRCA1 and BRCA2, have recently been identified (1,2).
BRCA1 is located on chromosome 17q21 (3) and encodes a
protein of 1863 amino acids. BRCA2 is located on chromosome
13q12–q13 (4) and encodes a protein of 3418 amino acids.
We recently compared the pathology of breast cancers in
patients carrying mutations in BRCA1 and BRCA2 with that of
breast cancers from a series of control subjects of similar age
distribution unselected for family history (5). In this first review,
we compared breast cancer subtype and grade and the presence
of carcinoma in situ. Overall, the results showed that breast
cancers in BRCA1 and BRCA2 mutation carriers differed from
those in control subjects as well as from each other. Breast
cancers due to mutations in the BRCA1 gene were characterized
by higher scores for mitosis (i.e., higher numbers of cells
un-dergoing mitosis per tumor), pleomorphism (i.e., a greater
de-gree of pleomorphism), and tubule formation (i.e., less tubule
formation) than breast cancers from control subjects. Breast
can-cers due to BRCA2 mutations showed a higher score for tubule
formation and included a smaller proportion of tubular
carcino-mas than the breast cancers in control subjects. The findings
with respect to cancers involving BRCA1 mutations are broadly
in agreement with previously published series (6,7). Only a
small number of breast cancers involving BRCA2 mutations
have previously been evaluated for their histology (7).
Medullary and atypical medullary carcinomas were reported
more frequently in carriers of BRCA1 mutations (13%) than in
control breast cancer patients without a family history (2%;
P<.0001). Medullary carcinoma is a form of invasive breast
cancer characterized by the presence of solid sheets of large,
pleomorphic cells with vesicular nuclei, prominent nucleoli, and
indistinct cell borders that lead to a ‘‘syncitial’’ appearance
(8,9). The border of the tumor is well defined with a pushing
edge. The stroma may be sparse but always contains a dense
lymphocytic infiltrate. The whole tumor should exhibit these
features. Carcinoma in situ is usually not seen. Despite the
ap-parent high grade of the tumor, it has been associated with a
relatively favorable prognosis (9). Atypical medullary
carci-noma is diagnosed either when up to 25% of the tumor is
inva-sive ductal carcinoma of no special type and the remainder is
classic medullary or when the complete tumor shows less
lym-phoid infiltration and less circumscription or areas of dense
fi-brosis while still having the other features of medullary
carci-noma (8).
In the first review (5), the agreement between pathologists
was low (
k score of .41) for medullary and atypical medullary
carcinomas. This result was consistent with previous reports
indicating poor reproducibility for this diagnostic category
(10,11).
To clarify the observation of an excess of medullary and
atypical medullary carcinomas reported in BRCA1 mutation
car-riers, we carried out a second review in which the morphologic
features that are associated with medullary and atypical
medul-lary carcinomas were specifically evaluated. Subsequently, we
combined the data from both evaluations and performed a
mul-tifactorial analysis to identify the features that are independently
associated with cancers in carriers of mutations in the BRCA1
and BRCA2 genes.
Patients and Methods
Breast Cancer Specimens
As described previously in our first review (5), we obtained specimens from case subjects with familial breast cancer (at least one relative affected with the disease) in the form of 5-mm sections either unstained or stained with hema-toxylin–eosin (H&E). These specimens came from the United Kingdom, United States, Ireland, France, Germany, Iceland, Switzerland, and The Netherlands. The vast majority of familial cases were from the last two decades, since it was predominantly from that period that blocks were available.
Given the diverse origin of the familial cases, it was logistically impossible to obtain locally matched control subjects in all instances. However, almost all the familial case and control subjects were Caucasian. A higher proportion of mu-tation carriers than control subjects would be Ashkenazi Jewish, but this pro-portion would still be a very small minority of the cases. Moreover, ethnic origin is unlikely to be strongly related to grade or other histopathologic features of the tumor. We therefore chose control specimens from the Department of Histopa-thology, Royal Marsden Hospital National Health Service Trust, Sutton, Surrey, U.K., to give an age distribution similar to that of familial case subjects. These control subjects constitute a series of breast cancer patients unselected for family history. Some of these control subjects may have carried mutations in BRCA1 and BRCA2. However, the proportion would have been very small, and precise estimates were not available.
We selected one, or occasionally two, representative H&E-stained sections from each primary breast cancer and coded each section with a random number. We arranged the slide sets from familial cancer patients and control subjects with sporadic cancers in sequential order according to their random number for the review. If slides from two or more tumors from the same woman were available, results obtained from the earliest tumor only were included in the analysis, unless the second tumor was clearly recorded as a second primary cancer (nine cases: two involving BRCA1, five involving BRCA2, and two familial cases that were not classifiable as involving either gene).
The studies were carried out with the informed consent of the patients and after approval from the local institutional review board.
Conduct of the Second Histologic Review
The second review was carried out by seven pathologists (J. P. Sloane, T. J. Anderson, J. Jacquemier, M. J. van de Vijver, B. A. Gusterson, L. M. Farid, and D. Venter); each pathologist scored the slides independently. The slides were randomly sorted into boxes containing 100 slides each. The pathologists were assigned to review a certain number of boxes, and it was arranged so that no pair of pathologists reviewed more than one box. Each slide was read independently by two pathologists. The study was conducted blindly, so that the pathologists were not aware if the slide being read was from a case subject or a control subject. The pathologists were asked to complete a form that included an as-sessment of the percentage of tumor present as solid sheets of cells (<25%, 25%–75%, and >75%) determined by low-power scrutiny of the section, the total mitotic count per 10 high-power fields (hpf) by use of ×40 magnification lens, the presence of continuous pushing margins (i.e., a smooth, noninfiltrative edge to the tumor—subdivided into absent and present [<25%, 25%–75%, and >75% of tumor perimeter]) determined by low-power scrutiny of the section, the pres-ence of confluent necrosis, the prespres-ence of lymphocytic infiltrate (if present, whether mild or prominent), the presence of discernible cell borders, the pres-ence of vesicular nuclei (defined as nuclei with cleared chromatin, often divided by septae into sac-like compartments), and the presence of prominent, eosino-philic nucleoli. Because the same slide set had been used in the first review, each pathologist reviewed a subset of slides that he/she had not examined previously. No attempt was made to reconcile differences between the pathologists because it was difficult to design such a process that would not introduce other biases. Although there were clear differences in frequency of diagnoses between the pathologists, each pathologist reviewed tumors from case individuals carrying BRCA1 and BRCA2 mutations as well as control tumors from individuals un-selected for a family history. Moreover, all variables examined were adjusted for the pathologist. To assess the degree of agreement between the pathologists and, hence, the reproducibility of evaluation of each feature,k scores were calculated.
Classification of Families
As previously described (5), familial cases were attributed to BRCA1 or BRCA2 on the basis of either strong linkage evidence or a clearly disease-associated mutation generating a higher than 90% posterior probability of being
due to either gene. We classified the residual cases as ‘‘unknown.’’ The posterior probability of linkage to BRCA1 was determined by the following formula:
(1 −m1)a110 LOD1/[(1 −m 1)a110 LOD1+a 210 LOD2+ (1 −a 1−a2)].
a1anda2are the prior probabilities of linkage to BRCA1 and BRCA2. These probabilities were estimated from the numbers of individuals with breast cancer (both female and male) and ovarian cancer in the family, as reported in recent studies by the Breast Cancer Linkage Consortium (12). Althougha1 anda2 theoretically depend on ages of cancer occurrence in a family, precise prior probabilities by exact ages are not known. We have therefore based the prior probabilities on number of cases.m1is the estimated sensitivity of the BRCA1 mutation testing used on the family [for details, see (12)]. Methods of mutation testing included DNA sequencing, single-strand conformation polymorphism analysis, the protein truncation test, and heteroduplex analysis (12). We ignored the test sensitivity to BRCA2 because only a small proportion of families had been examined for BRCA2 mutations at the time of analysis. For the purposes of this study, there are essentially no effects of this assumption. Only 10 cases were classified as involving BRCA2 on the basis of linkage rather than mutations status. On the basis of mutation studies now completed, a more realistic estimate of the mutation sensitivity of BRCA2 would still have included all these cases as being due to BRCA2. LOD1 and LOD2 (logarithm of odds ratios) are the LOD scores for linkages to BRCA1 and BRCA2, respectively, employing mark-ers close to the gene. In most cases, we calculated LOD1 from a multipoint analysis by use of the markers D17S579 and either D17S250 or Thra1. LOD2 was based on markers D13S260 and D13S267. We calculated posterior prob-abilities for BRCA2 in a similar way. We made the assumption that case subjects in mutation-positive families were mutation carriers unless information from mutation or linkage analyses indicated that they were not carriers. (These non-carriers were excluded from all analyses.)
Statistical Methods
As in the previous analysis, the effects of each morphologic feature on cancer status was summarized in terms of odds ratios, as in standard case–control analyses (13), for patients carrying mutations in the BRCA1 gene versus control patients and, separately, for patients carrying mutations in the BRCA2 gene versus control patients. Analyses comparing tumors associated with BRCA1 and BRCA2 mutations directly were also performed. To analyze the joint effect of several features simultaneously, we performed multiple logistic regression analysis, using the program S-Plus (version 3.4; MathSoft Inc., Seattle, WA). All analyses were adjusted for age in groups (i.e., <30 years old, 30–39 years old, 40–49 years old, 50–59 years old, 60–69 years old, andù70 years old) and by pathologist, by including these as covariates in the regression. This procedure adjusts for systematic differences in scoring between pathologists. The main complication in the analysis is that the observations by different pathologists on the same slide cannot be considered independent. Using standard logistic regres-sion, therefore, involves maximizing a quasi-likelihood rather than a true like-lihood; this maximization of a quasi-likelihood leads to unbiased odds ratio estimates but underestimates the standard errors and confidence intervals (CIs). To correct for this situation, we computed confidence limits by using Huber’s sandwich estimator for the variance–covariance matrix of maximum likelihood estimates (14), by use of specially written S-Plus macros. This quasi-likelihood approach allows for the variation in scoring individual samples be-tween the pathologists without explicitly modeling the error distribution. The CIs were also estimated by bootstrapping (15), in which 1000 bootstrap samples were created by resampling (unit of resampling was the case with observations from the two pathologists) the cases (with replacement) within each age group. This method, which allows confidence limits to be derived without assuming an asymptotic normal distribution, gave results very similar to those of the sand-wich estimator. For simplicity and consistency with previous analyses, the con-fidence limits with the use of the sandwich estimator are quoted. Significance levels for each factor in multiple regression analysis were derived from the parameter estimates and the covariance matrix (adjusted by use of the sandwich estimator). Since all the factors scored on more than one level (e.g., mitotic count) are naturally considered as ordered categories, we constructed 1-degree-of-freedom significance tests based on testing for linear trends in log(odds ratio) with increasing category (13). (Estimated odds ratios were, however, derived separately for each level.) Significance levels less than .10 are quoted in the tables. Heterogeneity chi-squared statistics (based on k – 1 degree of freedom for factors with k levels) have also been presented for those factors with the best fitting models. All P values are two-sided.
In the multiple regression analysis, all factors that were significant at the 5% level for presence of mutations in either BRCA1 or BRCA2 genes, together with the patient’s age and the pathologist who reviewed the slides, were initially included. Factors (other than patient’s age and pathologist) were then removed from the model on a stepwise basis until no further factors could be removed at the 5% level.
On the basis of the estimated odds ratios in the final genetic model, we computed BRCA1 carrier probabilities for breast cancer cases with given com-binations of histologic features such that the overall carrier probability agreed with the predicted mutation prevalence in each age group (12).
Results
Classification of Familial Cases
This study included 440 female patients with familial breast
cancer. The age distribution of the control and familial groups
was similar. The results reported here are based on 360
obser-vations from familial case subjects, 219 obserobser-vations from 114
subjects with mutations in the BRCA1 gene, 141 observations
from 73 subjects with mutations in the BRCA2 gene, and 1046
observations from 528 control subjects with cancer unselected
for family history. Details of actual mutations are given in (5).
The numbers of case and control subjects differed slightly from
the previously published first study (5) because the present
analysis was restricted to invasive cancers and excluded slides
where only in situ cancer was reported. Because two
patholo-gists reviewed slides from each case and control subject, the
number of observations should be double the number of cancers.
However, in a few cancers, one or both pathologists were unable
to review the section because of poor quality. Overall, the slides
from familial case subjects were of poorer quality than those
from control subjects; however, sections from case subjects with
BRCA1 and BRCA2 mutations were of similar quality;
there-fore, quality is unlikely to account for the observed differences
between the two genes. The characteristics of the BRCA1 and
BRCA2 mutations in the set have been reported previously (5).
Of the case subjects classified as BRCA1 mutation carriers, 111
were classified as such on the basis of a clear disease-causing
mutation and three on the basis of genetic linkage analysis. Of
the case individuals classified as BRCA2 mutation carriers, 63
were classified as such on the basis of a clear disease-causing
mutation and 10 on the basis of genetic linkage analysis. Results
from the familial set as a whole and from ‘‘unknown’’ cases (of
which there were 253) are not presented in this article.
Analysis of Morphologic Features
The agreement between the pathologists on the features
evaluated, expressed as
k scores, is shown in Table 1. A k score
of 1 indicates complete agreement, whereas a
k score of 0
in-dicates no agreement. Best agreement was achieved for necrosis
(
k score of .68 [standard error 4 .03]), and least agreement was
achieved for the definition of cell borders (
k score of .21
[stan-dard error
4 .03]).
Table 2 compares morphologic characteristics evaluated in
the second review with odds ratios adjusted for age of the patient
and for the pathologist. Cancers associated with BRCA1
muta-tions showed higher mitotic counts than cancers associated with
BRCA2 mutations or control breast cancers, with an elevated
relative risk for BRCA1 at all mitotic counts above 5 per 10 hpf
and a maximum odds ratio of 6.79 (95% CI
4 3.94–11.67) at
20–39 mitoses per 10 hpf. Cancers associated with BRCA1
mu-tations also showed more lymphocytic infiltrate (P for trend
<.0001), both mild (odds ratio
4 3.43; 95% CI 4 2.26–5.21)
and prominent (odds ratio
4 7.01; 95% CI 4 3.38–15.05), were
more likely to have continuous pushing margins occupying a
higher proportion of the tumor perimeter (odds ratio
4 6.47;
95% CI
4 3.68–11.36; for >75% pushing margins, P for trend
<.0001), were more likely to include solid sheets of cells
occu-pying more than 75% of the tumor area (odds ratio
4 4.90; 95%
CI
4 2.93–8.17; P for trend <.0001), and were more likely to
include areas of necrosis (odds ratio
4 3.95; 95% CI 4 2.63–
5.93; P<.0001). However, the discernibility of cell borders, the
presence of vesicular nuclei, or the prominence of nucleoli did
not differ significantly from those of control patients.
Cancers associated with BRCA2 mutations also tended to
have continuous pushing margins occupying a greater
propor-tion of the tumor perimeter (odds ratio
4 2.82; 95% CI 4
1.31–6.08; for >75% continuous pushing margins, P for trend
4
Table 1.k scores indicating level of agreement between the observers
evaluating histopathologic features of breast cancers
Characteristic k score (SE)*
Mitotic count .39 (.02)
Lymphocytic infiltrate .34 (.03)
Continuous pushing margins .39 (.02)
Solid sheets of cells .51 (.02)
Nucleoli .45 (.03)
Nuclei .23 (.03)
Necrosis .68 (.03)
Cell borders .21 (.03)
*SE4 standard error.
Table 2. Unifactorial analysis of features of breast cancers associated with BRCA1 and BRCA2 mutations compared with control breast cancers unselected for
family history*
Characteristic
Control breast cancers, No. of observations (%)
Breast cancers associated with BRCA1 mutations
Breast cancers associated with BRCA2 mutations No. of observations (%) Odds ratio (95% CI) No. of observations (%) Odds ratio (95% CI) Mitotic count 0–4 586 (56) 51 (23) 1.0 (referent) 70 (50) 1.0 (referent) 5–9 141 (13) 27 (12) 2.12 (1.22–3.69) 26 (18) 1.56 (0.91–2.68) 10–19 153 (15) 52 (24) 3.89 (2.29–6.59) 27 (19) 1.49 (0.83–2.67) 20–39 96 (9) 61 (28) 6.79 (3.94–11.67) 16 (11) 1.43 (0.69–2.97) ù40 70 (7) 28 (13) 4.13 (2.09–8.14) 2 (1) 0.24 (0.06–1.01) x2 14 37.79 (P<.0001) x 2 14 0.83 Lymphocytic infiltrate
Absent 639 (61) 74 (34) 1.0 (referent) 75 (53) 1.0 (referent)
Mild 372 (36) 117 (53) 3.43 (2.26–5.21) 61 (43) 1.77 (1.06–2.96) Prominent 35 (3) 28 (13) 7.01 (3.38–15.05) 5 (4) 1.33 (0.40–4.47) x2 14 35.02 (P<.0001) x 2 14 0.75 Continuous pushing margins
Absent 842 (80) 109 (49) 1.0 (referent) 90 (64) 1.0 (referent)
Present <25% 67 (6) 25 (11) 3.46 (1.90–6.29) 16 (11) 2.42 (1.23–4.78) 25%–75% 81 (8) 40 (18) 3.84 (2.33–6.33) 20 (14) 2.63 (1.39–4.69) >75% 56 (5) 47 (21) 6.47 (3.68–11.36) 15 (11) 2.82 (1.31–6.08) x2 14 53.36 (P<.0001) x214 13.05 (P 4 .0003) Solid sheets of cells
<25% 745 (72) 100 (46) 1.0 (referent) 89 (64) 1.0 (referent) 25%–75% 175 (17) 46 (21) 2.42 (1.49–3.92) 34 (24) 1.95 (1.19–3.21) >75% 120 (12) 73 (33) 4.90 (2.93–8.17) 17 (12) 1.49 (0.72–3.09) x2 14 37.31 (P<.0001) x 2 14 2.84 (P 4 .09) Nucleoli
Absent 597 (57) 99 (45) 1.0 (referent) 74 (52) 1.0 (referent)
Present 449 (43) 120 (55) 1.63 (1.11–2.42) 67 (48) 1.29 (0.81–2.05)
x2
14 6.16 (P 4 .013) x214 1.15 Nuclei
Nonvesicular 388 (37) 76 (35) 1.0 (referent) 57 (40) 1.0 (referent)
Vesicular 658 (63) 143 (65) 1.19 (0.78–1.82) 84 (60) 0.81 (0.47–1.41)
x2
14 0.64 x214 0.54 Necrosis
Absent 857 (82) 113 (52) 1.0 (referent) 111 (79) 1.0 (referent)
Present 189 (18) 106 (48) 3.95 (2.63–5.93) 30 (21) 1.27 (0.72–2.23)
x2
14 43.69 (P<.0001) x214 0.68 Cell borders
Absent 380 (36) 77 (35) 1.0 (referent) 47 (33) 1.0 (referent)
Present 666 (64) 142 (65) 1.11 (0.76–1.62) 94 (67) 1.29 (0.83–1.99)
x2
14 0.30 x214 1.31
*CI4 confidence interval. All x2tests are tests for trend and are two-sided. The subscript numbers tox2are equal to the degrees of freedom. Different numbers of observations were recorded for different features because of the variable quality of the histopathologic material; hence, there is variation in the evaluability of certain features on some sections. Analyses were adjusted for age of the patients and for the pathologist.
.0003). None of the other features examined in the second
re-view differed significantly from those in control cancers.
In a direct comparison of BRCA1 and BRCA2, tumors
in-volving BRCA1 mutations had significantly greater scores for
mitotic count (P<.0001), lymphocytic infiltrate (P
4 .002),
con-tinuous pushing margins (P
4 .03), solid sheets of cells (P 4
.004) and necrosis (P
4 .001).
Multifactorial Analysis
All factors significant at the 5% level from both reviews
(analyses adjusted for age of the patients and for the pathologist)
were included in a multiple regression analysis (Table 3). For
BRCA1, all factors had weaker effects than in the unifactorial
analysis. In particular, the odds ratios (95% CI) for medullary
and atypical medullary carcinomas were reduced from 5.16
(2.42–11.03) (5) in the unifactorial analysis to 1.46 (0.85–2.52)
in the multifactorial analysis. Odds ratios for mitotic count were
also reduced, although less markedly, whereas the odds ratios
for other components of grade (i.e., pleomorphism and tubule
score) were close to 1. Table 4 shows the final model after
stepwise removal of nonsignificant factors for breast cancers
arising in BRCA1 mutation carriers. The only factors significant
in the multifactorial model were mitotic count (P for trend
4
.001), continuous pushing margins (P for trend <.0001),
lym-phocytic infiltrate (P for trend
4 .002), ductal carcinoma in situ
(DCIS) (P
4 .022), and lobular carcinoma in situ (LCIS) (P 4
.042). The features of solid sheets of cells, necrosis, and
nucleoli, all of which were statistically significant in the
unifac-torial analysis, did not appear to be so in the final model, since
they were correlated with mitotic count, continuous pushing
margins, and lymphocytic infiltrate.
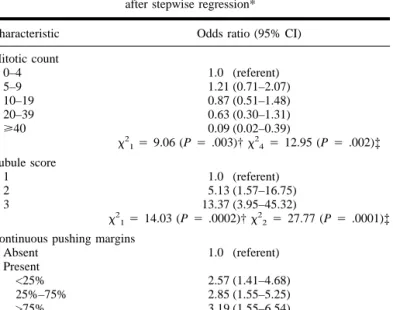
Similar analyses were performed for BRCA2 (see Table 3).
After stepwise removal of nonsignificant factors, the final model
for BRCA2 included the following factors: tubule score (P for
trend
4 .0002) and continuous pushing margins (P for trend
<.0001). In contrast to the unifactorial analysis, tumors in
BRCA2 mutation carriers also had a lower mitotic count (P for
trend
4 .003) than those in control subjects after adjustment for
tubule formation and continuous pushing margins (Table 5).
DCIS was more common in tumors associated with BRCA2
mutations after adjustment for certain factors (i.e., mitotic count,
lymphocytic infiltrate, and tubule formation) (odds ratio
4 1.39;
95% CI
4 0.98–1.99) but did not quite reach statistical
signifi-cance (P
4 .053)
In the corresponding analysis in which tumors with BRCA1
and BRCA2 mutations were compared directly with each other,
the significant factors in the final model were a higher score for
mitotic count (P<.0001) and lymphocytic infiltrate (P
4 .001)
in tumors associated with BRCA1 mutations and a higher score
for tubule formation (i.e., fewer tubules) (P<.0001) in tumors
associated with BRCA2 mutations.
Discussion
In this study, by evaluating several features that are used in
the diagnosis of medullary and atypical medullary carcinomas,
we have extended our comparison of the histopathology of
can-cers arising in BRCA1 mutation carriers, BRCA2 mutation
car-riers, and control patients unselected for family history. In
ad-dition, the data have been combined with previously published
Table 3. Multifactorial analysis of features of breast cancers in BRCA1 and
BRCA2 mutation carriers compared with breast cancers in control patients unselected for family history*
Characteristic
Odds ratio (95% CI)
BRCA1 BRCA2 Mitotic count 0–4 1.0 (referent) 1.0 (referent) 5–9 1.42 (0.81–2.48) 1.22 (0.69–2.64) 10–19 2.13 (1.28–3.53) 0.91 (0.52–1.61) 20–39 2.56 (1.39–4.70) 0.69 (0.31–1.50) ù40 1.22 (0.60–2.47) 0.11 (0.02–0.47) x2 14 4.09 (P 4 .043) x214 6.40 (P 4 .011) Tubule score 1 1.0 (referent) 1.0 (referent) 2 0.89 (0.42–1.88) 4.87 (1.47–16.14) 3 1.01 (0.49–2.07) 13.11 (3.74–45.98) x2 14 0.01 x 2 14 13.02 (P 4 .0003) Pleomorphism score 1 1.0 (referent) 1.0 (referent) 2 0.96 (0.57–1.60) 1.35 (0.71–2.57) 3 1.03 (0.57–1.87) 1.00 (0.49–2.04) x2 14 0.00 x 2 14 0.09 Medullary/atypical medullary
Absent 1.0 (referent) 1.0 (referent) Present 1.46 (0.85–2.52) 0.61 (0.27–1.37)
x2
14 1.84 x214 1.45 Solid sheets of cells
<25% 1.0 (referent) 1.0 (referent) 25%–75% 0.94 (0.60–1.49) 1.47 (0.88–2.44) >75% 0.93 (0.51–1.70) 0.77 (0.33–1.81) x2 14 0.073 x 2 14 0.016 Continuous pushing margins
Absent 1.0 (referent) 1.0 (referent) Present <25% 1.86 (1.11–3.11) 2.41 (1.30–4.45) 25%–75% 1.77 (1.05–3.00) 2.73 (1.46–5.12) >75% 2.72 (1.48–5.00) 4.02 (1.60–10.08) x2 14 11.62 (P 4 .0007) x214 13.46 (P 4 .0002) Lymphocytic infiltrate
Absent 1.0 (referent) 1.0 (referent) Mild 1.76 (1.19–2.60) 1.28 (0.80–2.06) Prominent 1.83 (0.89–3.79) 0.54 (0.18–1.61)
x2
14 4.34 (P 4 .037) x214 0.69 DCIS
Absent 1.0 (referent) 1.0 (referent) Present 0.77 (0.57–1.04) 0.56 (0.22–2.07)
x2
14 2.95 (P 4 .086) x214 1.41 LCIS
Absent 1.0 (referent) 1.0 (referent) Present 0.27 (0.11–0.68) 0.56 (0.22–2.07) x2 14 7.71 (P 4 .005) x 2 14 1.41 Nucleoli
Absent 1.0 (referent) 1.0 (referent) Present 0.78 (0.55–1.11) 1.06 (0.69–1.62) x2 14 1.96 x 2 14 0.07 Necrosis
Absent 1.0 (referent) 1.0 (referent) Present 1.54 (1.00–2.35) 0.74 (0.40–1.35)
x2
14 3.91 (P 4 .048) x 2
14 0.97 *CI 4 confidence interval; DCIS 4 ductal carcinoma in situ; LCIS 4 lobular carcinoma in situ. Allx2tests are tests for trend and are two-sided. The subscript numbers tox2 are equal to the degrees of freedom. Analyses were adjusted for age of the patients and for the pathologist.
results and have been subjected to a multifactorial analysis to
determine the morphologic features that are associated with
can-cers in BRCA1 and BRCA2 mutation carriers independently of
other factors.
For BRCA1, the multifactorial analysis showed that high
mi-totic count, the presence of continuous pushing margins, and
lymphocytic infiltrate (both mild and prominent) remained
sta-tistically highly significantly different from those in control
cases, independent of other factors. The odds ratios associated
with these factors (twofold to threefold) were markedly lower
when considered in the multifactorial analysis than when
con-sidered in the unifactorial analysis (more than sixfold in each
case). This finding reflects the fact that these factors are
posi-tively correlated with one another. The multifactorial analysis
indicates that the differences previously observed with respect to
pleomorphism, tubule formation, and the frequency of
medul-lary and atypical medulmedul-lary carcinomas are explicable in terms
of these three significant factors and are not independent of
them. Tumors involving BRCA1 mutations were also associated
in the multifactorial analysis with a lower rate of associated
DCIS and LCIS, although the evidence was of only marginal
significance. The evidence for the association with LCIS in
par-ticular may be exaggerated in this analysis, in that one of the
BRCA1 mutation carriers with LCIS in the first review was not
scored for factors in the second review and hence was excluded
from the multifactorial analysis. It is interesting, however, that
both DCIS and LCIS were also less common in tumors
associ-ated with BRCA2 mutations to a similar extent, although the
differences were not significant in this case.
As with all such multiple regression analyses in which a large
number of factors are considered, the results must be interpreted
cautiously. First, there is a multiple testing problem: With such
a large number of factors being considered, some associations
may have occurred by chance. The three important factors in the
BRCA1 analysis were, however, all highly significant so that
chance association is unlikely.
Another potential difficulty is colinearity, whereby factors
are so strongly correlated that more than any one combination of
factors can explain the data equally well. Qualitatively, this does
not appear to be a problem here, in that the three important
factors retained large and highly significant effects in the
mul-tifactorial analysis, whereas the other factors associated with
them had nonsignificant effects with odds ratios close to 1.
However, there remains some quantitative uncertainty as to
the relative importance of the three factors mitotic count,
con-tinuous pushing margins, and lymphocytic infiltrate, since they
are positively associated with one another. Some other factors
may, of course, differ between hereditary (familial) cancer case
subjects and control subjects unselected for family history to a
more moderate extent, but a much larger study would be
re-quired to detect such differences.
Of the three features that are independently associated with
cancers involving BRCA1 mutations, two (continuous pushing
margins and lymphoid infiltrate) constitute a subset of the
char-acteristics that define medullary carcinoma. A high mitotic
count, which is the third feature associated with these tumors, is
also often present in medullary carcinoma, but it is not regarded
as a defining feature. However, vesicular nuclei, indistinct cell
borders leading to a ‘‘syncitial’’ appearance, and the presence of
Table 5. Final model for breast cancers arising in BRCA2 mutation carriers
after stepwise regression* Characteristic Odds ratio (95% CI) Mitotic count 0–4 1.0 (referent) 5–9 1.21 (0.71–2.07) 10–19 0.87 (0.51–1.48) 20–39 0.63 (0.30–1.31) ù40 0.09 (0.02–0.39) x2 14 9.06 (P 4 .003)† x244 12.95 (P 4 .002)‡ Tubule score 1 1.0 (referent) 2 5.13 (1.57–16.75) 3 13.37 (3.95–45.32) x2 14 14.03 (P 4 .0002)† x 2 24 27.77 (P 4 .0001)‡ Continuous pushing margins
Absent 1.0 (referent) Present <25% 2.57 (1.41–4.68) 25%–75% 2.85 (1.55–5.25) >75% 3.19 (1.55–6.54) x2 14 17.11 (P<.0001)† x234 18.82 (P 4 .0003)‡ *CI4 confidence interval. Analyses were adjusted for age of the patients and for the pathologist.
†Allx2tests are tests for trend and are two-sided. The subscript numbers to
x2are equal to the degrees of freedom. ‡Heterogeneity tests.
Table 4. Final model for breast cancers arising in BRCA1 mutation carriers
after stepwise regression* Characteristic Odds ratio (95% CI) Mitotic count 0–4 1.0 (referent) 5–9 1.53 (0.90–2.59) 10–19 2.35 (1.50–3.67) 20–39 2.98 (1.79–4.96) ù40 1.58 (1.58–2.98) x2 14 10.59 (P 4 .001)† x244 23.09 (P 4 .0001)‡ Continuous pushing margins
Absent 1.0 (referent) Present <25% 1.82 (1.11–2.98) 25%–75% 1.89 (1.16–3.09) >75% 2.87 (1.73–4.76) x2 14 17.64 (P<.0001)† x 2 34 18.62 (P 4 .0003)‡ Lymphocytic infiltrate Absent 1.0 (referent) Mild 1.90 (1.31–2.76) Prominent 2.46 (1.26–4.79) x2 14 9.69 (P 4 .002)† x 2 24 12.99 (P 4 .002)‡ DCIS Absent 1.0 (referent) Present 0.71 (0.53–0.95) x2 14 5.23 (P 4 .022) LCIS Absent 1.0 (referent) Present 0.38 (0.15–0.97) x2 14 4.14 (P 4 .042)
*CI 4 confidence interval; DCIS 4 ductal carcinoma in situ; LCIS 4 lobular carcinoma in situ. Analyses were adjusted for age of the patients and for the pathologist.
†Allx2tests are tests for trend and are two-sided. The subscript numbers to
x2are equal to the degrees of freedom. ‡Heterogeneity tests.
prominent nucleoli, all of which are listed among the criteria for
medullary carcinoma (8,9), are not independently associated
with cancers involving BRCA1 mutations. Moreover, in many
cancers involving BRCA1 mutations, the lymphoid infiltrate
was not as prominent as would usually be required for diagnosis
of classic medullary carcinoma. To further address the issue of
the role of medullary and atypical medullary carcinomas in
breast cancers associated with BRCA1 mutations, we performed
an additional multifactorial analysis in which cancers registered
as medullary and atypical medullary cancers were excluded. In
that analysis, mitotic count, continuous pushing margins, and
lymphoid infiltrate remained statistically highly significantly
different between patients carrying BRCA1 mutations and
pa-tients with sporadic cancers, and odds ratios were similar to
those shown in Table 4. Therefore, although an increased
fre-quency of classic and atypical medullary carcinomas may
con-tribute to the observed BRCA1 phenotype, these cancers are
likely to account for only a small proportion of the differences
observed between BRCA1 mutation-associated cancers and the
control group of sporadic cancers.
We have previously described the potential clinical
implica-tions of the histopathologic features of breast cancers developing
in individuals carrying BRCA1 mutations with respect to
prog-nosis and detectability by mammographic screening. These
con-clusions are essentially unchanged by the results included in this
analysis. As we also outlined in the previous report, it may be
possible to use the data to predict the likelihood of a breast
cancer patient carrying a BRCA1 mutation, particularly when a
clear family history of the disease is not reported. The results of
our multifactorial analysis should increase the effectiveness of
this approach. For example, based on previous estimates, 7.5%
of breast cancer patients in Britain who were diagnosed between
the ages of 20 and 29 years carry a BRCA1 mutation (16).
Assuming that the odds ratios from our analysis are independent
of age, only about 2% of case subjects in this age group in whom
the mitotic count is below 5 per 10 hpf, without continuous
pushing margins, and in whom there is no lymphocytic infiltrate
would be expected to carry a BRCA1 mutation. By contrast,
about 45% of case subjects in the 20- to 29-year-old group with
20–39 mitoses per 10 hpf, continuous pushing margins
occupy-ing more than 75% of the tumor perimeter, and a prominent
lymphocytic infiltrate would be expected to be BRCA1 carriers.
The corresponding proportions based on mitotic count would be
4% and 16%. Thus, the combination of these three factors
pro-vides a much clearer discrimination than the use of mitotic count
alone. Although the level of agreement between pathologists for
these features, as reflected in the kappa scores, may restrict the
general application of this approach, it may be possible in the
future to define these features more reliably and hence to
im-prove their utility.
In breast cancers arising in carriers of BRCA1 mutations, it is
believed that function(s) of the BRCA1 protein are absent or are
severely inhibited. The increased proliferative activity in cancers
from BRCA1 mutation carriers, reflected in the high mitotic
count, is therefore consistent with recently published
observa-tions suggesting that overexpression of normal BRCA1 reduces
the rate of cell proliferation (17), that reduction of normal
BRCA1 expression increases the rate of cell proliferation (18),
and that BRCA1 activity is regulated through the cell cycle (19).
However, some cancers in BRCA1 mutation carriers do show a
low mitotic count (23% have 0–4 mitoses per 10 hpf) and,
over-all, are of low or intermediate grade. It is, therefore, possible that
the phenotype of cancers in BRCA1 mutation carriers is related
to relatively quick passage of clones of breast cancer cells
through a low-grade phase into a higher grade state. This rapid
progression may be related to a role for BRCA1 in preserving
genomic stability, similar to the role proposed for p53. This
hypothesis would be consistent with the observation that
BRCA1 forms a complex with Rad 51, the human homologue of
a yeast protein that protects against radiation-induced damage
and with which p53 also complexes (20).
Perhaps more surprising, however, is the finding of an
in-crease in lymphoid infiltrate that is associated with breast
can-cers in BRCA1 mutation carriers. It is possible that this is a
reflection of a particularly aggressive response by the immune
system. If so, this may account for some preliminary reports that
cancers in BRCA1 mutation carriers are associated with a better
prognosis (7,21). Alternatively, it can be argued that normal
breast epithelium and many breast cancers also contain a
scat-tering of lymphocytes and that the excess lymphoid infiltrate in
breast cancers involving BRCA1 mutations is simply an
exag-geration of a phenotypic feature that has no bearing on disease
progression. Either way, further investigation of the mechanisms
responsible for the accumulation of lymphoid cells near and
within breast cancers involving BRCA1 mutations is indicated.
Of particular interest is the excess of continuous pushing
margins, i.e., the presence of a smooth, noninfiltrative edge to
the tumor, which is the only morphologic feature strongly
asso-ciated with cancers involving both BRCA1 and BRCA2
muta-tions. Although the biologic basis of this feature is not
imme-diately obvious, it suggests that cancers involving BRCA1 and
BRCA2 mutations may be associated with a reduced potential
for stromal infiltration by individual or small groups of cells.
Studies of the expression of adhesion molecules (e.g.,
E-cadherin) or matrix metalloproteinases that mediate stromal
in-vasion may elucidate this issue.
For BRCA2, the multifactorial analysis indicates that, in
ad-dition to continuous pushing margins, reduced tubule formation
is an independent factor that differs significantly from controls.
As discussed previously, the reduction in tubule formation
sug-gests a defect in the formation of tissue architecture, particularly
with respect to cell–cell and cell–stroma interactions. The
mul-tifactorial analysis also indicated a significant inverse
relation-ship with mitotic count. This significant inverse relationrelation-ship was
seen despite the fact that there was no difference from controls
in the unifactorial analysis and reflects the fact that tumors
as-sociated with BRCA2 mutations, unlike those asas-sociated with
BRCA1 mutations, do not have the high mitotic counts that one
would expect, given their high scores for tubule formation and
continuous pushing margins.
Although there is no strong sequence homology between
BRCA1 and BRCA2, there are many other similarities between
the two genes. Abnormalities in both genes predispose to breast
and ovarian cancers; both genes encode large proteins and have
a large exon 11 and an untranslated first exon (1,2,22); both are
poorly conserved during evolution (23,24); they have a
remark-ably similar tissue pattern of expression (23); both act as
tran-scriptional activators in reporter systems (25,26); homozygous
knockouts of both genes in mice can be lethal at early stages of
development, and heterozygotes show no abnormality (27,28);
both form a complex (directly or indirectly) with Rad 51
(20,27); both have a similar pattern of regulation through the cell
cycle (29).
Although analysis of the histopathologic appearances of the
cancers confirms some similarities between tumors associated
with BRCA1 and tumors associated with BRCA2 mutations
(e.g., with respect to continuous pushing margins), it also
re-emphasizes differences between the two genes (with respect to
mitotic count, tubule formation, and lymphocytic infiltrate).
Taken together with differences in the clinical phenotype
asso-ciated with mutations in the two genes, including a lower risk of
ovarian cancer conferred by BRCA2 mutations [(4,30); Breast
Cancer Linkage Consortium: unpublished data], a lower risk of
male breast cancer conferred by BRCA1 mutations [(4,30);
Breast Cancer Linkage Consortium: unpublished data], and
dif-fering risks of other cancers such as pancreatic cancer [(31);
Breast Cancer Linkage Consortium: unpublished data] and
ocu-lar melanoma (30), our results indicate that there are likely to be
substantial differences in the biologic activities of the proteins
encoded by the BRCA1 and BRCA2 genes.
References
(1) Miki Y, Swensen J, Shattuck-Eidens D, Futreal PA, Harshman K,
Tavti-gian S, et al. A strong candidate for the breast and ovarian cancer suscep-tibility gene BRCA1. Science 1994;266:66–71.
(2) Wooster R, Bignell G, Lancaster J, Swift S, Seal S, Mangion J, et al.
Identification of the breast cancer susceptibility gene BRCA2 [published erratum appears in Nature 1996;379:749]. Nature 1995;378:789–92.
(3) Hall JM, Lee MK, Newman B, Morrow JE, Anderson LA, Huey B, et al.
Linkage of early-onset familial breast cancer to chromosome 17q21. Sci-ence 1990;250:1684–9.
(4) Wooster R, Neuhausen SL, Mangion J, Quirk Y, Ford D, Collins N, et al.
Localization of a breast cancer susceptibility gene, BRCA2, to chromo-some 13q12–13. Science 1994;265:2088–90.
(5) Pathology of familial breast cancer: differences between breast cancers in
carriers of BRCA1 or BRCA2 mutations and sporadic cases. Breast Cancer Linkage Consortium. Lancet 1997;349:1505–10.
(6) Eisinger F, Stoppa-Lyonnet D, Longy M, Kerangueven F, Noguchi T,
Bailly C, et al. Germ line mutation at BRCA1 affects the histoprognostic grade in hereditary breast cancer. Cancer Res 1996;56:471–4.
(7) Marcus JN, Watson P, Page DL, Narod SA, Lenoir GM, Tonin P, et al.
Hereditary breast cancer: pathobiology, prognosis, and BRCA1 and BRCA2 gene linkage. Cancer 1996;77:697–709.
(8) National Coordinating Group for Breast Screening Pathology. Pathology
reporting in breast cancer screening. National Health Service Breast Screening Program Publication No. 3 (2nd ed.). Sheffield (U.K.): National Health Service Breast Screening Program, 1995.
(9) Ridolfi RL, Rosen PP, Port A, Kinne D, Mike V. Medullary carcinoma of
the breast: a clinicopathologic study with 10 year follow-up. Cancer 1977; 40:1365–85.
(10) Rigaud C, Theobald S, Noel P, Badreddine J, Barlier C, Delobelle A, et al.
Medullary carcinoma of the breast. A multicenter study of its diagnostic consistency. Arch Pathol Lab Med 1993;117:1005–8.
(11) Pedersen L, Holck S, Schiodt T, Zedeler K, Mouridsen HT. Inter- and
intraobserver variability in the histopathological diagnosis of medullary carcinoma of the breast, and its prognostic implications. Breast Cancer Res Treat 1989;14:91–9.
(12) Ford D, Easton DF, Stratton M, Narod S, Goldgar D, Devilee P, et al.
Genetic heterogeneity and penetrance analysis of the BRCA1 and BRCA2 genes in breast cancer families. The Breast Cancer Linkage Consortium. Am J Hum Genet 1998;62:676–89.
(13) Breslow NE, Day NE. Statistical methods in cancer Research. Volume
I—The analysis of case–control studies. IARC Sci Publ 1980;32:5–338.
(14) Huber PJ. The behaviour of maximum likelihood estimates under non
standard conditions. In: Proceedings 5th Berkeley Symposium on Math-ematics, Statistics, and Probability. Stat Prob 1967;1:221–33.
(15) Efron B, Tibishirani R. An introduction to the bootstrap. New York:
Chap-man & Hall, 1993.
(16) Ford D, Easton DF, Peto J. Estimates of the gene frequency of BRCA1 and
its contribution to breast and ovarian cancer incidence. Am J Hum Genet 1995;57:1457–62.
(17) Holt JT, Thompson ME, Szabo C, Robinson-Benion C, Arteaga CL, King
MC, et al. Growth retardation and tumor inhibition by BRCA1. Nat Genet 1996;12:298–302
(18) Thompson ME, Jensen RA, Obermiller PS, Page DL, Holt JT. Decreased
expression of BRCA1 accelerates growth and is often present during spo-radic breast cancer progression. Nat Genet 1995;9:444–50.
(19) Ruffner H, Verma IM. BRCA1 is a cell cycle-regulated nuclear
phospho-protein. Proc Natl Acad Sci U S A 1997;94:7138–43.
(20) Scully R, Chen J, Plug A, Xiao Y, Weaver D, Feunteun J, et al. Association
of BRCA1 with Rad51 in mitotic and meiotic cells. Cell 1997;88:265–75.
(21) Porter DE, Cohen BB, Wallace MR, Smyth E, Chetty U, Dixon JM, et al.
Breast cancer incidence, penetrance and survival in probable carriers of BRCA1 gene mutation in families linked to BRCA1 on chromosome 17q12–21. Br J Surg 1994;81:1512–5.
(22) Tavtigian SV, Simard J, Rommens J, Couch F, Shattuck-Eidens D,
Neu-hausen S, et al. The complete BRCA2 gene and mutations in chromosome 13q-linked kindreds. Nat Genet 1996;12:333–7.
(23) Connor F, Smith A, Wooster R, Stratton M, Dixon A, Campbell E, et al.
Cloning, chromosomal mapping and expression pattern of the mouse Brca2 gene. Hum Mol Genet 1997;6:291–300.
(24) Abel KJ, Xu J, Yin GY, Lyons RH, Meisler MH, Weber BL. Mouse Brca1:
localization sequence analysis and identification of evolutionarily con-served domains. Hum Mol Genet 1995;4:2265–73.
(25) Milner J, Ponder B, Hughes-Davies L, Seltmann M, Kouzarides T.
Tran-scriptional activation functions in BRCA2 [letter]. Nature 1997;386:772–3.
(26) Chapman MS, Verma IM. Transcriptional activation by BRCA1 [letter].
Nature 1996;382:678–9.
(27) Sharan SK, Morimatsu M, Albrecht U, Lim DS, Regel E, Dinh C, et al.
Embryonic lethality and radiation hypersensitivity mediated by Rad51 in mice lacking Brca2. Nature 1997;386:804–10.
(28) Gowen LC, Johnson BL, Latour AM, Sulik KK, Koller BH. Brca1
defi-ciency results in early embryonic lethality characterized by neuroepithelial abnormalities. Nat Genet 1996;12:191–4.
(29) Vaughn JP, Cirisano FD, Huper G, Berchuck A, Futreal PA, Marks JR, et
al. Cell cycle control of BRCA2. Cancer Res 1996;56:4590–4.
(30) Easton DF, Steele L, Fields P, Ormiston W, Averill D, Daly PA, et al.
Cancer risks in two large breast cancer families linked to BRCA2 on chromosome 13q12–13. Am J Hum Genet 1997;61:120–8.
(31) Phelan CM, Lancaster JM, Tonin P, Gumbs C, Cochran C, Carter R, et al.
Mutation analysis of the BRCA2 gene in 49 site-specific breast cancer families [published erratum appears in Nat Genet 1996;13:16–7]. Nat Genet 1996;13:120–2.
Notes
The pathology review and meetings of the Breast Cancer Linkage Consortium were supported by the European Union Concerted Action. We would also like to acknowledge the support from the following sources: Cancer Research Cam-paign; South Thames Regional Health Authority; Imperial Cancer Research Fund; Public Health Service grant CA61231 (to B. Weber) from the National Cancer Institute, National Institutes of Health, Department of Health and Human Services; La Ligue Nationale contre le Cancer; FEGEFLUC; Association pour la Recherche sur le Cancer; Groupement de Recherche et d’Etude sur les Genomes; The Dutch Cancer Society; Deutsche Krebshilfe e.V; the Icelandic Cancer So-ciety Science Fund; the Nordic Cancer Union; Schweizer Krebsliga; and Apple Computer UK Ltd.
We thank all the families, clinicians, and pathologists who have contributed to this study. We also thank the University of Liverpool and the Federation Na-tionale des Centres de Lutte contre le Cancer for providing microscopes and accommodations for the study.
Manuscript received October 28, 1997; revised May 18, 1998; accepted May 26, 1998.