www.elsevier.com / locate / cardiores www.elsevier.nl / locate / cardiores
Heterogeneity of resting and hyperemic myocardial blood flow in healthy
humans
a,c b c c ,
*
Panithaya Chareonthaitawee
, Philipp A. Kaufmann , Ornella Rimoldi , Paolo G. Camici
aDivision of Cardiovascular Diseases and Internal Medicine, Mayo Clinic and Foundation, Rochester, MN 55905, USA
b
¨
Cardiovascular Center, Nuclear Cardiology University Hospital, Zurich, Switzerland
c
MRC Clinical Sciences Centre, Imperial College School of Medicine, Hammersmith Hospital, Du Cane Road, London W12 ONN, UK Received 4 October 2000; accepted 18 December 2000
Abstract
Objective: Absolute myocardial blood flow (MBF) is not well-defined in large normal populations, and appears to be heterogeneous in
both humans and animals. These factors contribute to the difficulties in defining resting MBF to hibernating myocardium. We therefore assessed absolute baseline and hyperemic MBF in a large population of normal humans. Methods: MBF was quantified by positron emission tomography with oxygen-15-labeled water at baseline and during hyperemia induced by either adenosine or dipyridamole in 131 men and 38 women, aged 21–86 (mean 46612) years. MBF was corrected for workload using the rate-pressure product (RPP). Results: Uncorrected baseline MBF ranged from 0.590 to 2.050 (mean 0.98560.230) ml / min / g (coefficient of variation527%), and corrected MBF from 0.736 to 2.428 (mean 1.33060.316) ml / min / g (coefficient of variation524%). MBF in the inferior region was significantly (P,0.0001) lower than either the anterior or lateral regions. Baseline MBF in females was significantly (P,0.001) higher than in males.
Conclusions: These results confirm the heterogeneity of MBF in normals and highlight the difficulty in establishing the lower limit of
normal MBF. 2001 Elsevier Science B.V. All rights reserved. Keywords: Adenosine; Blood flow; Coronary circulation
1. Introduction geneity. Studies of MBF in larger populations might help
to overcome this limitation.
A number of recent studies using positron emission Several techniques are available for measuring coronary tomography (PET) have demonstrated that resting myocar- or myocardial blood flow in humans, including Doppler dial blood flow (MBF) to hibernating myocardium is often catheterization, quantitative coronary arteriography, ther-within normal limits [1–4]. This is in contrast with other modilution, and measurement of inert tracer clearance [15]. reports showing that resting flow to hibernating myocar- However, most methods are invasive and affected by dium is reduced [5]. Part of the problem lies in the fact that serious limitations [15]. Noninvasive assessment of MBF resting MBF is heterogeneous in both normal humans and may be performed with either single photon emission animals [6–14]. As a consequence, it is difficult to define computerized tomography (SPECT) or PET, but the phys-the range and particularly phys-the lower limit of normal resting ical limitations of SPECT do not permit absolute quantita-MBF. In addition, the small sample size of most published tion of MBF. On the other hand, PET overcomes some of reports could contribute, at least in part, to this hetero- these limitations by providing superior resolution and accurate attenuation and partial volume corrections, thus enabling reproducible absolute quantification of regional
*Corresponding author. Tel.: 3186; fax: 144-20-8383-3742.
E-mail address: [email protected] (P.G. Camici). Time for primary review 28 days.
0008-6363 / 01 / $ – see front matter 2001 Elsevier Science B.V. All rights reserved. P I I : S 0 0 0 8 - 6 3 6 3 ( 0 1 ) 0 0 2 0 2 - 4
15
MBF [16,17]. The aim of this study was therefore to The timing of the H O injection and scan for the2 measure absolute baseline and hyperemic MBF in a large dipyridamole hyperemic MBF was based on our previous group of normal volunteers using PET with oxygen-15 observation [19] that, on average, peak coronary
hy-15
labeled water (H O).2 peremic response to dipyridamole occurs 8 min after the
start of infusion or, 4 min following the end of the 15
dipyridamole infusion. The H O infusion was therefore2
2. Methods timed so that its peak coincided with the peak action of
dipyridamole. Blood pressure was recorded by Dynamap
2.1. Study population (Critikon, Tampa, FL, USA) at baseline and at 1-min
intervals during adenosine or dipyridamole infusion. The We have accumulated MBF data in a large group of heart rate and rhythm were monitored continuously normal volunteers from a number of different studies. The throughout the procedure by a microprocessor-driven current retrospective series was produced using this data- electrocardiographic recorder (Sirecust 341, Siemens, Ger-base. The study population consisted of 169 healthy many). One set of blood pressure and heart rate was 15 volunteers (38 women and 131 men) aged 21–86 years recorded to coincide with the peak action of the H O2 (mean6S.D., 46612 years). Volunteers were recruited by bolus and pharmacologic stress agent. A 12-lead electro-public advertising or from hospital staff. Volunteers over cardiogram (Marquette, Milwaukee, WI, USA) was ob-the age of 80 years were recruited from a ballroom dancing tained at baseline and every minute of the adenosine or class. The mean age of females was significantly higher dipyridamole infusion.
than that of males (54613 vs. 44611 years; P,0.0001). All subjects gave no history of cardiac or pulmonary
disease, hypertension, hyperlipidemia, diabetes, or smok- 2.3. PET scanning procedure ing. In 76 subjects a lipid profile was also obtained and
was within normal limits (mean total cholesterol 4.560.4, The PET scans were performed with an Ecat 931-08 / 12 range 1.9–5.3 mmol / l). All subjects gave history of 15-slice tomograph (CTI / Siemens, Knoxville, TN, USA). normal effort tolerance, had a normal cardiac and pulmon- The scanner enables the acquisition of 15 planes of data ary examination, and a normal resting electrocardiogram. over a 10.5-cm axial field of view, allowing the whole Based on these findings, all participants had a low clinical heart to be imaged. All emission and transmission data probability of coronary artery disease [18]. were reconstructed with a Hanning filter with a cut-off frequency of 0.5 units of reciprocal of the sampling
2.2. Study protocol interval of the projection data, achieving an image
res-3
olution of 8.438.336.6 mm full-width half maximum at The study protocol was approved by the Research Ethics the center of the field of view [20].
Committee of Hammersmith Hospital and radiation expo- All subjects were asked to abstain from caffeine-con-sure was licensed by the United Kingdom Administration taining beverages for 24 h before the scan. Blood was of Radioactive Substances Advisory Committee (ARSAC). drawn for caffeine levels, which were nonmeasurable in all The study conforms with the principles outlined in the subjects tested prior to the study. Subjects were positioned
68 Declaration of Helsinki. All participants gave informed in the scanner, and after exposure of a retractable Ge ring and written consent prior to the study. source, a 5-min rectilinear transmission scan was acquired Subjects were investigated by means of PET for the to determine the optimal imaging position of the left quantification of MBF (1) at baseline (n5169) and (2) ventricle within the field of view. A 20-min transmission during hyperemia (n5160) induced by standard intraven- scan was subsequently performed for the purpose of ous dipyridamole (0.56 mg / kg infused over 4 min, n583) attenuation correction of all emission scans. To maintain or adenosine (140 mg / kg / min, n577). Only dipyridamole the optimal imaging position of the subject within the was used in females (n536), and either dipyridamole scanner, a low power laser beam was superimposed on a (n547) or adenosine (n577) was used in males. This was cross-shaped ink mark on the subject’s chest and this because the female volunteers were part of the control position was kept constant throughout all the emission group for specific studies in which only dipyridamole was scans. Starting after a 30-s background frame, a bolus of
15
used. In a subgroup of 21 male subjects, repeated measure- H O (700–900 MBq) was injected intravenously over 202 ments of MBF were performed at rest and during adeno- s at an infusion rate of 10 ml / min. The venous line was sine-induced hyperemia. The two baseline studies were then flushed for another 2 min. The following scanning timed to be exactly 20 min apart, and the two hyperemic protocol was used: fourteen frames at 5 s, three frames at studies were also exactly 20 min apart. 10 s, three frames at 20 s, and four frames at 30 s, for a
15 15
For the measurement of MBF, a slow bolus of H O2 total scanning time of 310 s. The H O bolus injection /2 was injected 2 min after the beginning of adenosine scan was repeated after adenosine- or dipyridamole-in-infusion or 90 s after completion of dipyridamole dipyridamole-in-infusion. duced hyperemia.
2.4. PET image processing females after adjusting for age using the analysis of covariance. Simple regression analysis was also used to The acquired sinograms were corrected for attenuation correlate repeated flow estimates at baseline and during and reconstructed on a Microvax II computer (Digital hyperemia and to assess the relationship between baseline Equipment, Marlboro, MA, USA) using dedicated array and hyperemic MBF. ANOVA means table and Fisher’s processors and standard reconstruction algorithms. Images post-hoc test were used to assess the relationship between were then transferred to a Sun Sparc 2 workstation (Sun gender and baseline and hyperemic MBF. ANOVA and
´
Microsystems, Mountainview, CA, USA). Images were Scheffe’s posthoc test were used to assess differences in analyzed with customized MATLAB software (The Math- regional MBF of the whole group.
works Natick, MA, USA). Myocardial images were gener-15
ated directly from the dynamic H O study. Briefly,2
regions of interest defined in the lungs on the transmission 3. Results image provided the required variate and covariate factors
(the myocardial and blood time–activity curves) for All subjects tolerated the procedures well except for the modeling of factor sinograms by means of the recently common side effects of the adenosine or dipyridamole reported linear dimension reduction [21,22]. Factor images infusion, but none experienced chest pain or exhibited were generated by iterative reconstruction [23]. Regions of electrocardiographic changes suggestive of ischemia. For interest were then drawn in the left atrium and right the whole group of 169 subjects, the mean resting heart ventricle on four to six consecutive image planes and rate was 63610 (range 37–99) beats / min, systolic blood
15
projected onto the dynamic H O images to generate blood2 pressure 121615 (range 90–171) mmHg, and diastolic time–activity curves (arterial and venous input function). blood pressure 72610 (range 52–94) mmHg. The mean Similarly, four myocardial region of interest (septal, an- resting RPP was 762361689 (range 4488–14 157) terior, lateral and inferior) were drawn in the left ventricu- mmHg3beat / min. Age was linearly associated with lar myocardium on 12 consecutive planes and projected systolic (P50.0011), diastolic (P50.0177), and mean
15
onto the dynamic H O images to obtain tissue time–2 arterial pressure (P50.0083) There was also a linear, but activity curves. Arterial, venous and tissue input functions nonsignificant trend between age and RPP (P50.0900). were the fitted to a single tissue compartment tracer kinetic At peak adenosine-induced hyperemia, the mean heart three-parameter model to give values of regional and rate was 88615 (range 44–122) beats / min, systolic blood global MBF (ml / min / g) as previously described [23,24]. pressure 122616 (range 86–159) mmHg, diastolic blood When applied to the septum a four-parameter model was pressure 68610 (range 46–89) mmHg, and mean RPP was used in order to correct for the spillover from the right 1084362596 (range 4224–18 178) mmHg3beat / min. At
ventricle. peak dipyridamole-induced hyperemia, the mean heart rate
To account for the changes in MBF produced by cardiac was 90615 (range 60–131) beats / min, systolic blood workload, baseline MBF was also corrected for the rate pressure 126617 (range 85–173) mmHg, diastolic blood pressure product (RPP), an index of myocardial oxygen pressure 70610 (range 48–103) mmHg and mean RPP consumption, using the formula: MBFcorr5(MBFbaseline/ was 11 30762463 (range 7200–19 030) mmHg3beat /
4
RPP)310 . Coronary vasodilator reserve (CVR) was min. calculated as the ratio of MBFado / dip to MBFbaseline. In
addition, CVR was also calculated using baseline MBF 3.1. Baseline flow corrected for RPP as CVRcorr5MBFado / dip/ MBFcorr [17].
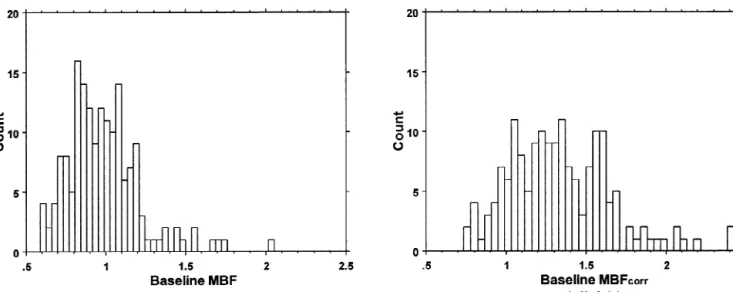
The frequency distributions of global (i.e. mean flow in
2.5. Statistical analysis the whole left ventricle) MBF and MBFcorr are shown in
Fig. 1. MBF was 0.98560.230 ml / min / g (range 0.590– All values are reported as mean6S.D. Statistical analy- 2.050 ml / min / g, coefficient of variation 27%) and sis was performed using the Statview package (SAS MBFcorr 1.33060.316 ml / min / g (range 0.736–2.428 ml / Institute, Cary, NC, USA). The coefficient of variation was min / g, coefficient of variation 24%).
used to demonstrate the degree of variability of MBF and
CVR. A standard Wald-type test was used to compare the 3.1.1. Effects of age and gender
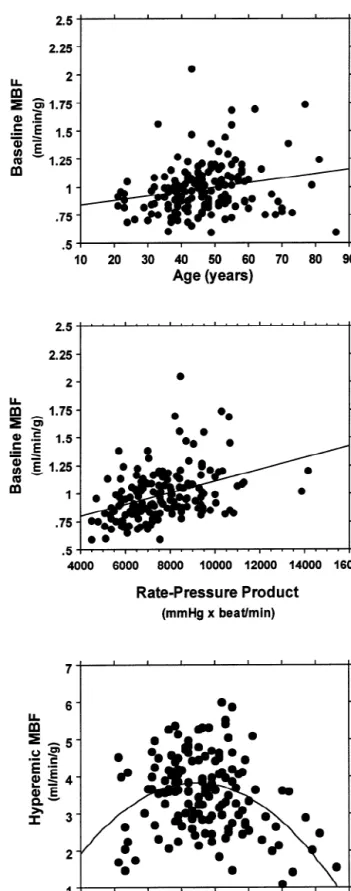
coefficients of variation between the first and second flow MBF showed a significant linear association with age assessments at baseline and during hyperemia [25]. Paired (Fig. 2, top), which is partly explained by the trend for an t-tests were used to compare regional MBF within in- association between age and RPP. The latter is in turn dividuals at a single time point. Simple, multiple and significantly associated with MBF (Fig. 2, middle). In polynomial regression were performed to assess the rela- females MBF (1.18260.251 ml / min / g) and MBFcorr tionships between independent variables (age, gender, (1.56360.322 ml / min / g) were significantly higher than hemodynamic variables, stressor) and MBF and CVR. MBF (0.93060.191 ml / min / g) and MBFcorr Gender comparison was performed between males and (1.26560.284 ml / min / g) in males (P,0.001, for both
Fig. 1. Frequency distribution of (left) uncorrected baseline global MBF (coefficient of variation 27.1%) and (right) baseline global MBFcorr(coefficient of variation 24.0%).
comparison). The study population was skewed towards a rized by the average coefficient of variation, which was larger number of males and older females. However, MBF 1368% for both uncorrected and corrected estimates of in females remained significantly higher than in males baseline flow.
(P,0.0001) after adjustment for age. Moreover, neither
age nor the interaction between age and gender showed 3.1.3. Temporal heterogeneity
any significance after adjustment for gender (P50.81). In the subgroup of 21 individuals undergoing repeated Regional flows were related to age in a manner similar to assessment of MBF, there was no significant difference that observed for global flows and values were signifi- between the coefficients of variation (19.1627 vs. 19.1913; cantly higher in females in all segments (Table 1). After P5NS) for the first and the second baseline MBFcorr. adjustment for age, gender remained significant (P, There was a good correlation between the two baseline 0.0001). Neither age nor the interaction between age and MBFcorr measurements (r50.756; P,0.0001). Moreover, gender showed any significance after adjustment for for each region, the coefficients of variation between the
gender for each region. first and second regional baseline MBFcorr were not
significantly different. 3.1.2. Spatial heterogeneity
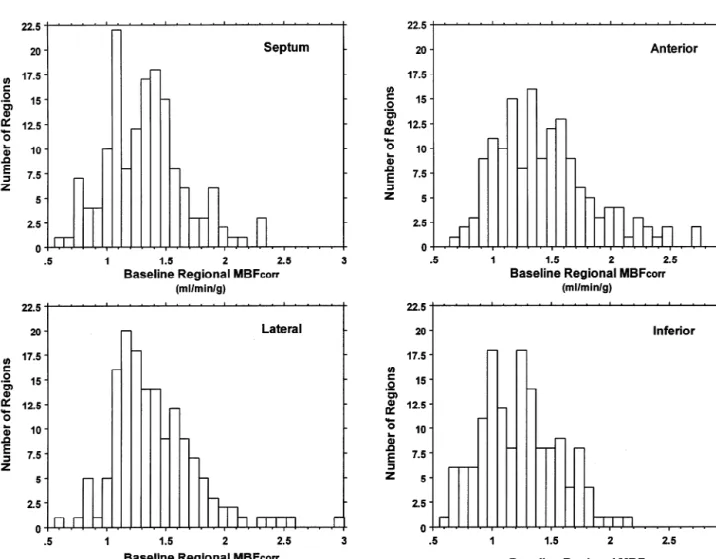
The distribution of MBFcorr within each myocardial 3.2. Hyperemic flow region in the whole study population is illustrated in Fig. 3.
MBFcorr was 1.33360.329 ml / min / g in the septum, Global hyperemic MBF was 3.54261.010 ml / min / g 1.44360.4113 ml / min / g in the anterior wall, (range 1.110–5.990 ml / min / g, coefficient of variation 1.40560.385 ml / min / g in the lateral wall and 29%).
1.23260.322 ml / min / g in the inferior wall. The overall
ANOVA P value for regional MBFcorr was ,0.0001, with 3.2.1. Comparison between adenosine- and an F factor of 9.145. Posthoc analysis showed significant dipyridamole-induced hyperemia
differences in MBF among the following segments: in- Females received only dipyridamole for pharmacologic ferior vs. anterior (P,0.0001) and inferior vs. lateral vasodilation while males received either dipyridamole or
(P,0.0001). adenosine for reasons stated previously (see Methods).
The true variability of baseline MBF was assessed by Therefore, the comparison of adenosine- vs. dipyridamole-comparing paired estimates of regional baseline MBF induced hyperemia was performed only in males. Hy-within each individual at a single time point. There were peremic MBF response to adenosine (mean 3.76660.854, significant differences in both uncorrected and corrected range 1.851–5.990) was significantly (P50.0114) higher estimates of baseline myocardial blood flow among the than that to dipyridamole (mean 3.10761.120, range following regions: anterior vs. inferior (P,0.001); anterior 1.100–5.270) at these doses of stressors.
vs. septum (P,0.001); inferior vs. lateral (P,0.001);
inferior vs. septum, (P,0.001); and lateral vs. septum 3.2.2. Effects of age and gender
(P,0.001), but not between anterior vs. lateral segments. Gender differences in hyperemic MBF were tested only The dispersion among these four regions may be summa- for dipyridamole-induced hyperemia. The gender
differ-Fig. 2. Scatterplot showing the relationship between (top) age and uncorrected baseline global MBF ( y 5 0.803 1 0.004x; r 5 0.21; P 5 0.0086, (middle) 25
RPP and uncorrected baseline global MBF ( y 5 0.593 1 5.217 3 10 x; r 5 0.39; P , 0.0001) and (bottom) age and hyperemic global MBF ( y 5 0.666 1
2
0.142x 2 0.002x ; r 5 0.41; P , 0.0001). The data points in the bottom panel illustrate the lower hyperemic MBF in subjects older than 55 years. In the few youngest subjects (six of nine), hyperemic MBF was also lower than the mean for the group.
Table 1
a
Segmental MBF in females and males
Region Uncorrected MBF (ml / min / g) Corrected MBF (ml / min / g)
Females Males P Females Males P
Septum 1.17860.351 0.93060.206 ,0.0001 1.51960.314 1.28160.322 0.0002
Anterior 1.34560.421 0.98060.260 ,0.0001 1.73860.411 1.35760.378 ,0.0001
Lateral 1.34360.457 0.95660.196 ,0.0001 1.72060.430 1.30860.270 ,0.0001
Inferior 1.08960.324 0.85960.192 0.0001 1.40360.284 1.17860.315 0.0002
a
Data are expressed as mean6standard deviation.
ence observed for baseline MBF was not present for 0.750–6.980 ml / min / g. The histogram in Fig. 4. top hyperemic MBF. There also appears to be a quadratic illustrates the broad range of distribution of regional relation between age and hyperemic MBF (Fig. 2, bottom) hyperemic flow in the whole population. However, there with flows lower than the group’s mean in subjects older were no statistically significant differences (ANOVA) in than 55 years and in few youngest subjects (six of nine). hyperemic MBF among the four myocardial regions. The true spatial heterogeneity for each individual at a single
3.2.3. Spatial heterogeneity time point was shown by the statistically significant
Similarly to baseline, regional hyperemic MBF showed difference in MBF between the inferior wall and all the a considerable range of responses: septum, 0.915–7.305; other regions (P,0.001 in each case). The dispersion was anterior, 1.150–8.134; lateral, 1.050–7.153; and inferior, slightly greater than for baseline MBF with a coefficient of
Fig. 3. Histogram of corrected baseline regional MBF. The coefficient of variation for each segment was: septum, 24.7%; anterior, 28.6%; lateral, 25.3% and inferior 26.1%.
variation of 17610%. To test whether the hyperemic response was related to baseline MBF, we compared baseline and hyperemic MBF in the same regions. Fig. 4, bottom illustrates the lack of correlation between baseline and hyperemic MBF in each region (r50.23; P5NS). In other words, regions with a higher baseline flow were not more likely to have higher hyperemic response than regions with a lower baseline flow.
3.2.4. Temporal heterogeneity
In the 21 individuals undergoing repeated assessment of MBF, there was no significant difference between the coefficients of variation (23.6534 vs. 25.2366; P5NS) for the first and the second hyperemic MBF. Likewise there were no regional differences in the coefficients of variation for hyperemic flows.
3.3. Coronary vasodilator reserve
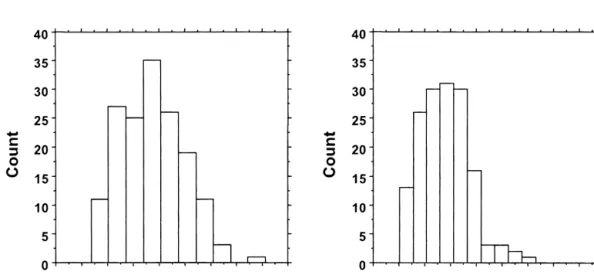
Global CVR with adenosine and dipyridamole showed a wide range of responses from 1.360 to 8.130 (mean 3.75361.240) for uncorrected and from 1.020 to 6.300 (mean 2.79460.947) for corrected (Fig. 5). The relation-ship between age and CVR follows a similar pattern observed for age and hyperemic MBF (Fig. 2, bottom). There was also a wide distribution of regional CVRcorr. There was no significant difference in either uncorrected or corrected CVR among different regions.
4. Discussion
In the present study, we have investigated the limits of
Fig. 4. Histogram showing the distribution of hyperemic regional MBF in
MBF in a large population of healthy males and females
the population (top). The coefficient of variation was 34.1%. Scatterplot
over a broad range of ages. We specifically selected human
(bottom) comparing baseline MBF hyperemic MBF for the same region
subjects with a low likelihood for coronary artery disease
demonstrates a lack of correlation between baseline and maximal flow
patterns (r 50.23; P 5NS). [18]. The results can be summarized as follows. (1) In this
population, baseline and hyperemic MBF are heteroge- In conscious primates, the heterogeneity of MBF before neous both within and between individuals. Baseline and coronary occlusion can explain the variability in myocar-hyperemic MBF exhibit a similar degree of spatial hetero- dial salvage following reperfusion. The presence of higher geneity which appears to be temporally stable. (2) precoronary occlusion resting MBF may predict the pro-Baseline, but not hyperemic, MBF is significantly higher in pensity for infarction in that region [12]. In our inves-females than in males. (3) There is a significant linear tigation of normal humans, baseline MBF did not predict association between age and baseline MBF that is in part hyperemic MBF in the same region. The result is a wide related to changes in external cardiac workload with age. range of regional CVR, which has important clinical (4) Hyperemic MBF declines over 65 years of age. (5) At implications. Measurements of regional CVR of less than the doses employed in the present study, adenosine-in- 2.5 are often interpreted as impaired vasodilator capacity. duced hyperemic MBF is significantly higher than However, in our population of normal volunteers, many dipyridamole-induced hyperemic MBF. left ventricular segments have a CVR, both uncorrected Our results are in agreement with previous animal and and RPP-corrected, of less than 2.5. This distribution of human studies [7,11–13,26–29] that have provided evi- both MBF and CVR must be recognized before defining dence for significant heterogeneity of global and regional these parameters as abnormal. These findings may also baseline MBF. A number of considerations suggest that explain, at least in part, the patchy distribution of myocar-this heterogeneity reflects a true biologic phenomenon. dial injury within a given region and suggests that there First, there is spatial heterogeneity of MBF within each may be regions operating near maximal capacity in the individual to support the overall variability of global MBF. baseline state, becoming more susceptible to injury when Second, the degree of spatial heterogeneity exhibited in demand exceeds supply [12].
this study is similar to that found in animal [6,8,10–
12,30,31] and smaller human [13,26,27] studies using 4.1. Aging, myocardial blood flow and coronary different methods with different spatial resolution to vasodilator reserve
estimate MBF, suggesting that our observation is not a
methodological artifact. Third, this spatial heterogeneity The influence of age on baseline MBF has been previ-exhibits remarkable temporal stability. Fourth, the tempo- ously investigated by our and other groups with PET ral variability of PET is small as demonstrated by the high [13,28,40]. The results of the present study confirm that repeatability of MBF measured 20 min apart in the same baseline MBF increases linearly with age with greater
subjects [17]. heterogeneity of baseline MBF in the oldest individuals
Both temporal and spatial heterogeneity of MBF have (Fig. 2, top). Furthermore, the linear association between been described in animals [10], however, the underlying age and baseline MBF seems to be explained in part by the physiologic mechanism for the heterogeneity of baseline linear association between age and RPP.
MBF in humans remains ill defined. We have already In agreement with previous studies [26,28,41–43] we demonstrated [17] that PET estimates of MBF are re- find that hyperemic MBF declines with increasing age producible over time. Small temporal fluctuations in (Fig. 2, bottom). Therefore, in subjects older than 65 years, baseline MBF may be attributed to ‘twinkling’ of capillary the combination of the increase in baseline and reduction flows [30] and / or time-dependent changes in regional in hyperemic MBF leads to an even larger decrease in metabolic requirements coupled to local autoregulatory CVR. These changes are likely to results from the combi-changes in blood flow [6,8,32]. In addition, the spatial nation of a number of mechanical and neurohumoral heterogeneity of MBF may be also attributed to the fractal factors associated with aging including increased arterial nature of regional flow distribution [33,34] and different impedance, thickening of left ventricular myocardium, neural regulatory modulation in different regions and reduced lusitropism, reduced catecholamine-responsive-layers of the left ventricle [10,32]. Differences in transmur- ness, endothelial dysfunction and deficient neuroendocrine al MBF distribution across the left ventricle [35–39] may regulation [26,44–46]. We believe that this decrease in also contribute to the spatial heterogeneity although their CVR is a true phenomenon since other investigators, using magnitude is smaller than the overall heterogeneity [32]. different techniques, have found similar results. With As demonstrated by our results, the inter-individual regard to the apparent reduction in hyperemic MBF in the variability of hyperemic MBF is even greater than that youngest individuals (Fig. 2C), it is worth noting that observed for baseline MBF. Both age and the type of because of the limitations due to ethical issues, only a vasodilator used determine the degree of hyperemia small number of subjects were studied. Therefore, we achieved and thus are sources of variability. Therefore, cannot rule out a sampling bias, although the fit of the these factors need to be considered when comparisons of curve is statistically significant. Finally, there are no data different populations are performed. On the other hand, the on whether aging modulates the pharmacological effects of intrinsic variability due to spatial heterogeneity within the dipyridamole and adenosine, but it is conceivable that peak same hearts was found to be limited to a consistently lower vasodilation could occur at different times in younger than
4.2. Gender, myocardial blood flow and coronary cant coronary stenoses unlikely. Similarly, we cannot vasodilator reserve completely rule out age-related changes in ventricular function and morphology, which may result in an abnor-We and others have previously reported gender differ- mal flow reserve, although there were no electrocar-ences in baseline MBF [28,47,48]. The present inves- diographic abnormalities suggesting underlying pathology. tigation in a larger population confirms that baseline MBF Along these lines, it is beyond the scope of this study to is higher in females even after RPP correction. Although in determine whether the lack of response to coronary the whole study population the mean age of females was vasodilator stimuli in the absence of coronary artery significantly higher than that of males, after adjustment for disease is a true biological phenomenon in some indi-age, the influence of gender on baseline MBF remained viduals. Since there are reports that the standard dose of significant. This difference can be explained, at least in dipyridamole (0.56 mg / kg) does not consistently produce part, by the well known effects of estrogens on vascular maximal vasodilatory effect in all individuals [42], it is tone in female subjects with coronary artery disease [49]. conceivable that there are nonresponders, perhaps as a Using dipyridamole as vasodilator, we found higher result of operating near maximal capacity at baseline [12], hyperemic flow in females than in males although this differences in dietary influences [50], or variations in the difference fell short of statistical significance. Similar pharmacological effects of these vasodilator stimuli. Al-findings were noted in previous studies using the same though patients were instructed not to consume caffeine-protocol of dipyridamole infusion in syndrome X patients, containing foods and beverages prior to the study, we did and using either adenosine or dipyridamole infusion in not measure caffeine levels in all patients, leaving a normal subjects [28,47]. While females in our study had possibility of a blunted vasodilator effect due to the slightly higher hyperemic flow than males, their CVR was presence of xanthines. (2) Our population was skewed overall lower than in males due to the females’ higher towards fewer and older females. Nevertheless, we were baseline flow. The latter point should be taken into account able to perform meaningful statistical analyses on this
when assessing CVR in females. distribution of females and males. Unfortunately, we did
not have the estrogen status of the female subjects in this study and therefore could not provide further analyses on 4.3. Hyperemic response and stressor
the effects of estrogen on MBF and delineate whether estrogen is the mechanism of higher flow in women than in In our group of normal men, adenosine at a dose of 140
men. (3) The resolution of the scanner in this study does mg / kg / min appears to induce a slightly greater hyperemia
not permit evaluation of smaller regions of interest, which than dipyridamole at a dose of 0.56 mg / kg although there
may provide a closer insight into the mechanisms underly-was considerable overlap of hyperemic response between
ing the observed flow variability. In particular, it was not the two agents. In a previous study with PET, MBF
within the scope of this study to differentiate as to whether hyperemic response was measured twice with both
adeno-the observed reduction in flow to adeno-the inferior wall com-sine and dipyridamole in 20 normal men and no significant
pared to other regions is a true biological phenomenon or a difference in the level of hyperemia was detectable
be-methodological artifact. However, a lower basal average tween the two agents [40]. This disagreement could be due
peak velocity measured by Doppler-tipped guide wire has to a variance of inter-individual responsiveness to
inhibi-previously been observed [51], suggesting the possibility tion of phosphodiesterase and / or density of A receptors.2 that the lower inferior baseline flow may be a true Therefore it can be assumed that the two drugs are
biological phenomenon. Furthermore, since baseline flow equipotent in the same subject, but direct stimulation of A2 is closely coupled to myocardial workload and oxygen receptors with adenosine is more likely to induce in the
consumption, it could be hypothesized that these differ-majority of cases maximal vasodilatation.
ences in regional blood flow are the consequence of parallel differences in workload and oxygen consumption.
4.4. Limitations of the study Unfortunately, in our study, we did not assess regional
workload nor oxygen consumption, and therefore we The present study has several potential limitations. (1) cannot prove whether this hypothesis is correct. A number Although this group of subjects was carefully screened for of methodological reasons could also account, at least in coronary artery disease and was at low-risk by history, part, for the observed regional changes. Most importantly, physical examination, and laboratory results, asymptomatic changes in regional wall thickness could result in different coronary artery disease may still exist, particularly in the partial volume effects and count recovery. However, since older adults. A coronary angiogram would provide defini- our data are corrected for partial volume, this does not tive data, but ethical considerations restrain invasive seem to be the reason. Finally, different amounts of diagnostic in healthy subjects. CVR assessment, however, spillover from neighboring organs with high activity such revealed no evidence of regional deficits in any of the as liver or spleen may have a more significant impact on subjects, making the presence of hemodynamically signifi- the inferior wall.
[10] Marcus ML, Kerber RE, Ehrhardt JE et al. Spatial and temporal
5. Conclusions
heterogeneity of left ventricular perfusion in awake dogs. Am Heart J 1977;94:748–754.
The results of the present investigation confirm and [11] Austin Jr. RE, Aldea GS, Coggins DL et al. Profound spatial extend previous findings on the variability of baseline and heterogeneity of coronary reserve: discordance between patterns of resting and maximal myocardial blood flow. Circ Res 1990;67:319–
hyperemic MBF in humans. Our results demonstrate that a
331.
number of factors including age, gender, cardiac workload
[12] Ghaleh B, Shen YT, Vatner SF. Spatial heterogeneity of myocardial
and type of vasodilator drug must be taken into account blood flow presages salvage vs. necrosis with coronary artery when considering the limits of distribution of MBF in reperfusion in conscious baboons. Circulation 1996;94:2210–2215.
¨
[13] Czernin J, Muller P, Chan S et al. Influence of age and
hemo-normal human subjects. These data have important
impli-dynamics on myocardial blood flow and flow reserve. Circulation
cations for the interpretation of myocardial perfusion
1993;88:62–69.
studies in patients and the understanding of the patho- [14] Uren NG, Melin JA, De Bruyne B et al. Relation between physiology of hibernating myocardium. myocardial blood flow and the severity of coronary artery stenosis.
New Eng J Med 1994;330:1782–1788.
[15] Marcus ML, Wilson RF. Methods of measurement of myocardial blood flow in patients: a critical review. Circulation 1987;37:636–
Acknowledgements
639.
[16] Phelps ME, Maziotta JC, Schelbert HR. Positron emission
tomog-This work was presented in part at the American Heart raphy and autoradiography: principles and applications for the brain and the heart, New York: Raven Press, 1986.
Association 72nd Scientific Sessions, Circulation 100: 456,
[17] Kaufmann PA, Gnecchi-Ruscone T, Yap JT et al. Assessment of the
1999. We are indebted to Dr. Raymond J. Gibbons for his
reproducibility of baseline and hyperemic myocardial blood flow
constructive criticism. We gratefully acknowledge the measurements with oxygen-15 labeled water and PET. J Nucl Med technical assistance of the radiographers of the MRC 1999;40:1848–1856.
[18] Diamond GA, Forrester J. Analysis of probability as an aid in the
Cyclotron Unit, Hammersmith Hospital. Dr.
Chareon-clinical diagnosis of coronary artery disease. New Eng J Med
thaitawee was supported by a grant from the Mayo Clinic
1979;300:1350–1358.
and Foundation. Dr. Kaufmann was funded by a grant [19] Radvan J, Marwick TH, Williams MJ et al. Evaluation of the extent from the Swiss National Science Foundation, SCORE B and timing of coronary hyperemic response to dipyridamole: a study
32-55002.98. with transesophageal echocardiography and positron emission
tomography with oxygen 15 water. J Am Soc Echocardiogr 1995;8:864–873.
[20] Spinks TJ, Jones T, Gilardi MC et al. Physical performance of the
References latest generation of commercial positron scanner. IEEE Trans Nucl
Sci 1988;35:721–725.
[1] Camici PG, Rimoldi O. Resting myocardial blood flow in patients [21] Hermansen F, Lammertsma AA. Linear dimension reduction of with hibernating myocardium quantified by positron emission sequences of medical images: I. optimal inner products. Phys Med tomography. Basic Res Cardiol 1997;92:6–8. Biol 1995;40:1469–1481.
[2] Gerber BL, Vanoverschelde JL, Bol A et al. Myocardial blood flow, [22] Hermansen F, Bloomfield PM, Ashburner J et al. Linear dimension glucose uptake, and recruitment of inotropic reserve in chronic left reduction of sequences of medical images: II direct sum decomposi-ventricular ischemic dysfunction. Implications for the pathophysiol- tion. Phys Med Biol 1995;40:1921–1941.
ogy of chronic myocardial hibernation. Circulation 1996;94:651– [23] Hermansen F, Rosen SD, Fath-Ordoubadi F et al. Measurement of
659. myocardial blood flow with oxygen-15 labelled water: comparison
[3] Marinho N, Keogh BE, Costa DC et al. Pathophysiology of chronic of different administration protocols. Eur J Nucl Med 1998;25:751– left ventricular dysfunction: new insights from the measurement of 759.
absolute myocardial blood flow and glucose utilization. Circulation [24] Araujo LI, Lammertsma AA, Rhodes CG et al. Noninvasive 1996;93:737–744. quantification of regional myocardial blood flow in coronary artery [4] Vanoverschelde J-L, Wijns W, Depre C et al. Mechanisms of chronic disease with oxygen-15-labeled carbon dioxide inhalation and
regional postischemic dysfunction in humans: new insights from the positron emission tomography. Circulation 1991;83:875–885. study of non-infarcted collateral-dependent myocardium. Circulation [25] Sokal RR, Rohlf FJ. Biometry, New York: W.H. Freeman, 1969. 1993;1993(87):1513–1523. [26] Senneff MJ, Geltman EM, Bergmann SR et al. Noninvasive [5] Rahimtoola SH. A perspective on the three large multicenter delineation of the effects of moderate aging on myocardial
perfu-randomized clinical trials of coronary bypass surgery for chronic sion. J Nucl Med 1991;32:2037–2042.
stable angina. Circulation 1985;72(Suppl V):123–135. [27] Bergmann SR, Herrero P, Markham J et al. Noninvasive quantitation [6] Franzen D, Conway RS, Zhang H et al. Spatial heterogeneity of of myocardial blood flow in human subjects with oxygen-15-labeled local blood flow and metabolite content in dog hearts. Am J Physiol water and positron emission tomography. J Am Coll Cardiol
1988;254:H344–H353. 1989;14:639–652.
[7] Camici PG, Gropler RJ, Jones T et al. The impact of myocardial [28] Uren NG, Camici PG, Melin JA et al. Effect of aging on myocardial blood flow quantitation with PET on the understanding of cardiac perfusion reserve. J Nuc Med 1995;36(11):2032–2036.
diseases. Eur Heart J 1996;17:25–34. [29] Camici PG, Wijns W, Borgers M et al. Pathophysiological mecha-[8] King RB, Bassingthwaighte JB, Hales JRS et al. Stability of nisms of chronic reversible left ventricular dysfuncion due to heterogeneity of myocardial blood flow in normal awake baboons. coronary artery disease (hibernating myocardium). Circulation
Circ Res 1985;57:285–295. 1997;96:3205–3214.
[9] Kirk ES, Honig CR. Nonuniform distribution of blood flow and [30] Yipintsoi T, Dobbs Jr. WA, Scanlon PD et al. Regional distribution gradients of oxygen tension within the heart. Am J Physiol of diffusible tracers and carbonized microspheres in the left ventricle 1964;207:661–668. of isolated dog hearts. Circ Res 1973;33:573–587.
[31] Wolpers HG, Geppert V, Hoeft A et al. Estimation of myocardial [42] Rossen JD, Simonetti I, Marcus ML et al. Coronary dilation with blood flow heterogeneity by transorgan helium transport functions. standard dose dipyridamole and dipyridamole combined with hand-Pfluegers Arch 1984;401:217–222. grip. Circulation 1989;79:566–572.
[32] Deussen A. Blood flow heterogeneity in the heart. Basic Res Cardiol [43] Wilson RF, Wyche K, Christensen BV et al. Effects of adenosine on 1998;93:430–438. human coronary arterial circulation. Circulation 1990;82:1595– [33] Bassingthwaighte JB, King RB, Roger SA. Fractal nature of regional 1606.
¨
myocardial blood flow heterogeneity. Circ Res 1989;65:578–590. [44] Luscher TF, Noll G. Endothelium-dependent vasomotion in aging, [34] Van Beek JHGM, Roger SA, Bassingwaigthe JB. Regional myocar- hypertension and heart failure. Circulation 1993;87(Suppl VII):97–
dial flow heterogeneity explained with fractal netwoks. Am J 103.
Physiol 1989;257:H1670–H1680. [45] Egashira K, Inou T, Hirooka Y et al. Effects of age on endothelium-[35] Reneman RS, Verheyen W, van Greven W et al. The importance of dependent vasodilation of resistance coronary arteries by
acetyl-size and diameter distribution of the microspheres for accurate choline in humans. Circulation 1993;88:77–81.
determination of regional myocardial blood flow (MBF). Bibl Anat [46] Lakatta EG. Deficient neuroendocrine regulation of the cardiovascu-1977;15:30–34. lar system with advancing age in healthy humans. Circulation [36] Prinzen FW, van der Vusse GJ, Reneman RS. Blood flow distribution 1993;87:631–636.
in the left ventricular free wall in open-chest dogs. Basic Res [47] Rosen SD, Uren NG, Kaski J-C et al. Coronary vasodilator reserve, Cardiol 1981;76:431–437. pain perception, and sex in patients with syndrome X. Circulation [37] Ball RM, Bache RJ, Cobb FR et al. Regional myocardial blood flow 1994;90:50–60.
during graded treadmill exercise in the dog. J Clin Invest [48] Duvernoy CS, Meyer C, Seifert-Klauss V et al. Gender differences in 1975;55:43–49. myocardial blood flow dynamics: lipid profile and hemodynamic [38] Cobb FR, Bache RJ, Greenfield Jr. JC. Regional myocardial blood effects. J Am Coll Cardiol 1999;33:463–470.
flow in awake dogs. J Clin Invest 1974;53:1618–1625. [49] Collins P, Rosano GMC, Sarrel P et al. 17b-Estradiol attenuates [39] Prokop EK, Strauss HW, Shaw J et al. Comparison of regional acetylcholine-induced coronary arterial constriction in women but myocardial perfusion determined by ionic potassium-43 to that not men with coronary heart disease. Circulation 1995;92(1):24–30. determined by microspheres. Circulation 1974;50:978–984. [50] Smits P, Thien TH, van’t Laar A. Circulatory effects of coffee in [40] Chan SY, Brunken RC, Czernin J et al. Comparison of maximal relation to the pharmacokinetics of caffeine. Am J Cardiol
myocardial blood flow during adenosine infusion with that of 1985;56:958–963.
intravenous dipyridamole in normal men. J Am Coll Cardiol [51] Kern MJ, Bach RG, Mechem CJ et al. Variations in normal coronary 1992;20:979–985. vasodilatory reserve stratified by artery, gender, heart transplantation [41] Verani MS, Mahmarian JJ, Hixon JB et al. Diagnosis of coronary and coronary artery disease. J Am Coll Cardiol 1996;28:1154–1160.
artery disease by controlled vasodilation with adenosine and thallium-201 scintigraphy in patients unable to exercise. Circulation 1990;82:80–87.