Vol. 2 0 No. 1 I N F E C T I O N C O N T R O L A N D H O S P I T A L E P I D E M I O L O G Y
PREVALENCE AND R I S K FACTORS F O R NOSOCOMIAL
INFECTIONS I N F O U R UNIVERSITY HOSPITALS IN
SWITZERLAND
Didier Pittet, MD, MS; Stephan Harbarth, MD; Christian Ruef, MD; Patrick Francioli, MD; Philippe Sudre, MD, MS; Christiane Petignat, MD; Andrej Trampuz, MD; Andreas Widmer, MD, MS
ABSTRACT
OBJECTIVE: To determine the prevalence and risk factors for nosocomial infections (NIs) in four Swiss university hospitals.
DESIGN AND SETTING: A 1-week period-prevalence survey conducted in May 1996 in medical, surgical, and intensive-care wards of four Swiss university hospitals (900-1,500 beds). Centers for Disease Control and Prevention definitions were used, except that asymptomatic bacteriuria was not categorized as NI. Study variables included patient demographics, primary diagnosis, comorbidities, exposure to medical and surgical risk factors, and use of antimicrobials. Risk factors for NIs were determined using logistic regression with adjustment for length of hospital stay, study center, device use, and patients' comorbidities.
RESULTS: 176 NI were recorded in 156 of 1,349 screened patients (11.6%; interhospital range, 9.8%-13.5%). The most fre-quent NI was surgical-site infection (53; 30%), followed by urinary tract infection (39; 22%), lower respiratory tract infection (27; 15%), and bloodstream infection (23; 13%). Prevalence of NI was higher in critical-care units (25%) than in medical (9%) and surgical wards
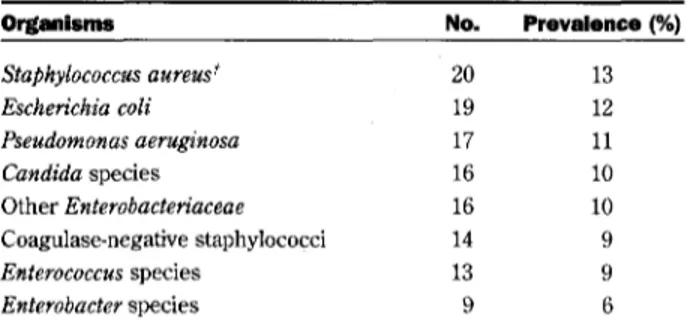
(12%). Overall, 65% of NIs were culture-proven; the leading pathogens were Enterobacteriaceae (44; 28%), Staphylococcus aureus (20; 13%), Pseudomonas aeruginosa (17; 11%), and Candida species (16; 10%). Independent risk factors for NI were central venous catheter (CVC) use (odds ratio [OR], 3.35; 95% confidence interval [CI%], 2.91-3.80), admission to intensive care (OR, 1.75; CI95, 1.30-2.21), emergency admission (OR, 1.57; CI95, 1.15-2.00), impaired functional status (Karnofsky index 1-4: OR, 2.56; CI95, 1.95-3.17), and McCabe classification of ultimately fatal (OR, 2.50; CI95,2.04-2.96) or rapidly fatal (OR, 2.25; CI95,1.52-2.98) underlying condition.
CONCLUSIONS: According to the results of this survey, NIs are frequent in Swiss university hospitals. This investigation confirms the importance of CVCs as a major risk factor for NI. Patient comorbidities must be taken into account to adjust for case mix in any study comparing interhospital or intrahospital infection rates (Infect Control Hosp Epidemiol 1999;20:37-42).
Patients admitted to the hospital are at risk of noso-comial infection (NI). Surveillance of NIs has been widely accepted throughout the world as a primary step toward prevention of NI.12 The gold standard is a prospective, on-site, continuous, hospitalwide surveillance; however, these incidence surveys require exhaustive resources. Therefore, prevalence studies, which are easier to perform and less expensive, often are conducted to provide baseline information about the occurrence of NI and to help estab-lish priorities for infection control.3"5
In Switzerland, the concept of patient-oriented sur-veillance of NI was introduced in the 1980s as previously
described.6 The five university hospitals in Switzerland and their infection control programs have been linked together in the Swiss Noso network since 1992. On the basis of this network and with the support of the Swiss Society for Hospital Hygiene, the first Swiss prevalence study on NIs was conducted in May 1996 in selected wards of four
(Basel, Geneva, Lausanne, and Zurich) of those five teach-ing hospitals.
The objective of this survey was to determine the prevalence and risk factors of NIs at four Swiss university centers, after adjustment for case mix, patient comorbidi-ties, extrinsic risk factors, length of hospital stay, and study
From the University Hospitals of Geneva (Drs. Pittet, Harbarth, and Sudre), Geneva; the University Hospital of Zurich (Dr. Ruef), Zurich; the University Hospital of Lausanne (Drs. Francioli and Petignat), Lausanne; the University Hospital of Basel (Drs. Trampuz and Widmer), Basel, Switzerland.
The authors thank the numerous people in the participating hospitals whose dedicated data recording made this work possible (in particular Inge Fey, Centa Haberthiir, Joachim Firmino, Pia Raselli, Monique Van Hoof, Marie-Claude Veuthey, Francoise Billod, Chantal Probst, Annik Maziero, Pascale Copin, Nicole Henry, Anna Alexiou, Valerie Sauvan, and Sylvie Touvenau). They wish also to thank N. Colaizzifor her invaluable help in data processing.
This study was presented in part at the Seventh Annual Meeting of the Society for Healthcare Epidemiology of America; April 29,1997; St Louis, MO; Infect Control Hosp Epidemiol 1997;18(suppl 2):31; and at the Eighth European Congress of Clinical Microbiology and Infectious Diseases; May 25-28, 1997; Lausanne, Switzerland; Clinical Microbiology and Infection 1997;3(suppl 2):210.
The study was supported by an educational grant of the Swiss Society for Hospital Hygiene and the Federal Office for Public Health.
Address reprint requests to Didier Pittet, MD, MS, Infection Control Program, Department of Internal Medicine, Hopital Cantonal Universitaire, 24, rue Micheli-du-Crest, 1211 Geneva 14, Switzerland.
97-OA-154. Pittet D, Harbarth S, RuefC, Francioli P, Sudre P, Petignat C, Trampuz, Widmer A. Prevalence and risk factors for nosocomial infec-tions in four university hospitals in Switzerland. Infect Control Hosp Epidemiol 1999;20:37-42.
center, and to set further priorities in infection control at these institutions.
METHODS
Setting
The four participating hospitals are tertiary health-care centers with an average size of 1,100 beds.6 The study was conducted between May 20 and May 27,1996, in med-ical, surgmed-ical, and intensive-care units (ICUs). The sur-veyed wards, selected to provide a balance in case mix, included a total of 1,958 beds (average, 490 beds per hospi-tal; range, 462-510), representing 45% (1,958/4,386) of the total number of hospital beds. The bed occupancy rate in the surveyed wards at the time of study ranged from 60% to 81% in the different centers, with an average of 69% (1,349/1,958).
Definitions
Standard definitions by the Centers for Disease Control and Prevention were used, except that asympto-matic bacteriuria was not categorized as NI.7 NI was defined as occurrence of infection at least 48 hours after hospital admission without evidence that the infection was present or incubating at time of admission. All patients readmitted within 7 days after discharge who presented at time of study with a documented infection were evaluated for a possible NI. Surgical-site infections were document-ed as NI within 30 days after the operation, or 1 year in case of infection associated with insertion of a prosthetic device.
Quality Control Issues and Data Collection
Three prevalence studies performed either hospital-wide or only in some departments were conducted previ-ously at one of the centers (Geneva). Thus, the study pro-tocol, case report form (CRF), database for data collection, double data-entry process, and methods for data analysis had been pretested prior to this survey. Validation of the observers was performed before and during the preva-lence surveys at this center; both internal and external validity was excellent (kappa statistics >0.80).
The CRF was tested at each study center in 1995 and further tested in April 1996. During the study, CRFs were reviewed at each center by the center coordinator and com-pleted when necessary. Overall, 10% to 15% of all patients surveyed at the time of the study were evaluated by two separate independent observers who were members of either the infection control or the infectious diseases staff. Following the completion of the study, all CRFs were ren-dered anonymous, collected centrally, and rechecked (S.H.). The study investigators met several times during and after the study to ensure validity of the data collection at each center and to discuss problems. A study coordina-tor was designated for the whole study (D.P.).
Infected patients were identified by review of nursing and medical charts and by information provided by physi-cians and nurses in charge of the patients. All NIs required full written documentation, including microbiological data
whenever available. This included culture results under-taken during, or up to 1 week after, the study period.
A specially designed database developed at the University Hospitals of Geneva was used for data entry (using ACCESS, version 2.0; Microsoft Co, Ireland) and double data entry was performed.
Study Variables
A total of 63 study variables were recorded for both infected and noninfected patients. Primary diagnosis was determined and classified according to the International Classification of Diseases, 9th revision.8 The 20 groups of diagnoses corresponded to the respective ICD-9-CM clas-sification codes and were used as described elsewhere.9 Patients were classified into three categories depending on the severity of illness according to the classification pro-posed by McCabe and Jackson.10 Patients' comorbidities were recorded according to the score proposed by Charlson.11 Functional status was assessed by the Karnofsky index.12 Additional conditions associated with increased risk of NI were noted (HIV infection, neutrope-nia, chemotherapy, intravenous drug abuse, and organ transplantation).
External risk factors, such as indwelling devices, type and route of nutrition, tracheostomy, oral or nasal intu-bation, and medication, such as antimicrobial agents (for therapeutic or prophylactic purposes), use of steroids, or ulcer prophylaxis, were documented. Time of assessment of major variables for infected patients was 7 days before the time by which the patient met the criteria for NI and 7 days before the date of the study for noninfected patients.
Statistical Analysis
Two measures of the frequency of NIs were calculat-ed: the prevalence of infections, defined as the ratio of the number of clinically active infections to the total number of patients studied (expressed as a percentage), and the prevalence of infected patients, defined as the percentage of patients with active infection in relation to the total num-ber of patients studied.
The combined study of the possible risk factors for NI was conducted by means of logistic regression models. Only variables associated with Pvalues <.l in the univariate analysis were included in the models. Explanatory vari-ables for the outcome (NI) were: hospital ward, emergency admission, age, gender, length of stay at time of infection (infected patients) or at time of study (noninfected patients), Karnofsky index, McCabe classification, Charlson index, invasive procedures (central venous, arte-rial, or urinary catheterization; orotracheal intubation; drainage), surgery, treatment with steroids, and stress-ulcer prophylaxis. Colinearity between study variables included in the multiple logistic regression model was excluded by analysis of correlation (all correlation coeffi-cients <0.5). Statistical analysis was performed using SPSS software (SPSS Inc, Chicago, IL). All reported P values were two-sided, and values less than .05 were considered statistically significant.
Vol. 20 No. 1 NOSOCOMIAL INFECTIONS IN SWISS TEACHING HOSPITALS 39
RESULTS
General Demographics
A total of 1,349 CRFs (one per patient) suitable for analysis were available: 413 patients in center A, 325 in cen-ter B, 296 in cencen-ter C, and 315 in cencen-ter D. Of screened patients, 672 (50%) were in surgical wards, 585 (43%) in medical wards, and 92 (7%) in ICUs. A total of 518 patients (38%) had surgery prior to the study time point; 72% of those patients had undergone elective surgery, and 28% emergency surgery. A total of 662 patients (49%) were receiving antimicrobial agents at the time of the study.
Prevalence, Pathogens, and Sites of Infections
There were a total of 176 NIs in 156 patients. Thus, the overall prevalence of infections and infected patients was 13.0% and 11.6%, respectively. Among the 156 patients with NI, 123 (79%) had a single infection, 22 (14%) had two infections, and 11 (7%) had three or more. Rates of NI at the participating centers ranged from 9.8% to 13.5%.
A high prevalence of NI was observed in ICUs (23 infected patients [25%] of a total of 92 screened patients). Rates of infection averaged 9% (53 infected patients/total 585 screened patients; range, 6%-15% between the study centers) in the medical wards, and 12% (80/672; range, 10%-14%) in the surgical wards.
Among the 176 episodes of NI, 157 microorganisms were isolated in 117 (66%) of the cases. There were 84 infec-tions caused by a single microorganism; 33 NIs were polymicrobial. The proportional frequencies of leading pathogens isolated are summarized in Table 1.
Among the 176 detected NIs, the most frequent type was surgical-site infection (53; 30%), followed by urinary tract infection (39; 22%); lower respiratory tract infection (27; 15%); bloodstream infection (23; 13%); ear, nose, and throat infection (11; 6%); and skin infection (7; 4%). Sixteen other infections accounted for an additional 9%.
Intrinsic Risk Factors
The median age of the 1,349 studied patients was 62 (range, 16-100) years; 787 patients (58%) were men. Primary diagnoses associated with an increased preva-lence of NI and further information concerning comorbidi-ties (Charlson index) and functional capacity (Karnofsky scale) among infected and noninfected patients are shown in Table 2. Patients with rapidly fatal (OR, 2.46; CI95, 1.85-3.07) or ultimately fatal (OR, 1.96; CI95, 1.56-2.35) underly-ing illness, accordunderly-ing to the classification by McCabe and Jackson, were at higher risk for NI than those suffering from nonfatal conditions (Table 2).
Length of Stay and Exogenous Risk Factors
The average length of hospital stay from admission to study day was 12.6 days (median, 7; range, 0-234). Length of stay from admission to NI averaged 15.3 days
(median, 9; range, 0-215). For those patients who had not acquired NI, length of hospital stay averaged 10.2 days at time of study (median, 6; range, 0-196).
Table 3 summarizes the prevalence of exogenous
TABLE 1
NOSOCOMIAL INFECTIONS IN SWISS TEACHING HOSPITALS: LEADING PATHOGENS* Organisms Staphylococcus aureus* Escherichia coli Pseudomonas aeruginosa Candida species Other Enterobacteriaceae Coagulase-negative staphylococci Enterococcus species Enterobacter species No. 20 19 17 16 16 14 13 9 Prevalence (%) 13 12 11 10 10 9 9 6 * A total of 157 bacterial and fungal pathogens were isolated in 117 episodes of microbiological-ly documented infection.
t Two of 20 Staphylococcus aureus strains were methicillin-resistant.
risk factors for infection. By univariate analysis, surgical intervention; steroids; omeprazole and sucralfate; exposure to indwelling devices such as urinary, central venous, and arterial catheters; and orotracheal intubation increased the risk of infection (all P<.05).
Independent Factors for Nosocomial Infection
In the overall logistic regression model for NI, the following factors were independently associated with NI
(Table 4): central venous catheterization, severity of under-lying disease as measured by the McCabe classification, the degree of dependence as measured by the Karnofsky index (all F<.05), admission to the ICU, and emergency admission.
DISCUSSION
In a recently published point-prevalence study of NIs in ICUs in 14 European countries, Switzerland with its 49 participating ICUs had one of the lowest infection rates, with only 9.7% of the patients having an ICU-acquired infec-tion.3 In contrast to these somewhat controversial findings, our 7-day period-prevalence study found NIs in Swiss uni-versity hospitals to be no less frequent than in neighboring European countries (Table 5). Our observed prevalence of 11.6% is roughly comparable with that found in other point-prevalence studies in teaching hospitals or medical centers with more than 500 beds (4.4%-14.8%).4'51316The observed NI rate of 25% among ICU patients clearly is within the reported range of NI rates in ICUs and is consistent with data from other countries.317
Our study shows some additional interesting find-ings compared to previously published work. By excluding asymptomatic bacteriuria as a criterion for NI, as previ-ously proposed by the EPINE (Estudio de Prevalencia de las Infecciones Nosocomiales en Espaiia) study,4 the observed spectrum of NI shifted toward a higher propor-tion of surgical-site (30%) and respiratory tract (15%) infec-tions, and a lower proportion of urinary tract infections (22%) than reported in other studies.1416 Moreover, length of hospitalization was not an independent risk factor for NI
TABLE 2
PATIENT CHARACTERISTICS AND INTRINSIC RISK FACTORS FOR NOSOCOMIAL INFECTION: UNIVARIATE ANALYSIS Infected Patients Noninfocted
(n=156, %) Patients (n=1,193, %) OR CL Age,* years (mean±SD)
<45 45-59 60-69 70-79 >80 Gender Male Female Hospital location Medical ward Surgical ward Intensive care Center A B C D Admission condition' Emergency Elective Primary diagnosis' Cancer
Diseases of the circulatory system Diseases of the digestive system Trauma
Respiratory diseases and infections Others^ McCabe classification'! Nonfatal Ultimately fatal Rapidly fatal Charlson index 0-1 2-5 6-12 Karnofsky index11 8-10 5-7 1-4 60.0 31 41 34 32 18 89 67 52 81 23 49 36 40 31 98 51 27 40 22 21 21 25 90 43 15 77 60 19 64 62 22 ±17.0 (20%) (26%) (22%) (21%) (12%) (57%) (43%) (33%) (52%) (15%) (31%) (23%) (26%) (20%) (66%) (34%) (17%) (26%) (14%) (13%) (13%) (16%) (61%) (29%) (10%) (49%) (38%) (12%) (43%) (42%) (15%) 60.4 241 272 245 266 162 698 495 533 591 69 364 289 256 284 642 513 143 252 146 137 197 304 856 209 58 692 389 112 664 404 85 ±17.8 (20%) (23%) (21%) (22%) (14%) (59%) (41%) (45%) (49%) (6%) (31%) (24%) (21%) (24%) (56%) (44%) (12%) (21%) (12%) (12%) (17%) (26%) (76%) (19%) (5%) (58%) (33%) (9%) (58%) (35%) (7%) Ref 1.17 1.07 0.94 0.86 1.06 Ref 1.40 3.41 1.23 1.14 1.43 Ref 1.53 2.30 1.93 1.83 1.86 1.30 Ref Ref 1.96 2.46 Ref 1.39 1.52 Ref 1.59 2.69 — 0.67-1.67 0.56-1.60 0.41-1.46 0.25-1.48 0.76-1.49 — 1.03-1.77 2.86-3.97 0.76-1.71 0.63-1.65 0.93-1.93 — 1.07-2.20 1.72-2.88 1.40-2.46 1.23-2.44 1.25-2.48 0.69-1.90 — — 1.56-2.35 1.85-3.07 — 1.03-1.75 0.98-2.06 — 1.22-1.96 2.15-3.22
Abbreviations: Cl,]5, 95% confidence interval: OR, odds ratio; Ref, reference group; SD, standard deviation.
* Missing data in 7 patients. f Missing data in 45 patients. * Missing data in 14 patients.
§ "Others" refers to all primary diagnosis for admission not included in the categories listed. || Missing data in 78 patients,
•fl Missing data in 48 patients.
after adjustment for case mix, in contrast to other reports.4'16'18'19
The particular strength of this study is the in-depth analysis of possible intrinsic and extrinsic risk factors for NI. After adjustment for case mix and controlling for a large
number of potential confounding variables, we identified several extrinsic (use of CVC, admission to ICUs, emer-gency admission) and intrinsic (McCabe classification; Karnofsky index) factors to be associated independently with a significantly increased risk for NI. We believe that
Vol. 20 No. 1 NOSOCOMIAL INFECTIONS IN SWISS TEACHING HOSPITALS 41
TABLE 3
EXPOSURE TO EXOGENOUS RISK FACTORS FOR NOSOCOMIAL INFECTION IN THE TOTAL POPULATION OF 1,349 SURVEYED PATIENTS: UNIVARIATE ANALYSIS
Factor
Number (%) of Patients
Infected Nonlnfected OR CL
No. of patients Surgery prior to study Solid-organ transplant Chemotherapy Steroids
Stress ulcer prophylaxis Ranitidine
Omeprazole Sucralfate
Exposure to indwelling devices Urinary catheters
Intubation
Central venous catheter Arterial catheter Peripheral catheter Permanent catheter* Surgical drains Length of stay, days*
0-2 3-7 8-14 >14 1 91 2 13 14 19 87 18 64 19 74 16 85 6 30 28 39 32 51 56 (58) (1.3) (8.3) (9.0) (12) (56) (12) (41) (12) (47) (10) (55) (4) (19) (19) (26) (21) (34) 1,193 480 14 77 55 125 577 77 297 71 246 58 753 34 122 317 363 284 224 (40) (1.2) (6.5) (4.6) (10) (48) (6.5) (25) (6) (21) (5) (63) (3) (10) (27) (30) (24) (19) 2.08 1.09 1.32 2.04 1.18 1.47 1.89 2.10 2.17 3.47 2.23 0.70 1.36 2.09 Ref.' 1.22 1.28 2.58 1.48-2.91 0.25-4.86 0.71-2.43 1.10-3.76 0.71-1.99 1.04-2.10 1.10-3.26 1.48-2.96 1.27-3.71 2.46-4.90 1.25-3.99 0.50-0.98 0.56-3.29 1.34-3.24 0.71-1.73 0.80-1.75 2.09-3.07
Abbreviations: CI,^, 95% confidence interval; OR, odds ratio.
* Permanent catheter: Hickman lines and other permanently inserted catheters. t Missing data in 11 patients.
t Indicates reference group.
TABLE 4
INDEPENDENT RISK FACTORS FOR NOSOCOMIAL INFECTION: STEPWISE LOGISTIC REGRESSION M O D E L *
Variable OR CL Extrinsic factors CVC ICU stay Emergency admission Intrinsic factors Karnofsky index 5-7 1-4 McCabe classification Ultimately fatal Rapidly fatal 3.35 1.75 1.57 1.38 2.56 2.50 2.25 2.91-3.80 1.30-2.21 1.15-2.00 0.95-1.82 1.95-3.17 2.04-2.96 1.52-2.98 .0001 .015 .037 .14 .003 .0001 .029
Abbreviations: CL^, 95% confidence interval; CVC, central venous catheter; ICU, intensive-care unit; OR, odds ratio.
* Likelihood ratio, 700.66; goodness of fit, 1117.7. Variables included were hospital ward, emer-gency admission, age, gender, length of stay at time of infection (infected patients) or at time of study (noninfected patients), Karnofsky index, McCabe classification, Charlson index, invasive procedures (central venous, arterial, urinary catheterization, orotracheal intubation, or surgical drainage), surgery, treatment with steroids, and stress ulcer prophylaxis.
TABLE 5
PREVALENCE STUDIES OF NOSOCOMIAL INFECTION IN SEVERAL UNIVERSITY HOSPITALS AND TERTIARY-CARE CENTERS W I T H M O R E THAN 500 BEDS Country Belgium Australia Hong Kong Spain France Norway United Kingdom Lithuania Germany Switzerland Reference Unpublished data* 13 5 4 24 14 15 25 22 Present study Year of Study 1984 1984 1986 1990 1990 1991 1993 1994 1994 1996 Prevalence (%) 14.8 8.6 10.5 8.6 9.0 6.5 11.2 9.2 4.4 11.6
* O. Ronveaux, MD, Institute of Public Health-Louis Pasteur, Brussels, Belgium, oral commu-nication based on unpublished data from reference 16.
patient comorbidities must be taken into account to adjust for case mix in any study comparing interhospital or intra-hospital infection rates or developing predictive models for NIs. Studies such as ours, seeking to improve the quality of predictive models, contribute to this substantial task. Furthermore, our results confirm other reports3,20,21 con-cerning exposure to CVCs as one of the most important independent risk factors for infection (OR, 3.35; CI95, 2.91-3.80). Importantly, among 23 episodes of nosocomial blood-stream infection, we identified 8 cases (35%) associated with CVC infections. Thus, efforts to prevent device-associated infections would have a major impact on intra-hospital infection rates in the participating intra-hospitals.
Several limitations of this prevalence survey need to be considered. First, it was not performed hospitalwide but only in selected areas (surgical, medical, and critical-care wards) of four university hospitals in Switzerland. Certainly, the prevalence would have been lower if small-er nonteaching hospitals and more low-risk areas had been included, as demonstrated by the German NIDEP (Nosokomiale Infektionen in Deutschland Erfassung und Prevention) study.22 Second, results of prevalence studies are directly influenced by the duration of the condition under study. Thus, period-prevalence studies may tend to overestimate rates of NIs compared to point-prevalence surveys. However, we chose to conduct a period-prevalence study with a well-defined time window to identify NI bet-ter and to assess more accurately the exposure to risk fac-tors. Third, seasonal variations may have influenced the results of this survey, which was performed shortly before a long holiday weekend (Pentecost), explaining the relatively low occupancy rate and possibly resulting in an overestimation of the number of patients with NI. Finally, we did not examine the number of diagnostic tests performed in the different centers; thus, by decreasing or increasing the number of diagnostic tests, the different centers may have decreased or increased the number of observed NIs in different surveyed areas, as reported by Haley et al.23 A major detection bias is, however, unlikely, considering the absence of a significant variation in both infection rates and case mix across study centers.
In summary, our study gives important information on the prevalence of NIs in Swiss university hospitals and the impact of extrinsic and intrinsic risk factors on NIs in these institutions. Our results should be an incentive to scrutinize current methods and standards of comparing surveillance data from different hospitals without well-performed adjustment for case mix.
R E F E R E N C E S
1. Haley RW, Culver DH, White JW, Morgan WM, Emori TG, Munn VP, et al. The efficacy of infection surveillance and control programs in
pre-venting nosocomial infections in US hospitals. Am J Epidemiol 1985;121:182-205.
2. Haley RW. The scientific basis for using surveillance and risk factor data to reduce nosocomial infection rates. J Hosp Infect 1995;30(suppl):3-14. 3. Vincent JL, Bihari DJ, Suter PM, Bruining HA, White J, Nicolas-Chanoin MH, et al. The prevalence of nosocomial infection in intensive care units in Europe. Results of the European Prevalence of Infection in Intensive Care (EPIC) Study. JAMA 1995;274:639-644.
4. EPINE Working Group. Prevalence of hospital-acquired infections in Spain. J Hosp Infect 1992;20:1-13.
5. French GL, Cheng AF, Wong SL, Donnan S. Repeated prevalence sur-veys for monitoring effectiveness of hospital infection control. Lancet 1989;2:1021-1023.
6. Pittet D, Francioli P, von Overbeck J, Raeber PA, Ruef C, Widmer AF. Infection control in Switzerland. Infect Control Hosp Epidemiol 1995;16:49-56.
7. Garner JS, Jarvis WR, Emori TG, Horan TC, Hughes JM. CDC defini-tions for nosocomial infecdefini-tions. Am J Infect Control 1988;16:128-140. 8. International Classification of Diseases, 9th Revision, Clinical
Modification: ICD-9-CM. Publication PHS 89-1260. Washington, DC: US Public Health Service; 1989.
9. Pittet D, Davis CS, Li N, Wenzel RP. Identifying the hospitalized patient at risk for nosocomial bloodstream infection: a population-based study. Proceedings of the Association of American Physicians 1997;109:58-67. 10. McCabe WR, Jackson GG. Gram-negative bacteremia, I: etiology and
ecology. Arch Intern Med 1962;110:847-855.
11. Charlson ME, Pompei P, Ales KL, MacKenzie CR. A new method of clas-sifying prognostic comorbidity in longitudinal studies: development and vsMdaXion. Journal of Chronic Disease (England) 1987;40:373-383. 12. Karnofsky DA, Burchenal JH. The clinical evaluation of chemotherapeutic
agents in cancer. In: MacLeod CM, ed. Evaluation of Chemotherapeutic Agents. New York, NY: Columbia University Press; 1949:191-205. 13. McLaws ML, Gold J, King K, Irwig LM, Berry G. The prevalence of
nosocomial and community-acquired infections in Australian hospitals. MedJAust 1988;149:582-590.
14. Aavitsland P, Stormark M, Lystad A Hospital-acquired infections in Norway: a national prevalence survey in 1991. Scand J Infect Dis 1992;24:477-483.
15. Emmerson AM, Enstone JE, Griffin M, Kelsey MC, Smyth ET. The sec-ond national prevalence survey of infection in hospitals—overview of the results. J Hosp Infect 1996;32:175-190.
16. Mertens R, Kegels G, Stroobant A, Reybrouck G, Lamottet JM, Potvliege C, et al. The national prevalence survey of nosocomial infec-tions in Belgium, 1984. J Hosp Infect 1987;9:219-229.
17. Pittet D, Harbarth S. The intensive care unit. In: Bennett JV, Brachman PS, eds. Hospital Infections. Boston, MA Little, Brown and Co; 1998:381402. 18. Broderick A, Mori M, Nettleman MD, Streed SA, Wenzel RP.
Nosocomial infections: validation of surveillance and computer model-ing to identify patients at risk. Am J Epidemiol 1990;131:734-742. 19. Josephson A Karanfil L, Alonso H, Watson A Blight J: Risk-specific
nosocomial infection rates. Am J Med 1991;91:131S-137S.
20. Widmer AF. IV-related infections. In: Wenzel RP, ed. Prevention and Control of Nosocomial Infections. Baltimore, MD: Williams & Wilkins; 1997:771-805.
21. Valles J, Leon C, Alvarez-Lerma F. Nosocomial bacteremia in critically ill patients: a multicenter study evaluating epidemiology and prognosis. Spanish collaborative group for infections in intensive care units. Clin Infect Dis 1997;24:387-395.
22. Riiden H, Gastmeier P, Daschner F, Schumacher M. Nosocomial infec-tions in Germany. Their epidemiology in old and new Federal Lander. Dtsch Med Wochenschr 1996;121:1281-1287.
23. Haley RW, Culver DH, Morgan WM, White JW, Emori TG, Hooton TM. Increased recognition of infectious diseases in US hospitals through increased use of diagnostic tests, 1970-1976. Am J Epidemiol 1985;121:168-181.
24. Quenon JL and the Comite Technique national des Infections Nosocomiales. Ministere du travail et des affaires sociales, Paris, France. Projet "Hopital propre": Premiere enquete nationale de preva-lence des infections nosocomiales. 1992;28-47.
25. Valinteliene R, Jurkuvenas V, Jepsen OB. Prevalence of hospital-acquired infection in a Lithuanian hospital. J Hosp Infect 1996;34:321-329.