doi:10.1017/sjp.2015.47
Anxiety disorders are a set of heterogeneous diagnos-tic categories that encompass social phobia, agora-phobia, panic attacks, generalized anxiety disorders, post-traumatic stress disorder and obsessive compul-sive disorder (American Psychiatric Association, 2000). Anxiety symptoms such as nervousness, worry, fear, and/or rumination can occur at subclinical level, with-out meeting the criteria required for the diagnosis of a clinical disorder (Ozen, Ercan, Irgil, & Sigirli, 2010). Anxiety is considered a mental disorder that includes a variety of conditions that share a common feature, a psychopathological extreme worry. This feature appears itself in multiple dysfunctions and dysregu-lations to cognitive, behavioral and psychophysio-logical level (Stanley & Beck, 2000).
These clinical disorders are prevalent in general population (Copeland, Shanahan, Costello, & Angold, 2009; Costello, Copeland, & Angold, 2011; Costello, Egger, & Angold, 2005; Kessler, Berglund, Demler, Jin, & Walters, 2005), and they could become one of the leading causes of disability in 21st century in European countries (Alonso et al., 2004). For instance, Alonso et al. (2004), found that vital prevalence for any anxiety disorder was 13.6% in a representative sample of 21,425 adults belonging to six European countries. In the replication of the National Comorbidity Survey
conducted in the United States (Kessler, Chiu, Demler, & Walters, 2005), anxiety disorders were the most preva-lent type of disorders (18.1%), followed by mood disor-ders (9.5%), impulse control disordisor-ders (8.9%) and substance use disorders (3.8%). Moreover, the review of Somers, Goldner, Waraich and Hsu (2006), proposed year-prevalence rates and life-prevalence rates of anx-iety disorders between 10.6% and 16.6%. Similarly, according to Bloom (2002), 16% of the population reported anxiety problems. These epidemiological results are even more relevant to the extent that anxiety disor-ders are risk factors for the onset of the first major depressive disorder (Bittner et al., 2004). In this sense, Gorwood (2004) found that up to 80% of people with generalized anxiety disorders also have a comorbid mood disorder during lifetime. In Spain, the ESEMeD study which evaluated the epidemiology of mental disorders in a sample of Spanish general adult popula-tion, found year-prevalence rates for anxiety disor-ders of 6.2%, higher than depressive disordisor-ders (4.3%). Indeed, anxiety disorders with depressive disorders are more prevalent in the Spanish population and are very common in Primary Care consultations, hovering around 18.5% (Cano-Vindel, 2003).
Among the different perspectives that address the study of anxiety, a recent transdiagnostic approach (Hagenaars, van Minnen, Hoogduin, & Verbraak, 2009) maintains that there is a common neurological pathology in all anxiety disorders, as stipulated in a specific factor of physiological hyperarousal and a general factor of negative affectivity. Negative affectivity in particular
Anxiety Assessment: Psychometric Properties of the
Spanish Version of the Burns Anxiety Inventory
Javier Ortuño-Sierra1, Lorena Rodríguez1, Martin Debbané2 and Eduardo Fonseca-Pedrero1
1 Universidad de La Rioja (Spain) 2 University of Geneva (Switzerland)
Abstract. The main purpose of this study was to analyze the psychometric properties of the Spanish version of the Burns Anxiety Inventory (Burns-A: Burns, 1993). The sample consisted of 417 participants, 387 (29.71% male) healthy participants (control group: M = 35.5 years; SD = 8.40) and 30 (36.66% female) patients (clinical group: M = 35.8 years;
SD = 12.94). The internal consistency evaluated through Cronbach’ Alpha was 0.95 for the Total Score in both subsam-ples. The test-retest reliability (two weeks) for Total Score was 0.86 (F = 13.2, p ≤ .001) for the non-clinical subsample, and 0.95 (F = 36.5, p ≤ .001) for the clinical subsample. Confirmatory factor analyses supported the initial three-factor model. However, modifications to the initial three-factor model improved the goodness-of-fit indices. Results showed statistically significant differences in the mean scores of the Burns-A between the clinical and control groups. This study supports the Spanish version of the Burns-A as a brief and useful tool for the screening of anxiety symptoms in adult populations. Future studies should investigate measurement invariance across cultures.
Received 26 May 2014; Revised 2 October 2014; Accepted 26 November 2014
Keywords: anxiety, burns-a, validation, psychometric properties, self-report.
Correspondence concerning this article should be addressed to Javier Ortuño-Sierra. Department of Educational Sciences. Universidad de La Rioja. C/ Luis de Ulloa, s/n. Edificio VIVES. 26002. Logroño, La Rioja (Spain). Phone: +34–941299309. Fax: +34–941299333.
would be a tendency to experience a range of feelings or negative emotions such as worry, anxiety, fear, alter-ation, anger, sadness and guilt (Somers et al., 2006). Among the different tools designed to measure any of the many facets that encompassed anxiety disorders stand out among others the Depression Anxiety Stress Scales (DASS: Lovibond & Lovibond, 1995), the State-Trait Anxiety Inventory (STAI: Spielberger, Gorsuch, & Lushene, 2008), and the Burns Anxiety Inventory (Burns-A: Burns, 1993).
Specifically, the Burns-A, is a self-report instrument developed with the aim to evaluate anxiety symptoms. The Burns-A has 33 items that focus on three anxiety dimensions: 1) Anxious Feelings, 2) Anxious Thoughts, and 3) Physical Symptoms. In addition, there is a total general anxiety score ranging from 0 to 99 with the sum of the items (Sekirnjak & Beal, 1999). The Burns-A, firstly developed in English, has been translated to different languages including the Spanish form. Different studies have analysed the psychometric properties of the Burns-A scores, confirming an internal consistency of 0.95 and a high correlation with the anxiety subscale of the Symptom Checklist-90-Revised (SCL-90: Derogatis, 1975). In addition, discriminant validity is comparable to other self-reported anxiety scales frequently used (Burns & Eidelson, 1998). Likewise, in the study on the convergent validity, the Burns-A (Burns, 1993) was found to correlate significantly with the Beck Anxiety Inventory (Beck & Steer, 1990) and the Zung Self-Assessment Scale of Anxiety (Zung, 1971). These results provide evidence for concurrent validity of Burns-A. Moreover, Grossman, Cohen, Goldner, and Jadonath (1994) reported that the Burns-A was sensitive in detecting anxiety that occurs with cardiac disease and concluded that the scale is useful in medical and psychiatric settings.
Nevertheless, despite the psychometric properties of the Burns-A have been studied in the English version, we have not found any evidence of the psychometric properties of this measuring instrument in its Spanish version. Hence, the main goal of this study is to exam-ine the psychometric properties of the Burns Anxiety Inventory (Burns-A: Burns, 1993) in adult Spanish population. We therefore study: 1) the internal consis-tency and the test-retest of the Burns-A scores; 2) the internal structure of the Burns-A scores; 3) the relation-ship between the Burns-A and the STAI (Spielberger et al., 2008); and 4) the discriminant validity between a clinical and a non-clinical sample.
Method
Participants
The final sample comprised a total of 417 non-clinical and clinical adults. Participants volunteered to take
part in the study (convenient samples). Non-clinical sample was composed of 387 adults, 115 were male (29.72%). Participants’ ages ranged from 18 to 72 years (M = 35.47 years; SD = 8.40). Participants belonged to all the Spanish communities, with more participation from La Rioja (30.23%), followed by Catalonia (28.42%), and Madrid (13.96). With regards to the educational level, a 77.26% had university studies, a 16.02% had professional studies, and 4.6% had secondary level. At the moment of the study, 30 participants of the non-clinical sample (7.75%) were taking some type of med-ication for anxiety. Clinical subsample was composed by 30 participants with a diagnosis of some type of anx-iety disorders from the Psychology Centre of Barcelona (BCN), 11 were male (36.7%). The ages of the partic-ipant ranged from 21 to 61 years (M = 35.8 years; SD = 12.94). All participants were living in Catalonia. Concerning the educational level in the patient group, 70% reached the university level, 23.33% had profes-sional studies, and 6.6% had secondary level. At the time of research participation, 14 participants of the clinical sample (46.66%) were taking some type of medication for anxiety.
Instruments
Burns Anxiety Inventory (Burns-A: Burns, 1993)
The Burns-A is a measuring instrument composed by 33 items that refer to anxiety symptoms. The Burns-A consists of three subscales: Anxious Feelings (six items), Anxious Thoughts (11 items), and Physical Symptoms (16 items). Anxious Feelings are defined like “anxiety, nervousness, fear or worry”, Anxious Thoughts include “difficulties to focus or fear to be alone, isolated from others or to be abandoned”, and Physical Symptoms including “pain, oppression or thoracic constriction” among others. Participants have to respond about how they have experimented or have been worried each symptom in the last days, in a Likert-type respond for-mat with four options (0 = not at all to 3 = a lot). The sum of all items forms the Total Anxiety Score. A score from 0 to 4 show minimum anxiety whereas a score from 55 to 99 indicates extreme anxiety.
State-Trait Anxiety Inventory (STAI) (Spielberger et al., 2008)
The STAI Spanish version is a self-reported question-naire composed by 40 items developed with the aim of evaluating two different types of anxiety: state anxiety (emotional condition transitory), whose reference frame is the “now, at this moment” (20 items), and the anxiety trait (anxiety tendency relatively stable), whose refer-ence frame is “in general, most of the time” (20 items). The STAI has a Likert-type response format with four
options (State: “not at all”, “somewhat”, “moderately so”, and “very much so”; Trait: “almost never”, “some-times”, “often”, and “almost always”). Score in each subscale ranges from 0 to 60. The STAI is widely used for the screening of state anxiety and trait anxiety in non-clinical and clinical populations, being one of the most used among clinical psychologist (Muñiz & Fernández-Hermida, 2010). The STAI has been reported to have adequate psychometric properties in its Spanish version with a Cronbach’s Alpha of 0.93 for the Total Score (Fonseca-Pedrero, Paino-Piñeiro, Sierra-Baigrie, Lemos-Giráldez, & Muñiz-Fernández, 2012). In addition, evidence for its internal structure has been reported for a three and a four-dimensional structure (Fonseca-Pedrero et al., 2012; Guillén-Riquelme & Buela-Casal, 2011).
Procedure
Sampling method varied according to each of the sub-samples. The non-clinical subsample was obtained through the use of new information and communica-tion technologies. Through different media (social net-works, chats and e-mail), collaboration in the study was requested. Socio-demographic data and written consent was collected from every participant and, in addition, all of them were given a code. The clinical sample was composed for 30 participants that at the moment of the study were diagnosed with some anxiety disorder according to the DSM-IV Manual (American Psychiatric Association, 2000). The researcher adminis-tered the Burns-A and the STAI to the participants of this subsample in the Psychological Centre of Barcelona. Socio-demographic data and written consent was col-lected as well in this subsample and every participant was given a code for identification. Participants of the total sample were asked to complete the Burns-A again, 15 days after being administered the questionnaire. In the non-clinical sample, 186 participants completed the retest form, while all participants of the clinical sample completed for the second time the Burns-A. As inclusion criteria for the total sample, participants had to be Spanish and over 18 years. As regards to the non-clinical sample, participants had not to have been diag-nosed of any anxiety disorder, whereas for the clinical sample, participant had to have a diagnosis of an anx-iety disorder in the Psychology Centre (BCN). This centre is a clinical centre with focus on evaluation, diagnosis and treatment of children, adolescents, and adult population.
Data analysis
First, we calculated descriptive statistics for the subscales and Total Score of the Burns-A. In addition Cronbach’s alpha coefficient was calculated as a measured of the
internal consistency of the scores in both subsamples. Also, test-retest reliability was analyzed the in both subsamples.
Second, with the aim of studying the internal structure of the Burns-A, several confirmatory facto-rial analyses (CFAs) were conducted at the item level. Due to the categorical nature of the data, we used the robust Mean-adjusted Weighted Least Square method (WLSMV) for the estimation of parameters (Muthen & Muthen, 1998-2007). The following goodness-of-fit indices were used: Chi-square (χ2), Comparative Fit Index (CFI), Tucker-Lewis Index (TLI), Root Mean Square Error of Approximation (RMSEA) and Weighted Root Mean Square Residual (WRMR). To achieve a good fit of the data to the model, the values of CFI and TLI should be over 0.95 and the RMSEA and WRMR values should be under 0.08 for a reasonable fit and under 0.05 for a good fit (Brown, 2006; Hu & Bentler, 1999). With the aim to determine wether the compared measurement models are equivalent or not, we selected the ∆CFI criterion proposed by Cheung and Reswold (2002) and validated by Chen (2007). Hence, when the change in CFI is less than 0.01, it is considered that models are equivalent, whereas a change greater than 0.01 in the CFI indicates the probability of differences between models and changes greater than 0.02 indicates definitely the existence of significant differences.
Third, we studied the sources of validity evidence with other external variables. We analysed the Pearson’s correlation between the Burns-A and the STAI scores. Also, in order to gather new sources of validity evi-dence, we carried out a MANOVA between the non-clinical and non-clinical subsamples, taking in consideration the Total Score of the Burns-A and the different sub-scales. Taking into account the heterogeneity of the subsamples, we randomly selected participants (n = 45) from the non-clinical subsample. The statistical analyses were carried out using the program SPSS 15.0 (Statistical Package for the Social Sciences, 2006) and Mplus 5.2 (Muthen & Muthen, 1998-2007).
Results
Descriptive statistics and reliability
Descriptive statistics of the subscales and the Total Score of the Burns-A in the non-clinical and the clinical subsamples were calculated (see Table 1). In the non-clinical subsample, internal consistency for the Total Score was 0.95 and for the subscales were 0.80 (Anxious Feelings), 0.86 (Anxious Thoughts), and 0.92 (Physical Symptoms). In addition, Cronbach’s alpha was calcu-lated for the clinical subsample: 0.95 for Total Score and 0.79, 0.90, and 0.93 respectively in each of the sub-scales. Results for the test-retest reliability displayed a
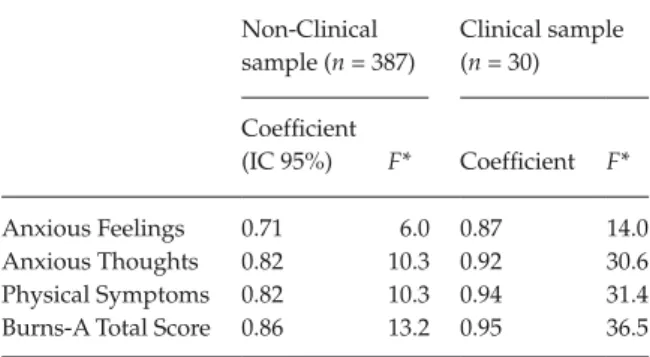
significant relation between the means of the Total Scores in the non-clinical subsample with a coefficient of 0.86 (F = 13, 2, p ≤ .001) and in the clinical subsample with a coefficient of 0.95 (F = 36, 5, p ≤ .001). Test-retest correlations for the other subscales can be seen in Table 2. Confirmatory Factor Analyses
Several confirmatory factor analyses were conducted in order to test the three-dimensional model pro-posed by Burns (1993) (see Figure 1). For the one dimensional model, the results showed inadequate indexes: χ2 = 487.63; df =104; CFI = 0.87; TLI = 0.96; RMSEA = 0.09; and WRMR = 1.47. For the three dimen-sional model the results displayed a modest adjust of the model to data, with χ2 = 414.83; df = 104; CFI = 0.89; TLI = 0.96; RMSEA = 0.09; and WRMR = 1.35. Substantial modifications indices (IMs) were found, suggesting the possibility of correlation between items 16 (Fears of criticism or disapproval) and 14 (Fears of looking foolish in front of others); items 17 (Fears that something terrible will happen) and 13 (Fears of illnesses, heart attacks or dying); and items 29 (Feeling dizzy, lightheaded or off balance) and 12 (Fears of fainting or passing out). Correlations between error terms were performed on those items with similar content meaning. Goodness-of-fit indices for the new mea-surement model were appropriate with χ2 = 326.56; df = 104; CFI = 0.92; TLI = 0.97; RMSEA = 0.07; and WRMR = 1.19. The inclusion of the error terms
displayed a change of 0.03 in CFI, indicating the improvement of the model with the inclusion of the error terms. Standardized factor loadings for the three factor model ranged between 0.32 of item 14 (Fears of looking foolish in front of others) belonging to the Anxious Thoughts subscale and 0.77 of item 27 (Trembling or shaking) of the Physical Symptoms sub-scale (see Table 3). All standardized loadings were statistically significant (p < .01). Correlation between the latent dimensions of the hypothetical three-dimensional model ranged between 0.40 (Anxious Thoughts and Anxious Feelings) (p < .01) and 0.50 (Anxious Feelings and Physical Symptoms) (p < .01).
Sources of validity evidence
Table 4 shows the Pearson’s correlation between Burns-A subscales and Total Score and the Anxiety-Trait and Anxiety-State subscales from the STAI. As it is shown in Table 4, all of the associations between scores were statistically significant. In order to gather evidence of discriminant validity, we compared clinical and non-clinical subsamples through analysis of the variance. Results showed statistically significant differences in the means scores between the subsamples in the subscales Anxious Feelings (F = 44, 9; df = 74; p ≤ .001; partial η² = 0.38), Anxious Thoughts (F = 24, 5; df = 74; p ≤ .001; partial η² = 0.25), Physical Symptoms (F = 28, 2; df = 74; p ≤ .001; partial η² = 0.28) and in the Total Score (F = 35, 2; df = 74; p ≤ .001; partial η² = 0.33) (see Table 5).
Discussion and conclusions
The main purpose of the study was to analyze the psy-chometric quality of the Spanish version of the Burns Anxiety Inventory (Burns-A: Burns, 1993). We thus examined the internal structure of Burns-A, estimated the reliability of the scores and obtained different sources of validity evidence. This objective provided informa-tion on the psychometric properties of the Burns-A (Spanish version) in order to use it as a screening instrument in Spanish-speaking adult populations. Results found in the study indicate that the Burns-A has adequate psychometric properties and, therefore
Table 2. Test-retest reliability of the Burns-A scores Non-Clinical sample (n = 387) Clinical sample (n = 30) Coefficient (IC 95%) F* Coefficient F* Anxious Feelings 0.71 6.0 0.87 14.0 Anxious Thoughts 0.82 10.3 0.92 30.6 Physical Symptoms 0.82 10.3 0.94 31.4 Burns-A Total Score 0.86 13.2 0.95 36.5
*All coefficients were statistically significant p ≤ .01.
Table 1. Descriptive statistics of the Burns-A for the non-clinical and the clinical subsamples
Non-Clinical sample (n = 387) Clinical Sample (n = 30)
Mean SD Skewness Kurtosis Cronbach’s alpha Mean SD Skewness Kurtosis Cronbach’s alpha Anxious Feelings 3.04 2.59 1.61 3.83 0.80 7.43 3.96 0.49 –0.01 0.79
Anxious Thoughts 4.42 4.20 1.15 2.23 0.83 10.04 7.03 0.64 –0.55 0.90 Physical Symptoms 7.90 7.86 1.80 3.23 0.92 20.53 12.91 0.47 –0.87 0.93 Burns-A Total score 15.16 13.32 1.66 2.80 0.95 38.01 21.64 0.44 –0.70 0.95
that it is a useful instrument that could be used to eval-uate anxiety symptoms.
Internal consistency for the subscales and for the total score were all over 0.79. These results are sim-ilar to those found in previous studies (Sekirnjak, 1998). Regarding the test-retest reliability analysis, ICC were adequate, indicating a good stability of the instrument, both in the non-clinical and the clinical subsamples.
Analysis of the internal structure underlying the items allowed to support the initial three-dimensional model. Nevertheless, goodness-of-fit indices were modest and revealed the presence of different modifi-cation indices. In order to determine wether the com-pared models are equivalent or not, we selected the
∆CFI criterion proposed by Cheung and Reswold (2002) and validated by Chen (2007). In the analysis, the inclusion of the error terms revealed a change of 0.03, indicating the improvement of the measurement model with the inclusion of the error terms and the neces-sity to control the existence of items with similar content that could affect to the factorial structure of the measuring instrument.
Results from the analysis of the sources of validity evidence with other variables yielded a significant association between Burns-A scores and the scores of the State-Trait Anxiety Inventory (STAI: Spielberger et al., 2008) in all the subscales and in the Total Score. These results support the validity of the Burns-A (Spanish version) with other external variables and
are consistent with previous studies (Rabenhorst, 2000; Sekirnjak, 1998; Sekirnjak & Beal, 1999) that showed evidence for the validity of the Burns-A with other external sources such as the Burns Depression Checklist, the Symptom Checklist (anxiety subscale), the Self-Rating Anxiety Scale (Zung, 1971), the Beck Anxiety
Inventory (Beck & Steer, 1990), and the Profile of Mood States tension/anxiety scale (McNair, Lorr, & Droppleman, 1971-1981). It should be mentioned that even though the Burns-A is supposed to measure state anxiety, a higher correlation has been found, in the pre-sent study, between the STAI-Trait and the Burns-A rather than between the STAI-State and the Burns-A. That could mean that the Burns-A may be an instru-ment that allows to measure anxiety traits as well as anxiety states. Anxiety traits and states have been related, in different studies with psychological prob-lems such as depression (López-Ibor, 2007). In this sense, screening of anxiety traits in each of the dimen-sions of the Burns-A could be relevant for the early detection in order to avoid psychological disorders that become permanent. In addition, results of the pre-sent study related to the sources of discriminant valid-ity, permit to assure, according to previous studies (Sekirnjak & Beal, 1999), the goodness of the Burn-A to distinguish between clinical and non-clinical samples.
The results of the present study should be inter-preted in the light of the following limitations. First of all, there is an inherent issue in the administration of every type of self-reported instrument, with the very well-known effect of stigmatization, the possibility of misunderstanding of some items or the lack of intro-spection of some participants, and the social desir-ability. For these reasons, it would have been relevant to use external sources of information via hetero-informs or structured interviews. Second, we did not use a scale in order to assure the infrequency in the response, what would have allowed eliminating those participants that displayed random answers. Third, in order to study the sources of convergent validity we only used the STAI that in fact evaluates the same anxiety problematic. Regarding this, the use of other instruments that measure other types of psycholog-ical problems like, for instance, depression would have been worthy. Fourth, we have studied adult popula-tions across the country with only specification for people over 18 years of age. As a result, the age range was large and the results cannot be extrapolated to a specific age group. Finally, we did not make any sta-tistical analysis to study the response distribution of the items attending different relevant variables like gender or age. The inclusion of Differential Item Functioning and the Measurement Invariance analysis are advised with the aim to compare scores in dif-ferent groups.
In conclusion, data obtained in the present study presented evidence supporting the psychometric properties of the Burns-A scores (Spanish version). Measurement instruments that allow evaluating psy-chological signs and symptoms such as anxiety are useful for detection of individuals at risk to transit to
Table 3. Standardized factor loadings for the final three factor
model
Items and Dimensions of Burns-A Loadings R2
Anxious Feelings
1. Anxiety, Nervousness, Worry, and Fear 0.65 0.35 2. Feeling that things around you are
strange, unreal or foggy
0.44 0.56 3. Feeling detached from all or part of your
body
0.52 0.48 4. Sudden, unexpected panic spells 0.69 0.31 5. Apprehension or a sense of impending
doom
0.65 0.35 6. Feeling tense, stressed, “uptight”, or on
edge
0.69 0.31 Anxious Thoughts
7. Difficulty concentrating 0.41 0.59 8. Racing thoughts or your mind jumps
one thing to the next
0.57 0.44 9. Frightening fantasies or day dreams 0.54 0.47 10. Feeling that you’re on the verge of
losing control
0.68 0.32 11. Fears of cracking up or going crazy 0.70 0.30 12. Fears of fainting or passing out 0.52 0.48 13. Fears of illnesses, heart attacks or dying 0.48 0.52 14. Fears of looking foolish in front of others 0.32 0.68 15. Fears of being alone, isolated or
abandoned
0.46 0.54 16. Fears of criticism or disapproval 0.38 0.62 17. Fears that something terrible will happen 0.54 0.46 Physical Symptoms
18. Skipping, racing or pounding of the heart
0.54 0.46 19. Pain, pressure or tightness in the chest 0.58 0.43 20. Tingling or numbness in the toes
or fingers
0.56 0.44 21. Butterflies or discomfort in the stomach 0,51 0.49 22. Constipation or diarrhea 0.34 0.67 23. Restlessness or jumpiness 0.62 0.39 24. Tight, tense muscles 0.50 0.50 25. Sweating not brought on by heat 0.53 0.47 26. A lump in the throat 0.59 0.41 27. Trembling or shaking 0.77 0.23 28. Rubbery or “jelly” legs 0.66 0.34 29. Feeling dizzy, lightheaded or off balance 0.62 0.38 30. Choking or smothering sensations 0.51 0.49 31. Headaches or pains in the neck or back 0.59 0.41 32. Hot flashes or cold chills 0.71 0.29 33. Feeling tired, weak or easily exhausted 0.52 0.48
more severe and permanent problems. The Burns-A is an inventory designed to measure anxiety; how-ever, it may be relevant for future studies to deter-mine whether a shorter form of the questionnaire could be derived. That would be an added value in com-parison with other anxiety instruments such as the STAI. The use of short instruments increases partici-pants’ satisfaction and at the same time saves time for the researchers. Future studies should try to establish specific cut-points, and may try to follow up those indi-viduals with high scores in this type of self-reported instruments in order to establish the sensitivity and specifity. In addition, future studies should investigate the measurement invariance attending to relevant variables like gender, culture or age.
References
Alonso J., Angermeyer M. C., Bernert S., Bruffaerts R., Brugha T. S., Bryson H., ... Vollebergh W. A. (2004). Prevalence of mental disorders in Europe: Results from the European Study of the Epidemiology of Mental Disorders (ESEMeD) project. Acta Psychiatrica Scandinavica,
420, 21–27.
American Psychiatric Association. (2000). Diagnostic and
statistical manual of mental disorders (4th Ed. Rev. Ed.).
Washington, DC: Author.
Beck A. T., & Steer R. A. (1990). Manual for the Beck Anxiety
Inventory. San Antonio, TX: Psychological Corporation. Bittner A., Goodwin R. D., Wittchen H. U., Beesdo K.,
Höfle M., & Lieb R. (2004). What characteristics of primary anxiety disorders predict subsequent major depressive disorder? Journal of Clinical Psychiatry, 65, 618–626. http://dx.doi.org/10.4088/JCP.v65n0505
Bloom B. L. (2002). Brief interventions for anxiety disorders: Clinical outcome studies. Brief Treatment and Crisis
Intervention, 2, 325–339. http://dx.doi.org/10.1093/ brief-treatment/2.4.325
Brown T. A. (2006). Confirmatory factor analysis for applied
research. New York, NY: Guilford Press.
Burns D. D. (1993). Ten days to self-esteem. New York, NY: Quill.
Burns D. D., & Eidelson R. (1998). Why are measures of depression and anxiety correlated? A test of the tripartite theory. Journal of Consulting and Clinical Psychology, 66, 461–473.
Cano-Vindel A. (2003). El impacto de la ansiedad [Anxiety impact]. Revista Española de Economía de la Salud, 2, 70–71. Chen F. F. (2007). Sensitivity of goodness of fit indexes to
lack of measurement invariance. Structural Equation
Modeling, 14, 464–504. http://dx.doi.org/10.1080/ 10705510701301834
Cheung G. W., & Rensvold R. B. (2002). Evaluating goodness-of-fit indexes for testing measurement invariance. Structural Equation Modeling, 9, 233–255. http://dx.doi.org/10.1207/S15328007SEM0902_5 Copeland W. E., Shanahan L., Costello E. J., & Angold A.
(2009). Childhood and adolescent psychiatric disorders as predictors of young adult disorders. Archives of General
Psychiatry, 66, 764–772. http://dx.doi.org/10.1001/ archgenpsychiatry.2009.85
Costello E. J., Copeland W., & Angold A. (2011). Trends in psychopathology across the adolescent years: What changes when children become adolescents, and when adolescents become adults? Journal of Child Psychology &
Psychiatry, 52, 1015–1025. http://dx.doi.org/10.1111/ j.1469-7610.2011.02446.x
Costello E. J., Egger H., & Angold A. (2005). 10-year research update review: The epidemiology of child and Table 4. Pearson’s correlations between Burns-A and STAI
STAI-State STAI-Trait Anxious Feelings Anxious Thoughts Physical Symptoms Anxious Feelings 0.63* 0.71*
Anxious Thoughts 0.67* 0.74* 0.78*
Physical Symptoms 0.65* 0.69* 0.74* 0.77*
Burns-A Total Score 0.71* 0.76* 0.86* 0.92* 0.95*
*All the correlations were statistically significant p ≤ .01.
Table 5. Mean scores comparisons between non-clinical and clinical subsamples
Non-Clinical Clinical
M (SD) M (SD) F p Partial η²
Anxious Feelings 3.03 (2.61) 7.43 (3.96) 44.9 .001 0.38
Anxious Thoughts 4.18 (3.89) 10.04 (7.03) 24.5 .001 0.25
Physical Symptoms 7.85 (7.83) 20.53 (12.91) 28.2 .001 0.28
Burns-A Total Score 15.06 (13.29) 38 (21.64) 35.2 .001 0.33
adolescent psychiatric disorders: I. Methods and Public Health Burden. Journal of the American Academy of Child and
Adolescent Psychiatry, 44, 972–986. http://dx.doi.org/ 10.1097/01.chi.0000172552.41596.6f
Derogatis L. R. (1975). The SCL-90-R. Baltimore, MD: Clinical Psychometric Research.
Fonseca-Pedrero E., Paino Piñeiro M., Sierra Baigrie S., Lemos Giráldez S., & Muñiz Fernández J. (2012). Propiedades psicométricas “Cuestionario de Ansiedad Estado/Rasgo” (STAI) en universitarios [Psychometric properties “State-Trait Anxiety Inventory” in university students]. Revista Internacional de Psicología Clínica y de la
Salud, 20, 547–562.
Gorwood P. (2004). Comorbilidad del trastorno de ansiedad generalizada y el trastorno depresivo mayor: ¿Un ejemplo de peliotropía genética? [Generalized anxiety disorder and major depressive disorder comorbidity: An example of genetic pleiotropy?]. European Psychiatry, 19, 27–33. Grossman D. S., Cohen T. J., Goldner B., & Jadonath R.
(1994). Pseudorecurrence of paroxysmal supraventricular tachicardia after radiofrecuency catheter ablation. The
American Heart Journal, 128, 516–519. http://dx.doi. org/10.1016/0002-8703(94)90625-4
Guillén-Riquelme A., & Buela-Casal G. (2011).
Actualización psicométrica y funcionamiento diferencial del ítem en el State Trait Anxiety Inventory (STAI) [Psychometric actualization and differential item functioning in the State Trait Anxiety Inventory (STAI)].
Psicothema, 23, 510–515.
Hagenaars M. A., van Minnen A., Hoogduin C. A. L., & Verbraak M. (2009). A transdiagnostic comparison of trauma and panic memories in PTSD, panic disorder, and healthy controls. Journal of Behavior Therapy and
Experimental Psychiatry, 40, 412–422. http://dx.doi. org/10.1016/j.jbtep.2009.04.001
Hu L. T., & Bentler P. M. (1999). Cutoff criteria for fit indexes in covariance structure analysis: Conventional Criteria versus new alternatives. Structural Equation Modeling, 6, 1–55. http://dx.doi.org/10.1080/10705519909540118 Kessler R. C., Berglund P., Demler O., Jin R., Mericangas
K. R., & Walters E. E. (2005). Lifetime prevalence and age-of-onset distributions of DSM-IV disorders in the National Comorbidity Survey Replication. Archives of
General Psychiatry, 62, 593–602. http://dx.doi.org/ 10.1001/archpsyc.62.6.593
Kessler R. C., Chiu W. T., Demler O., & Walters E. E. (2005). Prevalence, severity and comorbidity of 12-month DSM-IV
in the national comorbidity survey replication. Archives of
General Psychiatry, 62, 617–627.
López-Ibor J. J. (2007). Ansiedad y depresión, reacciones emocionales frente a la enfermedad [Evolution of anxiety and depression detected during hospitalization in an Internal Medicine service]. Anales de Medicina Interna, 24, 209–211. Lovibond S. H., & Lovibond P. F. (1995). Manual for the
Depression Anxiety Stress Scales (2nd Ed.). Sydney, Australia:
Psychology Foundation.
McNair D. M., Lorr M., & Droppleman L. F. (1971–1981).
Profile of Mood States Manual. San Diego, CA: Educational & Industrial Testing Services.
Muñiz J., & Fernández-Hermida J. R. (2010). La opinión de los psicólogos españoles sobre el uso de los tests [Spanish psychologists’ opinion about the use of tests]. Papeles del
Psicólogo, 31, 108–121.
Muthen L. K., & Muthen B. O. (1998-2007). Mplus User’s
Guide (5ª Ed.). Los Angeles, CA: Muthen & Muthen. Ozen N. S., Ercan I., Irgil E., & Sigirli D. (2010). Anxiety
prevalence and affecting factors among university students. Asia-Pacific Journal of Public Health, 22, 127–133. Rabenhorst M. M. (2000). The Burns Anxiety Inventory:
A psychometric analysis (Unpublished doctoral dissertation), Eastern Kentucky University, Richmond, VA.
Sekirnjak G. C. (1998). Concurrent Validation of the Burns
Depression Checklist and the Burns Anxiety Inventory: (Unpublished master’s thesis), Eastern Kentucky University, Richmond, VA.
Sekirnjak C., & Beal D. (1999, November). The concurrent validity of the Burns Anxiety Checklist. Paper presented at
the Annual Meeting of the Association for the Advancement of Behavior Therapy. Toronto, Canada.
Somers J. M., Goldner E. M., Waraich P., & Hsu L. (2006). Prevalence and incidence studies of anxiety disorders: Review of the literature. Canadian Journal of Psychiatry, 51, 100–113.
Spielberger C. D., Gorsuch R. L., & Lushene R. E. (2008).
STAI. Cuestionario de Ansiedad Estado-Rasgo [State Trait Anxiety Inventory] (7th Ed. Rev.). Madrid, Spain: TEA
Stanley M. A., & Beck J. G. (2000). Anxiety disorders.
Clinical Psychology Review. 20, 731–754. http://dx.doi. org/10.1016/S0272-7358(99)00064-1
Statistical Package for the Social Sciences. (2006). SPSS Base
15.0 User’s guide. Chicago, IL: SPSS Inc.
Zung W. W. K. (1971). A rating instrument for anxiety disorders. Psychosomatics, 12, 371–379. http://dx.doi. org/10.1016/S0033-3182(71)71479-0