Expression of Na
1/glucose co-transporter 1 (SGLT1) in the intestine of piglets
weaned to different concentrations of dietary carbohydrate
Andrew W. Moran
1, Miran A. Al-Rammahi
1, Daleep K. Arora
1, Daniel J. Batchelor
1, Erin A. Coulter
1,
Catherine Ionescu
2, David Bravo
2and Soraya P. Shirazi-Beechey
1*
1Epithelial Function and Development Group, Department of Veterinary Preclinical Sciences, University of Liverpool, Liverpool, UK
2Pancosma SA, Geneva, Switzerland
(Received 6 October 2009 – Revised 5 January 2010 – Accepted 9 February 2010 – First published online 13 April 2010)
Naþ/glucose co-transporter 1 (SGLT1) transports dietary sugars from the lumen of the intestine into enterocytes. Regulation of this protein is essential for the provision of glucose to the body and, thus, is important for maintenance of glucose homeostasis. We have assessed expression of SGLT1 at mRNA, protein and functional levels in the intestinal tissue of 28 d old piglets weaned onto isoenergetic diets with differing concentrations of digestible carbohydrate (CHO). We show that expression of SGLT1 remains constant when piglets are fed up to 40 % CHO-containing diets. However, there is a significant increase in SGLT1 expression when the CHO content of the diet is . 50 %. Morphometric analyses indicate that the increased expression is not due to a trophic effect. It has been proposed that in rat intestine, in response to a high-CHO diet, GLUT2 (the classical basolateral membrane monosaccharide transporter) is translocated to the luminal membrane of enterocytes to absorb excess dietary glucose. We show, using immunohistochemistry and Western blotting with antibodies raised to amino acids in different epitopes of GLUT2, that under all dietary conditions, low to high CHO, GLUT2 is expressed on the basolateral membrane of pig enterocytes. Furthermore, functional studies indicate that there is no uptake of 2-deoxy-D-glucopyranoside, a specific substrate of Naþ-independent glucose transporters into brush-border membrane vesicles isolated from the intestines of piglets either maintained on low- or high-CHO diets. Thus, SGLT1 is the major route for absorption of dietary sugars across the luminal membrane of swine enterocytes.
Na1/glucose co-transporter 1: GLUT2: Dietary carbohydrates: Weaned piglets
The classical model of intestinal sugar transport is that glucose and galactose are transported from the lumen of the intestine into enterocytes by the Naþ/glucose co-transporter 1 (SGLT1), whereas fructose is transported by a facilitated, Na-independent transporter, GLUT5. Glucose, galactose and fructose, once accumulated in the cells, are released from the cytosol across the basolateral membrane into the systemic system by another facilitated Naþ-independent monosacchar-ide transporter, GLUT2(1,2).
It has been suggested, however, that in the intestine of rodents, in response to a high-carbohydrate (CHO) diet, or intestinal infusion with high concentrations of glucose or fructose, GLUT2 is translocated to the luminal membrane of enterocytes to absorb dietary glucose or fructose(3,4), imply-ing that GLUT2, as well as SGLT1, is involved in the uptake of dietary sugars. In support of this proposition Gouyon et al.(5) have reported that in GLUT2-knockout mice, fructose uptake in the intestinal brush-border membrane vesicles (BBMV) was half of that in the wild-type mice, indicating that brush-border membrane GLUT2 absorbs 50 % of luminal fructose(5).
In contrast, it has been demonstrated by Barone et al.(6)that GLUT5-knockout mice cannot absorb fructose. Furthermore, these workers have shown that the absorption of glucose across the brush-border membrane of GLUT5-knockouts is solely accomplished by SGLT1, concluding the lack of invol-vement of luminal GLUT2 in monosaccharide absorption(6). Moreover, in glucose – galactose malabsorption, which results from mutations within the SGLT1 gene(7,8), human infants cannot absorb glucose or galactose. Fructose, however, can be absorbed normally(7), indicating the presence of a func-tional transcellular route via luminal GLUT5 and basolateral GLUT2 for the absorption of fructose. The presence of GLUT2 on the luminal membrane would forestall the chronic and potentially fatal diarrhoea experienced by these children, suggesting that the expression of GLUT2 on the luminal membrane does not extend to humans.
In the light of these controversies it was essential to identify the candidate glucose transporter and the properties of glucose uptake across the brush-border membrane of piglets’ entero-cytes. Moreover, this information was needed as the baseline for the proceeding paper(9) addressing the effect of artificial
* Corresponding author: Professor S. P. Shirazi-Beechey, fax þ 44 151 794 4244, email spsb@liverpool.ac.uk
Abbreviations:BBMV, brush-border membrane vesicle; CHO, carbohydrate; SGLT1, Naþ/glucose co-transporter 1; PVDF, polyvinylidene fluoride; Tris, 2-amino-2-hydroxymethyl-propane-1,3-diol. qThe Authors 2010
British
Journal
of
Nutrition
sweeteners, routinely included in weaning piglets’ diet, on the capacity of the gut to absorb dietary sugars.
It has been shown, using high and low concentrations, 1·9 v. 70·0 % CHO-containing diets, that expression of SGLT1 and the capacity of the gut to absorb glucose in rodents is enhanced in response to a high-CHO diet(10 – 12). However, very little information is available on the threshold concen-tration required to stimulate SGLT1 up-regulation. It was important therefore, to assess the intestinal capacity of piglets to absorb glucose in response to increasing concentrations of dietary CHO.
In the present paper we have assessed the expression of SGLT1 and GLUT2 in the intestinal tissues of weaned piglets maintained on isoenergetic diets with differing concentrations of digestible CHO. Collectively, the data demonstrate that, in pig intestine, SGLT1 is the major route for absorption of dietary glucose from the lumen of the intestine into entero-cytes. Furthermore, the intestinal capacity (via SGLT1) to absorb glucose becomes limiting when the CHO content of the diet is . 50 %; to avoid malabsorption, there is an up-regulation in SGLT1 expression.
Methods
Animals, diets and tissue collection
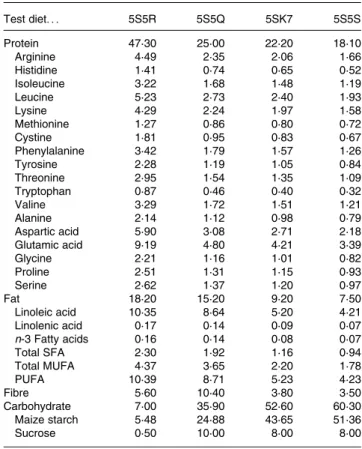
Male and female suckling Landrace £ Large White piglets (28 d old) were placed in pairs into standard pens measuring 1·5 m £ 1·5 m in a room with continuous heating (26·78C) and a 12 h light – dark cycle. To avoid any dietary contribution from the bedding, dust-extracted wood shavings were used. All animals had free access to food and water. The left-over food and water not consumed per d by each pair were recorded. Diets were obtained from Purina Mills (Richmond, IN, USA). The piglets were weaned onto isoenergetic (15·82 kJ/g) diets differing in the amount of CHO, with nutri-tional profiles depicted in Table 1. The CHO content of the diets consisted mainly of maize starch with a small amount of sucrose. The diets contained the following CHO contents: 7·0 % (test diet no. 5S5R); 35·9 % (test diet no. 5S5Q); 52·6 % (test diet no. 5SK7); 60·3 % (test diet no. 5S5S). Each group, consisting of between eight and twelve piglets, was fed for 3 d either the 7·0, 35·9, 52·6 or 60·3 % CHO-containing diet. The animals remained healthy throughout the experiment, and had no sign of enteric disturbances. Sub-sequently, they were killed with an intravenous injection of 20 ml pentobarbitone (200 mg/ml, Pentoject; AnimalCare Ltd, York, UK) to the cranial vena cava (in line with the UK Home Office schedule 1 regulation). Immediately, sec-tions of the small intestine approximately 40 cm in length were removed from the proximal (distal to the gastric pylorus), mid- (half way along the small intestine) and distal (proximal to the ileo-caecal junction) small intestine. The gut samples were everted, rinsed with ice-cold saline, wrapped in aluminium foil and frozen immediately in liquid N2. Following transportation to the laboratory, frozen tissue samples were stored at 2 808C until use. Small sections (1 – 2 cm) of fresh tissue from each region were fixed for histo-logical and immunohistochemical examinations. Histohisto-logical examination of samples of fixed tissues confirmed that they were intact, with epithelial cells attached.
Isolation of brush-border membrane vesicles
BBMV were prepared as described by Shirazi-Beechey et al.(13). All steps were carried out at 48C. Briefly, sections of everted small intestine were thawed in a buffer (100 mM -mannitol, 2 mM
-HEPES/2-amino-2-hydroxymethyl-propane-1,3-diol (Tris); pH 7·1), cut into 1 – 2 cm pieces and vibrated for 1 min at maximum speed using a Vibromixer (Alpha Laval, Eastbourne, East Sussex, UK). In this procedure epithelial cells are shed into the medium. Subsequently, the suspension was filtered through a Bu¨chner funnel to remove muscle and connective tissues. The filtrate was then homogen-ised using a Polytron (Ystral, Cambridge, UK) for 2 £ 30 s. The resulting homogenate was then filtered through two layers of nylon gauze. Next, MgCl2 was added to a final concentration of 10 mM and the solution was stirred on ice for 20 min. The homogenate was then centrifuged for 10 min at 3000 g (SS34 rotor; Sorvall, Stevenage, Herts, UK) and the resulting supernatant fraction was further centrifuged for 30 min at 30 000 g. The pellet was suspended in a buffer (100 mM-mannitol, 0·1 mM-MgSO4 and 20 mM-HEPES/Tris; pH 7·1) and homogenised with ten strokes of a Potter-Elvehjem Teflon hand-held homogeniser (Fischer Scientific UK Ltd, Loughborough, Leics, UK) before centrifuging for 30 min at 30 000 g. The final pellet was re-suspended in an isotonic buffer (300 mM-mannitol, 0·1 mM-MgSO4and 20 mM-HEPES/ Tris; pH 7·4) and homogenised by passing through a twenty-seven-gauge needle several times. The BBMV were divided into samples and stored in liquid N2 until use. The protein concentration in the original cellular homogenate and
Table 1. Nutritional profile of the diets (%)
Test diet. . . 5S5R 5S5Q 5SK7 5S5S Protein 47·30 25·00 22·20 18·10 Arginine 4·49 2·35 2·06 1·66 Histidine 1·41 0·74 0·65 0·52 Isoleucine 3·22 1·68 1·48 1·19 Leucine 5·23 2·73 2·40 1·93 Lysine 4·29 2·24 1·97 1·58 Methionine 1·27 0·86 0·80 0·72 Cystine 1·81 0·95 0·83 0·67 Phenylalanine 3·42 1·79 1·57 1·26 Tyrosine 2·28 1·19 1·05 0·84 Threonine 2·95 1·54 1·35 1·09 Tryptophan 0·87 0·46 0·40 0·32 Valine 3·29 1·72 1·51 1·21 Alanine 2·14 1·12 0·98 0·79 Aspartic acid 5·90 3·08 2·71 2·18 Glutamic acid 9·19 4·80 4·21 3·39 Glycine 2·21 1·16 1·01 0·82 Proline 2·51 1·31 1·15 0·93 Serine 2·62 1·37 1·20 0·97 Fat 18·20 15·20 9·20 7·50 Linoleic acid 10·35 8·64 5·20 4·21 Linolenic acid 0·17 0·14 0·09 0·07 n-3 Fatty acids 0·16 0·14 0·08 0·07 Total SFA 2·30 1·92 1·16 0·94 Total MUFA 4·37 3·65 2·20 1·78 PUFA 10·39 8·71 5·23 4·23 Fibre 5·60 10·40 3·80 3·50 Carbohydrate 7·00 35·90 52·60 60·30 Maize starch 5·48 24·88 43·65 51·36 Sucrose 0·50 10·00 8·00 8·00
British
Journal
of
Nutrition
BBMV was estimated by its ability to bind Coomassie blue according to the Bio-Rad assay technique (Bio-Rad, Hemel Hempstead, Herts, UK). Porcine g-globulin was used as the standard.
Disaccharide enzyme assays
Maltase and sucrase activities were measured at 388C in BBMV isolated from the intestine of piglets on diets of vary-ing CHO content as described previously(13 – 15)using maltose or sucrose as substrates respectively. D-Glucose released, as the result of substrate hydrolysis, was measured using a commercial kit (R-Biopharm Rhoˆne Ltd, Glasgow, UK).
Measurement of monosaccharide transport
Naþ-dependent glucose uptake into BBMV was measured as described(12,13,15). The uptake of D-glucose was initiated by
the addition of 100 ml of incubation medium containing 100 mM-NaSCN (or KSCN), 100 mM-mannitol, 20 mM
-HEPES/Tris (pH 7·4), 0·1 mM-MgSO4, 0·02 % (w/v) NaN3and 0·1 mM-[U-14C]-D-glucose (GE Healthcare, Little Chalfont, Bucks, UK) to BBMV (100 mg protein). The reaction was stopped after 3 s by the addition of 1 ml of ice-cold stop buffer containing 150 mM-KCl, 20 mM-HEPES/Tris (pH 7·4),
0·1 mM-MgSO4, 0·02 % (w/v) NaN3 and 0·1 mM-phlorizin. A 0·9 ml portion of the reaction mixture was removed and filtered under vacuum through a 0·22 mm pore cellulose acet-ate – nitracet-ate filter (GSTF02500; Millipore, Watford, Herts, UK). The filter was washed with 5 £ 1 ml of ice-cold stop buffer, placed in a vial containing 4 ml of scintillation fluid (Scintisafe; Fisher Scientific, Loughborough, Leics, UK) and the radioactivity retained on the filter measured using a LS 6500 multi-purpose scintillation counter (Beckman-Coulter, High Wycombe, Bucks, UK). All uptakes were measured in triplicate. To assess the activity of any potential facilitated glucose transporter, the initial rate of uptake of 1 mM
-2-deoxy-D-glucopyranoside, a specific substrate of Naþ-independent
D-glucose transport isoforms, into BBMV was determined at
388C. The incubation medium consisted of 300 mM-mannitol, 20 mM-HEPES/Tris (pH 7·4), 0·1 mM-MgSO4, 0·02 % (w/v) NaN3 and 1 mM-[U-14C]-2-deoxy-D-glucose.
Western blot analysis
The abundance of SGLT1 protein in cellular homogenates and BBMV was determined by Western blotting as described previously(15 – 17). Protein components of BBMV were separ-ated by SDS-PAGE on 8 % (w/v) polyacrylamide mini gels, containing 0·1 % (w/v) SDS, and electrotransferred to polyvi-nylidene fluoride (PVDF) membrane (Immun-Blot; Bio-Rad Laboratories Ltd, Hemel Hempstead, Herts, UK). The PVDF membranes were blocked by incubating for 1 h at room temperature in buffer PBS-TM (PBS containing 0·5 % (w/v) non-fat dried milk and 0·05 % (v/v) Tween-20) then incubated with SGLT1 antibody diluted 1:1000 in PBS-TM. The anti-body to SGLT1 was raised in rabbits (custom synthesis) to a synthetic peptide corresponding to amino acids 402 – 420 (STLFTMDIYTKIRKKASEK), a conserved intracellular loop region of SGLT1(16,17) sharing 93·1 % identity to the swine SGLT1 sequence. Immunoreactive bands were detected by
incubation for 1 h with affinity purified horseradish peroxidase-linked anti-rabbit secondary antibody (Dako Ltd, Cambridge, UK) diluted 1:2000 in PBS-TM solution, and visualised using an Enhanced Chemiluminescence system (GE Healthcare) according to the manufacturer’s instructions. The intensity of the immunoreactive bands detected in the BBMV was quantified using scanning densitometry (Phoretix 1D quantifier; Non Linear Dynamics, Newcastle-upon-Tyne, UK).
The PVDF membranes were stripped by 3 £ 10 min washes in 137 mM-NaCl, 20 mM-glycine/HCl (pH 2·5) and then probed with a monoclonal antibody to b-actin (1:20 000; clone AC-15; Sigma Aldrich, Poole, Dorset, UK) as a loading control. In order to determine the potential presence of GLUT2 in the BBMV, the cellular homogenate and BBMV were probed with antibodies to GLUT2 (either raised against the C-terminus or residues 40 – 55 of the GLUT2 amino acid sequence). The procedure was as described above for SGLT1 Western blotting except that the reagent used to block the PVDF membranes consisted of a buffer, PBS-TE (PBS, 0·1 % (v/v) Triton X-100 and 0·1 mM-EDTA) with
5 % (w/v) non-fat dried milk, and PVDF membranes were incubated with GLUT2 antibodies diluted 1:1000 in PBS-TE þ 1 % (w/v) non-fat dry milk.
RNA isolation, quantitative PCR
Total RNA isolated from intestinal tissue using the RNeasy Mini Kit with on-column DNase 1 digestion (Qiagen, Crawley, West Sussex, UK) was used for cDNA synthesis using Superscript III reverse transcriptase (Invitrogen, Paisley, UK) and random hexamer primers. cDNA was purified using the QiaQuick PCR purification kit (Qiagen) and PCR assays were performed using 25 ng cDNA per reaction. PCR primers for the amplification of SGLT1 (SLC5A1; accession no. M34044; sense 50-AAAGGAGAGGTCTGGGATGGTAA-30; anti-sense 50-ATTTCCCTAGTGGCCTGAGATTG-30) along with b-actin (ACTB; accession no. DQ452569; sense 50 -CGA-GGCCCAGAGCAAGAG-30; anti-sense 50 -TCCATGTCGTC-CCAGTTGGT-30) were designed using Primer Express (Applied Bio-systems, Warrington, Cheshire, UK) and pur-chased from Eurogentec (Seraign, Belgium). Each quantitative PCR reaction contained 5 ml of cDNA template (25 ng), 1 £ JumpStart Taq ReadyMix with SYBR green (Sigma Aldrich), and 900 nM of each primer in a total volume of 25 ml. Quantitative PCR cycling was performed as follows: initial denaturation at 958C for 2 min followed by thirty-five cycles of 958C for 15 s, 608C for 60 s. All reactions were performed in triplicate using a Rotor-Gene 3000 (Qiagen Ltd). Relative amounts of SGLT1 mRNA were normalised to b-actin mRNA within each sample.
Immunohistochemistry
Immunohistochemistry was carried out based on previous procedures(16). Sections of small intestine from proximal, mid- and distal regions fixed for 4 h in 4 % (w/v) paraformal-dehyde – PBS were placed in 20 % (w/v) sucrose (Fluka, Gillingham, Dorset, UK) in PBS overnight. The tissue samples were then gelatine embedded and frozen in liquid N2-cooled isopentane before sectioning on a cryostat (Bright Instrument
British
Journal
of
Co. Ltd, Huntingdon, Cambs, UK). Sections, 10 mm thickness, were thaw-mounted onto polylysine-coated slides, and were washed 5 £ 5 min in PBS followed by 1 h incubation in block-ing solution (10 % (v/v) donkey serum in PBS) at 258C in a humidifier chamber. Sections were incubated overnight at 48C with primary antibodies either against SGLT1, GLUT2 (C-terminus) or GLUT2 (residues 40 – 55), all diluted 1:100. The antibody to SGLT1 was the same as that used in Western blotting for the determination of SGLT1 protein abundance (see above). One of the antibodies used for immunohistochem-ical localisation of GLUT2 was raised in rabbits (custom synthesis) to a synthetic peptide (AAVEMEFLGATETA) corresponding to amino acids 511 – 524 of equine GLUT2 C-terminus region; there is 92·4 % identity in this region between pig and horse GLUT2(16). The other antibody to GLUT2 (ab1342; Millipore, UK) was raised against a peptide (SHYRHVLGVPLDDRRA) corresponding to residues 40 – 55 of rat GLUT2 (sharing 87·5 % identity with the corresponding pig sequence). Following incubation of sections with primary antibodies, slides were washed with PBS as described earlier and sections were stained using fluorochrome-labelled reagents. Fluorescein isothiocyanate-conjugated IgG second-ary antibodies (Stratech, Scientific Limited, New market, Suffolk, UK) were used at a dilution of 1:500 for 1 h at room temperature. Sections were washed thoroughly with PBS as described earlier before mounting with Vectashield hard mounting medium (Vector Laboratories Ltd, Peterbor-ough, Cambs, UK). Immunofluorescent labelling of SGLT1, and GLUT2 proteins on enterocyte plasma membrane domains, along the crypt – villus axis, were visualised using an epifluorescence microscope (Nikon, Kingston upon Thames, Surrey, UK) and images were captured with a Hamamatsu digital camera (C4742-96-12G04; Hamamatsu Photonics K.K., Hamamatsu City, Japan). Omission of primary anti-bodies was routinely used as the control. The amount of specific fluorescent labelling for SGLT1 on the brush-border membrane along the crypt – villus axis was determined as described below. SGLT1 expression in the crypt was negligible.
Quantitative immunohistochemistry for Naþ/glucose co-transporter 1
Immunofluorescent images showing labelling for SGLT1 protein along crypt – villus axes were captured with a 10 £ objective using Imaging Products Laboratory software (Nikon) and stored as 16-bit Tiff files. The quantitative analyses were carried out using MetaMorph software (MDS Analytical Technologies Ltd, Wokingham, Berks, UK).
To assure accurate quantification of SGLT1 protein, each stage in the process was standardised. All villi were subject to strict criteria, i.e. being intact, with well-orientated SGLT1 labelling along both sides of the villus. MetaMorph software ensures that binning (2 £ 2) and the white and black points are kept constant throughout(18). Binning allows several pixels to be grouped into a function unit reducing the impact of read noise on the signal:noise ratio(18). Parameters for image acquisition were set to make sure that no pixel saturation of any image took place. At 10 £ magni-fication, a 200 ms exposure time ensured that no saturated
pixels were formed, thus allowing quantification of the flor-escence signal analysed to be in the linear range.
Each villus was divided into five equal areas lengthwise from villus tip to the crypt – villus junction; horizontal lines were placed longitudinally to separate each area (refer to Fig. 4(a)). This eliminated the assessment of overlapping areas. The first, third and fifth areas were designated as upper villus, mid-villus and lower villus, respectively. Analyses were carried out in these areas. Five regions of interest (refer to Fig. 4(a)), each being of equal shape and size (16 pixels in size), were positioned over the SGLT1 labelling on the brush-border membrane on either the right or left side of the villus. The regions of interest were placed at approximately equal distance covering the SGLT1 signal. The integrated intensity for each region of interest was then recorded automatically by the software for each area and the average value was normalised to that in the crypt (the latter having a negligible SGLT1 signal). Five villi were measured per slide for three sections, five sections apart, for each animal. A five-section gap between quantified sections was used to ensure that the same villus was not accidentally measured twice.
Morphometry
Morphometry was performed on 10 mm cross-sections prepared from frozen intestinal sections. Slides were exposed to tap water for 15 s and incubated in Mayer’s Haemalum (3·3 mM-Mayer’s Haemalum-haematoxylin, 1 mM-sodium
iodate, 0·42 mM-potassium alum) for 1 min before gently washing with running tap water for 5 min. Slides were then stained with eosin Y solution (1 % (w/v) eosin aqueous; HD Supplies, Buckingham, Bucks, UK) for 10 s before washing with 95 % (v/v) ethanol for 3 £ 1 min, and with absolute ethanol 3 £ 1 min, followed by washing with xylene 3 £ 1 min and finally mounting with D.P.X. neutral mounting medium (Sigma Aldrich).
Digital images were captured with an Eclipse E400 micro-scope and DXM 1200 digital camera (Nikon) and analysed using ImageJ software (Wayne Rasband, US National Institutes of Health, Bethesda, MD, USA) calibrated using a 100 mm gradient slide. Villus height was measured as the average distance from villus base to villus tip from an average of sixteen well-oriented villi per section, from at least eight different cross-sections per tissue segment. Crypt depth was calculated as the distance from crypt base to crypt – villus junction for each specimen.
Statistical analysis
Analysis of changes in SGLT1 expression along the crypt – villus axis (lower villus compared with mid- and upper villus) was determined using a two-way ANOVA. A Bonferroni post hoc test was used to determine significant differences in SGLT1 expression in response to diets (7 to 60·3 % CHO diets) in the crypt, lower, mid- and upper villus. All other statistical analyses were performed using a Student’s t test. All tests were carried out using GraphPad Prism 5 (GraphPad Software, La Jolla, CA, USA). Results were considered significant if P, 0·05.
British
Journal
of
Ethical approval
National/institutional guidelines for the care and use of animals were followed and all experiments were approved by the University of Liverpool ethics committee.
Results
Effect of increasing concentration of dietary carbohydrate on Naþ/glucose co-transporter 1 expression
Piglets, aged 28 d, were weaned onto diets of varied CHO content for 3 d. Animals were weighed daily and recorded (see Table 2). On day 1 the animals lost between 200 and 400 g weight because they ate very little. However, by day 3, all regained the weight lost.
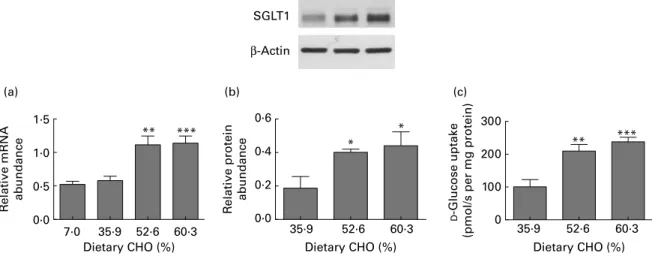
The expression of SGLT1 was measured at the level of mRNA, protein and function. The amount of SGLT1 mRNA in the mid-intestine of the piglets maintained on either the 7·0 or 35·9 % CHO diet was similar (Fig. 1(a)). However, when piglets were fed either the 52·6 or 60·3 % CHO diet the amount of SGLT1 mRNA was, respectively, 1·9-fold and 2-fold (P¼ 0·0015; P¼ 0·004) higher than that in piglets fed the 7·0 or 35·9 % CHO diet (Fig. 1(a)).
The abundance of SGLT1 protein in BBMV from the mid-small intestine was assessed by Western blotting (Fig. 1(b)). In BBMV isolated from the intestine of piglets fed the 52·6 and 60·3 % CHO diets, there were, respectively, 2·1-fold and 2·4-fold increases (P¼ 0·0412 and P¼ 0·0421) in SGLT1 protein abundance as compared with piglets fed the 35·9 % CHO diet (Fig. 1(b)). This correlated with a 2·1-fold (P¼ 0·0093) and 2·4-fold increase (P¼ 0·0002) in the initial rate of Naþ-dependent D-glucose transport into the same isolated BBMV (Fig. 1(c)). Mean uptake rates were 100·6 (SD 21·8), 209·3 (SD 20·3) and 237·6 (SD 13·9) pmol/s per mg protein for the 35·9, 52·6 and 60·3 % CHO diets, respect-ively. There was no significant difference in the levels of SGLT1 mRNA, protein and glucose transport function in the mid-intestine of the animals fed either the 52·6 or 60·3 % CHO diet. Morphometric analysis indicated that neither crypt depths nor villus heights differed in the intestines of piglets fed either the 35·9 or 60·3 % CHO diet, ruling out a trophic effect (Fig. 2).
SGLT1 expression in the proximal intestine was lower than that in the mid-small intestine (Fig. 3). SGLT1 expression in the proximal intestine of piglets fed the 60·3 % CHO diet was significantly higher than that seen in the 35·9 % CHO-fed group (2·2-fold increase; P¼ 0·0419; Fig. 3(a)). This corresponded to a 1·7-fold change (P¼ 0·0015) in the rate of D-glucose uptake in the proximal intestine of animals fed the 60·3 % CHO diet compared with those fed the 35·9 % CHO diet (Fig. 3(b)). There was no up-regulation in SGLT1 expression in the distal region of the intestine in response to an increased CHO content of the diet (Fig. 3).
Profile of disaccharidase enzyme activities
The activities of the brush-border membrane disaccharidases, sucrase and maltase, were determined in BBMV isolated from the mid-small intestine of pigs fed either the 7·0, 35·9 or 60·3 % CHO diet. There was a 2·6-fold (P¼ 0·0392)
Table 2. Animal weights on days 0 and 3* (Mean values and standard deviations)
Weight (kg)
Day 0 Day 3
Dietary CHO (%) Mean SD Mean SD
7·0 8·30 1·17 8·13 1·30
35·9 8·03 0·480 8·22 0·534
52·6 8·74 1·01 8·73 0·944
60·3 8·40 0·990 8·33 0·762
CHO, carbohydrate.
* The weight of each animal was recorded on each day of the study.
35·9 52·6 60·3 0 100 200 300 ** *** D -Glucose uptak e
(pmol/s per mg protein)
35·9 52·6 60·3 0·0 0·2 0·4 0·6 * * R elati ve protein abundance 7·0 35·9 52·6 60·3 0·0 0·5 1·0 1·5 ** *** R elati ve mRNA abundance
Dietary CHO (%) Dietary CHO (%) Dietary CHO (%)
(a) (b) (c)
SGLT1 β-Actin
Fig. 1. Expression of Naþ
/glucose co-transporter 1 (SGLT1) is up-regulated when the carbohydrate (CHO) content of the diet exceeds intestinal glucose absorp-tive capacity. Four groups of 28 d old piglets were weaned to isoenergetic diets containing 7·0, 35·9, 52·6 or 60·3 % CHO in the form of maize starch and sucrose. The amount of feed and water provided each day was the same for all groups. In the mid-small intestine: (a) steady-state levels of SGLT1 mRNA as determined by quantitative PCR and normalised to b-actin mRNA; (b) SGLT1 protein abundance in brush-border membrane vesicles (BBMV) assessed by Western blotting (upper) and densitometric analysis (lower) of Western blots of SGLT1 protein expression normalised to that of b-actin; (c) SGLT1-mediated glucose uptake
measured by Naþ-dependent [U-14C]-D-glucose uptake into BBMV. Data were generated in triplicate, with five to nine animals in each group. Values are means,
with their standard errors represented by vertical bars. Mean value was significantly different from those of the groups fed the 7·0 and 35·9 % CHO diets: * P, 0·05, ** P, 0·01, *** P, 0·001 (Student’s t test).
British
Journal
of
and 2·4-fold (P¼ 0·0303) increase in maltase activity in BBMV isolated from the intestine of piglets fed the 35·9 and 60·3 % CHO diets, respectively, compared with animals fed the 7·0 % CHO diet (Table 3). There were no statistically significant differences in the activity of sucrase between the groups fed the 7·0, 35·9 or 60·3 % diet (Table 3).
Quantitative immunofluorescence for Naþ/glucose co-transporter 1
Having shown that there is an enhancement in intestinal SGLT1 expression when CHO content of the diet is . 50 %, we assessed where along the crypt – villus axis this increase occurs. In all dietary conditions SGLT1 labelling was on the brush-border membrane of the entire villus (Fig. 4(a)). The labelling was specific; it was not observed when the primary antibody was excluded (Fig. 4(b)). There was negligible expression
of SGLT1 in the crypt (Fig. 4(a)) as demonstrated in other species(12,19). Quantitative immunohistochemistry showed that the pattern of SGLT1 expression along the crypt – villus axis of piglets fed the 7·0 % CHO diet was the same as that of piglets fed the 35·9 % CHO diet, with SGLT1 expression 1·1-fold higher (P¼ 0001) in the mid-villus com-pared with the upper villus (Fig. 4(c)). This pattern of expression has been shown in other species(19,20). However, when piglets were fed either the 52·6 or 60·3 % CHO diet, the amount of SGLT1 protein in the mid- and upper villus was, respectively, 1·9-fold, 1·6-fold and 1·4-fold higher (P, 0·0001) than that in piglets fed the 35·9 % CHO diet, with higher expression in the mid- compared with the upper villus (Fig. 4(c)).
Expression of GLUT2 in the small intestine
Using antibodies raised to either the C-terminus or residues 40 – 55 of GLUT2, we examined expression of GLUT2 in the small intestine of piglets. As shown in Fig. 5, both antibodies reacted with a protein exclusively located on the basolateral membrane of enterocytes of piglets maintained on either the 7·0 % (Fig. 5(a) and (c)) or the 60·3 % (Fig. 5(b) and (d)) CHO diet. No labelling was observed on the brush-border membrane of enterocytes under either dietary condition. Furthermore, using Western blotting and probing cellular homogenate and BBMV with antibodies to GLUT2, there was a negligible level of GLUT2 in the BBMV compared with the cellular homogenate. In contrast, SGLT1 abundance was 15-fold enriched in the same population of BBMV compared with the cellular homogenate.
These results correlated well with functional assays (Fig. 6). Initial rates of Naþ-dependent D-glucose transport in BBMV isolated from the intestinal tissues of piglets maintained on the 35·9 and 60·3 % CHO diets were 100·6 (SD 21·8) and 237·6 (SD 13·9) pmol/s per mg protein for the 35·9 and
60·3 % CHO diets, respectively. When Naþin the incubation medium was replaced with Kþ, the rates were reduced to 4·56 (SD 1·09) and 4·94 (SD 0·62) pmol/s per mg protein
for the 35·9 and 60·3 % CHO diets, respectively. The rates of 2-deoxy-D-glucose uptake into the same population of
BBMV were negligible and similar to glucose uptake in the presence of a Kþ-gradient (see Fig. 6).
100 200 300 400 0 100 200 Villus height (µ m) Crypt depth (µ m)
Fig. 2. Mean crypt depth and villus height in intestinal segments from piglets fed diets varying in carbohydrate (CHO) content. Frozen sections from the mid-small intestine of piglets fed either 35·9 % (A) or 60·3 % ( ) CHO were stained with haematoxylin and eosin. Villus height and crypt depth were measured using ImageJ (Wayne Rasband, US National Institutes of Health, Bethesda, MD, USA). Values are means, with their standard errors repre-sented by vertical bars. No statistically significant differences were observed.
Proximal Mid Distal
0 100 200 300 *** ** D -Glucose uptak e
(pmol/s per mg protein)
Proximal Mid Distal
0·0 0·5 1·0 1·5 * *** R elati ve mRNA abundance (a) (b)
Fig. 3. Changes in expression of Naþ/glucose co-transporter 1 (SGLT1) along the length of the intestine of piglets on low- and high-carbohydrate (CHO) diets.
Piglets were fed either a 35·9 % (A) or 60·3 % (p) CHO diet. (a) Steady-state levels of SGLT1 mRNA normalised to b-actin mRNA. (b) SGLT1-mediated glucose
uptake measured by Naþ-dependent-[U-14C]-D-glucose uptake into brush-border membrane vesicles. Data were generated in triplicate, with five to nine animals in
each group. Values are means, with their standard errors represented by vertical bars. Mean value was significantly different from that of the group fed the 35·9 % CHO diet: * P, 0·05, ** P, 0·01, *** P, 0·001 (Student’s t test).
British
Journal
of
Discussion
SGLT1 is the rate-limiting step for absorption of dietary glucose from the lumen of the intestine into the body. Regu-lation of this protein is essential for the provision of glucose and, thus, has important nutritional implications.
We have previously shown that sweet taste receptor hetero-dimers (T1R2/T1R3) are expressed in the intestinal enteroen-docrine cells(12,21), and that these cells are in direct contact with the lumer of the intestine through their apical exten-sions(9). We further demonstrated that T1R2/T1R3 with the G-protein, gustducin, are part of a sugar-sensing regulatory machinery that regulates SGLT1 expression in response to high dietary CHO. In wild-type mice kept on a high-CHO (70 %) diet for 2 weeks, the expression of SGLT1 was 2-fold
higher than in mice maintained on a low-CHO (1·9 %) diet(12,22). However, a-gustducin- and T1R3-knockout mice showed no change in SGLT1 expression; on either diet, the amount of SGLT1 mRNA, protein and function in both types of knockout mice was identical to that of wild-type animals on the low-CHO diet.
We proposed that there is a constitutive pathway, indepen-dent of luminal sugar sensing by T1R3 and a-subunit of gustducin, that maintains the basal expression of SGLT1 and an inducible pathway dependent on T1R3 and a-gustducin. The data suggested that luminal glucose when above a threshold activates, in enteroendocrine sensor cells, a signal-ling pathway involving T1R2 þ T1R3, a-gustducin and other taste signalling elements(12). This results in the secretion of gut hormones implicated in SGLT1 up-regulation(23,24) in the neighbouring absorptive enterocytes.
Recent data in our laboratory have shown that when wild-type mice were fed for 3 h on either a high-CHO (70 %) or maintained on a low-CHO (1·9 %) diet, the magnitude of up-regulation in SGLT1 expression was identical to those maintained for 2 weeks(12), indicating that enhanced expression of SGLT1 in response to the intake of a high-CHO diet is a rapid process.
In the present paper we aimed to determine the approximate threshold concentration of CHO required for the activation of SGLT1 up-regulation. Four groups of 28 d old suckling piglets were weaned onto and maintained on isoenergetic diets with differing amounts of CHO for 3 d. Afterwards, the piglets were killed, and intestinal tissues removed for our analyses. We showed that SGLT1 expression remained constant in the intestine of piglets when fed the 7·0 or 35·9 % CHO-containing diets. However, when they were fed either the 52·6 or 60·3 % CHO diet there was a coordinated increase in intestinal SGLT1 mRNA, protein abundance and Naþ-dependent glucose transport. This implies that the cellular level of control is at the level of mRNA abundance.
It appears, therefore, that the basal level of SGLT1 is suffi-cient to absorb glucose up to certain concentrations. However, the intestinal capacity to absorb glucose becomes limiting when concentration of the CHO content of the diet reaches about 50 – 60 %. This concentration is detected, leading to the activation of pathway(s) regulating SGLT1 expression(12). It has been proposed that in the intestine of rodents, in response to either an intake of high dietary CHO, or infusion with high concentrations of glucose or fructose, GLUT2 is translocated to the luminal domain of enterocytes to transport both glucose and fructose(3,4,25). The same authors have also suggested that the antibody targeted to residues on the extra-cellular loop between transmembrane regions 1 and 2, but not the antibody targeted to the C-terminus region of GLUT2, reacts with a protein on the brush-border membrane of rat enterocytes(3). The data presented, however, are open to interpretations that differ from the conclusions made.
In our studies using both antibodies raised to either the C-terminus or extracellular loop we showed that GLUT2 is exclusively expressed on the basolateral membrane of piglets’ enterocytes irrespective of dietary CHO content (Fig. 4). This observation was supported by our functional studies. There was negligible uptake of 2-deoxy-D-glucopyranoside, a specific substrate of Naþ-independent glucose transporters, into BBMV isolated from the intestines of piglets maintained either on the 35·9 or 60·3 % CHO diet. The same BBMV,
Table 3. Disaccharidase activity†
(Mean values with their standard errors for four to six animals per group)
Specific activity (mmol/min per mg protein)
Maltase Sucrase
Dietary CHO (%) Mean SEM Mean SEM
7·0 0·306 0·050 0·120 0·030
35·9 0·788* 0·075 0·110 0·016
60·3 0·758* 0·061 0·120 0·017
CHO, carbohydrate.
* Mean value was significantly different from that of the piglets fed the 7·0 % CHO diet (P, 0·05).
† Specific activities of sucrase and maltase were measured in brush-border mem-brane vesicles isolated from the mid-small intestine of piglets fed either a 7·0, 35·9 or 60·3 % CHO-containing diet. UV MV LV Crypt (a) C LV MV UV 0 1 2 3 4 * * * * * * Relative protein abundance (c) (b)
Fig. 4. Immunofluorescent localisation of Naþ
/glucose co-transporter 1 (SGLT1) along the crypt – villus axis of the small intestine. (a) Representative immunofluorescent image showing labelling for SGLT1 protein on the brush-border membrane of the entire villus of piglets fed a 60·3 % carbohydrate (CHO) diet. UV, upper villus; MV, mid-villus; LV, lower villus. There is negligible labelling in the crypt. No labelling was observed with omission of the primary antibody (b). Regions of interest are shown as circles. Image (a) is 100 £ magnified, scale bar ¼ 100 mm; image (b) is 200 £ magnified, scale bar ¼ 10 mm. (c) Quantitative immunofluorescent labelling of SGLT1 abun-dance along the crypt – villus axis. Sections of 10 mm of small intestine from piglets fed 7·0 % (A), 35·9 % ( ), 52·6 % ( ) or 60·3 % ( ) CHO were immu-nostained for SGLT1. The abundance of SGLT1 protein in crypt (C), LV, MV or UV was quantified using Metamorph software (MDS Analytical Techno-logies Ltd, Wokingham, Berks, UK) and normalised to immunofluorescent labelling in the crypt. Values are means, with standard deviations represented by vertical bars. Statistical significance was determined using a two-way ANOVA with a Bonferroni post hoc test. * Mean value was significantly different from those of the groups fed the 7·0 and 35·9 % CHO diets (P, 0·001).
British
Journal
of
however, could transport glucose in an Naþ-dependent manner. Furthermore, using Western blotting, we showed a negligible level of GLUT2 in BBMV, although the same population of BBMV expresses high levels of SGLT1. In sup-port of latter findings, Cui et al.(26)have shown, by Western blotting, that GLUT2 is not expressed on the brush-border membrane of rat enterocytes luminally perfused in vivo with either 100 mM-fructose or 100 mM-glucose for 4 h(26). Basolat-eral location for GLUT2 in the intestine of horses maintained on a high-CHO diet (grain) has also been observed(16), supporting the function of GLUT2 in the intestine to be the basolateral membrane monosaccharide transporter. Collec-tively our data support the conclusion that SGLT1 is the major route for the absorption of dietary glucose across the luminal membrane of pig enterocytes.
We showed that the rate of glucose absorption in the small intestine of the piglet is mid . proximal . distal regions. Furthermore, we determined that up-regulation in SGLT1 expression occurs in the proximal and mid, but not in the distal region of the small intestine. The reason for lack of response in the distal region is not known and is worth investigating. Using quantitative immunohistochemistry, we determined that the enhancement in SGLT1 expression (a) BLM BBM (b) BLM BBM (c) BLM BBM (d) BLM BBM (e) SGLT1 GLUT2 H BBMV (f) 75 kDa 55 kDa
Fig. 5. GLUT2 is expressed on the basolateral membrane of enterocytes. Immunofluorescence was carried out on 10 mm sections of mid-small intestine. Representative images showing expression of GLUT2 in the intestine of piglets, fed 7·0 % (a and c) or 60·3 % (b and d) carbohydrate (CHO) diets, either using an antibody raised against the C-terminus region of the GLUT2 amino acid sequence (a and b) or an antibody raised against a peptide corresponding to residues 40 – 55 of GLUT2 (c and d). (e) Primary antibody omitted control. Images (a) – (d) are 1000 £ and image (e) is 200 £ magnified, scale bar ¼ 10 mm. Brush-border membrane (BBM) and basolateral membrane (BLM) are marked. (f) Cellular homogenate (H) and brush-border membrane vesicles (BBMV) from the mid-small
intestine of piglets fed a 60·3 % CHO diet, immune-blotted for Naþ/glucose co-transporter 1 (SGLT1) and GLUT2 proteins.
35·9 % CHO 60·3 % CHO 0 100 200 300 *** Rate of uptake
(pmol/s per mg protein)
Fig. 6. D-Glucose and 2-deoxy-D-glucose uptake into brush-border
mem-brane vesicles (BBMV). Initial rates of [U-14C]-D-glucose uptake in the
presence of a Naþ
- (A) or Kþ
-gradient ( ), or 2-deoxy-[U-14C]-D-glucose (p)
uptake into BBMV, isolated from the mid-small intestine of piglets fed either a 35·9 or 60·3 % carbohydrate (CHO) diet, were measured. Data were gener-ated in triplicate, with five to nine animals in each group. Values are means, with their standard errors represented by vertical bars. *** Mean value was significantly different from that of the group fed the 35·9 % CHO diet (P, 0·001; Student’s t test).
British
Journal
of
along the crypt – villus axis initiated by a high-CHO diet is manifested in mid . upper . lower villus regions. The increase in SGLT1 expression is not due to trophic effects. Morphometric analysis indicated that there were no changes in villus height and crypt depth between animals maintained on low- or high-CHO diets. Interestingly, there was a 2·4-fold increase in specific activity of maltase, but not sucrase, in BBMV isolated from the intestine of piglets main-tained on the 60·3 % CHO diet compared with those fed the 7·0 % CHO diet.
CHO is a major constituent of the swine diet and is an important source of energy, in particular for growing piglets. It is also an expensive component of the diet. A better under-standing of the precise mechanism by which dietary glucose is absorbed in the intestine of the weaning piglets, and the recognition that the process is dietary induced and not genetically pre-programmed, will facilitate the development of rational strategies to enhance the capacity of the intestine to absorb dietary sugars. Furthermore, this knowledge will assist a more scientifically based approach to designing feed formulation and supplementations with the ultimate aim of enhancing the health of the young piglets and reducing the incidence of post-weaning intestinal disorders.
Acknowledgements
The financial support of Pancosma SA is greatly acknow-ledged.
A. W. M. and E. A. C. are funded by Pancosma SA. M. A.-R. is supported through a PhD award by the Republic of Iraq Ministry of Higher Education and Scientific Research. D. K. A. and D. J. B. are funded by PhD fellowships from the Horserace Betting Levy Board and the BBSRC/Pfizer Ltd, respectively. We are grateful to Dr Carrie Schultz, Tech-nical Service Manager, Land O’Lakes Purina Feed for her advice and fruitful discussions on the diets.
S. P. S.-B., A. W. M., M. A.-R. and D. K. A. designed the research; A. W. M., M. A.-R. and D. K. A. performed the research; D. J. B., a qualified veterinarian, carried out the injection of the anaesthetic and assisted in tissue removals; E. A. C. looked after animal maintenance; C. I. and D. B. provided advice; S. P. S.-B., A. W. M., M. A.-R. and D. K. A. analysed data; and S. P. S.-B. wrote the paper.
We declare that there is no conflict of interest.
References
1. Wright EM, Hirayama BA & Loo DF (2007) Active sugar transport in health and disease. J Intern Med 261, 32 – 43. 2. Shirazi-Beechey SP (1995) Molecular biology of intestinal
glucose transport. Nutr Res Rev 8, 27 – 41.
3. Affleck JA, Helliwell PA & Kellett GL (2003) Immunocyto-chemical detection of GLUT2 at the rat intestinal brush-border membrane. J Histochem Cytochem 51, 1567 – 1574. 4. Kellet GL & Heliwell PA (2000) The diffusive component of
intestinal glucose absorption is mediated by the glucose-induced recruitment of GLUT2 to the brush border membrane. Biochem J 350, 155 – 162.
5. Gouyon F, Caillaud L, Carriere V, et al. (2003) Simple-sugar meals target GLUT2 at enterocytes apical membrane to improve sugar absorption: a study in GLUT-2 null mice. J Physiol 552, 823 – 832.
6. Barone S, Fussell SL, Singh AK, et al. (2009) Slc2a5 (Glut5) is essential for the absorption of fructose in the intestine and generation of fructose-induced hypertension. J Biol Chem 284, 5056 – 5066.
7. Turk E, Zabel B, Mundlos S, et al. (1991) Glucose/galactose malabsorption caused by a defect in the Naþ/glucose cotran-sporter. Nature 350, 354 – 356.
8. Wright EM, Turk E & Martin MG (2002) Molecular basis for glucose – galactose malabsorption. Cell Biochem Biophys 36, 115 – 121.
9. Moran AW, Al-Rammahi MA, Arora DK, et al. (2010) Expres-sion of Naþ/glucose co-transporter 1 (SGLT1) is enhanced by supplementation of the diet of weaning piglets with artificial sweeteners. Br J Nutr 104, 637 – 646.
10. Ferraris RP & Diamond J (1997) Regulation of intestinal sugar transport. Physiol Rev 77, 257 – 302.
11. Ferraris RP, Villenas SA, Hirayama BA, et al. (1992) Effect of diet on glucose transporter site density along the intestinal crypt – villus axis. Am J Physiol 262, G1060 – G1068.
12. Margolskee RF, Dyer J, Kokrashvili Z, et al. (2007) T1R3 and gustducin in gut sense sugars to regulate expression of Naþ-glucose cotransporter 1. Proc Natl Acad Sci U S A 104, 15075 – 15080.
13. Shirazi-Beechey SP, Davies AG, Tebbutt K, et al. (1990) Preparation and properties of brush-border membrane vesicles from human small intestine. Gastroenterology 98, 676 – 685. 14. Dahlqvist A (1964) Method for assay of intestinal
disacchari-dases. Anal Biochem 7, 18 – 25.
15. Dyer J, Hosie KB & Shirazi-Beechey SP (1997) Nutrient regulation of human intestinal sugar transporter (SGLT1) expression. Gut 41, 56 – 59.
16. Dyer J, Al-Rammahi M, Waterfall L, et al. (2009) Adaptive response of equine intestinal Naþ/glucose co-transporter (SGLT1) to an increase in dietary soluble carbohydrate. Pflugers Arch 458, 419 – 430.
17. Dyer J, Vayro S, King TP, et al. (2003) Glucose sensing in the intestinal epithelium. Eur J Biochem 270, 3377 – 3388. 18. MicroscopyU (2009) Introduction to Fluorescence Microscopy.
http://www.microscopyu.com/articles/fluorescence/fluorescence intro.html (accessed April 2009).
19. Freeman TC, Wood IS, Sirinathsinghji DJ, et al. (1993) The expression of the Naþ/glucose cotransporter (SGLT1) gene in lamb small intestine during postnatal development. Biochim Biophys Acta 1146, 203 – 212.
20. Takata K, Kasahara T, Kasahara M, et al. (1992) Immunohisto-chemical localization of Naþ-dependent glucose transporter in rat jejunum. Cell Tissue Res 267, 3 – 9.
21. Dyer J, Salmon KS, Zibrik L, et al. (2005) Expression of sweet taste receptors of the T1R family in the intestinal tract and enteroendocrine cells. Biochem Soc Trans 33, 302 – 305. 22. Dyer J, Daly K, Salmon KS, et al. (2007) Intestinal glucose
sensing and regulation of intestinal glucose absorption. Biochem Soc Trans 35, 1191 – 1194.
23. Cheeseman CI (1997) Upregulation of SGLT-1 transport activity in rat jejunum induced by GLP-2 infusion in vivo. Am J Physiol 273, R1965 – R1971.
24. Singh SK, Bartoo AC, Krishnan S, et al. (2008) Glucose-depen-dent insulinotropic polypeptide (GIP) stimulates transepithelial glucose transport. Obesity (Silver Spring) 16, 2412 – 2416. 25. Helliwell PA, Richardson M, Affleck J, et al. (2000) Stimulation
of fructose transport across the intestinal brush-border membrane by PMA is mediated by GLUT2 and dynamically regulated by protein kinase C. Biochem J 350, 149 – 154. 26. Cui X-L, Schlesier AM, Fisher EL, et al. (2005)
Fructose-induced increases in neonatal rat intestinal fructose transport involve the PI3-kinase/Akt signalling pathway. Am J Physiol 288, G1310 – G1320.