HAL Id: hal-02382941
https://hal.inria.fr/hal-02382941
Submitted on 27 Nov 2019
HAL is a multi-disciplinary open access
archive for the deposit and dissemination of
sci-entific research documents, whether they are
pub-lished or not. The documents may come from
teaching and research institutions in France or
abroad, or from public or private research centers.
L’archive ouverte pluridisciplinaire HAL, est
destinée au dépôt et à la diffusion de documents
scientifiques de niveau recherche, publiés ou non,
émanant des établissements d’enseignement et de
recherche français ou étrangers, des laboratoires
publics ou privés.
Non-Invasive Pressure Estimation in Patients with
Pulmonary Arterial Hypertension: Data-driven or
Model-based?
Yingyu Yang, Stephane Gillon, Jaume Banus, Pamela Moceri, Maxime
Sermesant
To cite this version:
Yingyu Yang, Stephane Gillon, Jaume Banus, Pamela Moceri, Maxime Sermesant. Non-Invasive
Pressure Estimation in Patients with Pulmonary Arterial Hypertension: Data-driven or Model-based?.
STACOM 2019 - 10th Workshop on Statistical Atlases and Computational Modelling of the Heart,
Oct 2019, Shenzhen, China. �hal-02382941�
with Pulmonary Arterial Hypertension:
Data-driven or Model-based?
Yingyu Yang1, Stephane Gillon2, Jaume Banus1, Pamela Moceri2, and Maxime
Sermesant1
1 Inria, Universit´e Cˆote d’Azur, Sophia Antipolis, France 2
Nice University Hospital, Universit´e Cˆote d’Azur, Nice, France
Abstract. Right heart catheterisation is considered as the gold stan-dard for the assessment of patients with suspected pulmonary hyper-tension. It provides clinicians with meaningful data, such as pulmonary capillary wedge pressure and pulmonary vascular resistance, however its usage is limited due to its invasive nature. Non-invasive alternatives, like Doppler echocardiography could present insightful measurements of right heart but lack detailed information related to pulmonary vascu-lature. In order to explore non-invasive means, we studied a dataset of 95 pulmonary hypertension patients, which includes measurements from echocardiography and from right-heart catheterisation. We used data ex-tracted from echocardiography to conduct cardiac circulation model per-sonalisation and tested its prediction power of catheter data. Standard machine learning methods were also investigated for pulmonary artery pressure prediction. Our preliminary results demonstrated the potential prediction power of both data-driven and model-based approaches. Keywords: Cardiac modelling · Machine Learning · Pulmonary hyper-tension.
1
Introduction
Pulmonary arterial hypertension (PAH) is a pathological hemodynamic condi-tion defined as mean pulmonary arterial pressure (mPAP) at rest > 25 mmHg, measured by gold standard - right heart catheterisation (RHC) [12]. Pulmonary arterial hypertension can originate in lungs, heart, pulmonary artery and blood, and eventually leads to right heart failure or death. Standard diagnostic proce-dure requires clinical evaluation, non-invasive imaging and right heart catheter-isation [8].
However, some patients do not receive RHC as part of their diagnostic rou-tine and this may be related to lack of training or the potential perception of RHC invasive risk, especially in the pediatric population [13]. This phenomenon increases the possibility of incomplete diagnosis, which diminishes the effect of targeted therapies [4]. In reality, echocardiography and catheterisation are usu-ally conducted in separated labs. In order to combine the hemodynamic infor-mation provided by RHC and echocardiography, in our work, we explored the
possibility of incorporating catheter-based data prediction, specifically, mean pulmonary artery pressure (mPAP) and pulmonary vascular resistance (PVR), into routine echocardiography diagnosis.
There exists very simple ways to estimate PVR [11] and mPAP [3] but most of them only rely on one or two echocardiographic measurements, which largely propagates measurement uncertainty to prediction and constrains their usage under different physiological conditions. Recently, with the advance of machine learning techniques, data-driven algorithms demonstrated good performance in cardiac tasks [5]. Besides, numerical modeling of pulmonary circulation also showed the ability to assess hemodynamic values non-invasively [9]. In our work, we used a simplified cardiac lumped model which can be easily personalised from clinical data in order to simulate cardiac indicators. In addition, machine-learning based regression methods were also tested for their prediction power.
2
Methods
2.1 Data Presentation
Our retrospective dataset was collected from the records of Nice University Hospital in 123 patients with known or suspected pulmonary hypertension. Echocardiography-based cardiac indicators, such as ejection fraction, end-diastolic left and right ventricular volumes, were extracted by an experienced cardiolo-gist. Complete or incomplete catheterisation measurement records (44% received both echocardiography and catheterisation within 48 hours) are available for all the patients (see detailed data description in Table 1∗). Specifically, RAP in echocardiography data is estimated from inferior vena cava (IVC) diameter and its respirophasic variations, which leads to an ordinal value with possible values from {5,10,15,20}. sPAP is then calculated by sP AP = 4 ∗ T RV2
max+ RAP ,
where T RVmax refers to tricuspid regurgitation maximum velocity. In our
anal-ysis, records of 95 patients were included. The other 28 records were discarded because of lack of catheter measurement.
∗
Abbreviations: Body Surface Area (BSA), Pulmonary Artery HyperTension (PAHT), Heart Rate (HR), Brain Natriuretic Peptide (BNP), Blood Pressure (BP), Left Ventricle Ejection Fraction (LVEF), Left Ventricle Outflow Track Diameter (DLV OT), Velocity Time Integral of Left Ventricle Outflow Tract(V T ILV OT), Left
Ventricle End-Diastolic Diameter (LVEDD), Left Ventricle End-Systolic Diameter (LVESD), Left Ventricle End-Diastolic volume (LVEDV), Right Ventricle Ejection Fraction 3D (RVEF 3D), Right Ventricle Outflow Tract Diameter (DRV OT),
Veloc-ity Time Integral of Right Ventricle Outflow Tract(V T IRV OT), Right Ventricle
End-Systolic Diameter (RVESD), Right Ventricle End-Diastolic Volume (RVEDV), Sys-tolic Pulmonary Artery Pressure (sPAP), Tricuspid Annular Plane SysSys-tolic Excursion (TAPSE), Right Atrium Pressure (RAP), Mean Pulmonary Artery Pressure (mPAP), Pulmonary Capillary Wedge Pressure (Pcap), Pulmonary Vascular Resistance (PVR), Cardiac Output (CO), Cardiac Index (CI)
Table 1: Detailed Description of Patient Data
Feature Missing Statistics Feature Missing Statistics Clinical Information
Age 0 62±18 Sex 0 50.5% Female
Height (cm) 1 166.2 ± 9.5 Weight (kg) 1 68.2 ± 16.6 BSA 5 1.75± 0.23 BNP (ng/L) 7 275.4±508.6 HR 24 76± 13 BP (mmHg) 72 132± 22 & 81±16 PAHT Group 1 61.0%(1), 22.1%(3) 13.6%(4), 2.1%(5) 1.2%(NAN) NYHA 3 36.8%(2),46.3%(3) 13.6%(4) 3.3%(NAN) Echocardiography Data LVEF (%) 2 67.5 ± 8.9 RVEF 3D (%) 8 35.0 ± 9.8 DLV OT (mm) 59 18.9 ± 4.6 DRV OT (mm) 85 26.3 ± 5.2 V T ILV OT (cm) 59 19.4 ± 5.7 V T IRV OT (cm) 3 14.6± 4.5 LVEDD (mm) 18 43.7± 6.7 RVEDD (mm) 21 46.2±6.4 LVESD (mm) 42 26.1 ±6.3 RVEDV (mL) 8 98.1±39.7 sPAP (mmHg) 1 73.5± 23.5 RAP (mmHg) 0 10.6 ± 4.6 TAPSE (mm) 1 19.9± 5.5 S’Wave (cm/s) 1 11.3±3.0 Catheter Data mPAP (mmHg) 0 43.5±13.0 Pcap (mmHg) 1 11.4±4.0 RAP (mmHg) 0 8.9±4.3 PVR (UW) 4 7.5±4.0 CO (L/min) 4 4.7±1.4 CI (L/min/m2) 6 2.7±0.7 2.2 Modeling-based prediction
Cardiovascular 0D Model To incorporate cardiovascular dynamics into the prediction model, we consider a 0D model of the whole cardiovascular circulation system [2]. Derived from a 3D cardiac electromechanical model, the 0D model not only consists of less ordinary differential equation but also preserves the capacity to describe the important properties of the heart. Under the assump-tion of the spherical ventricle symmetry in 0D model, the inner radius (R0) is
directly related to the myocardial size. Reduced deformation and stress tensors demonstrate good representation of important cardiac characteristics, such as heart contractility (σ0) and stiffness (C1).
This 0D model has manifested its modeling potential in solving personalisa-tion problems [10]. Consider a 0D model M , with a set of parameters PM and
model states OM. We take a subset θ ⊆ PM, which contains parameters such
as heart contractility (σ0) and myocardial stiffness (C1), and fix all the other
parameters with default values. Interesting model states O ⊆ OM, such as
pul-monary artery pressure and ejection fraction, present cardiac indicators of the heart model. Given a set of clinical observations ˆO, the aim of personalisation is to find suitable varying parameters ˆθ so that the corresponding output of the fitted 0D model is as close as possible to clinical references, i.e. O(ˆθ) ≈ ˆO.
We assume Gaussian distribution priors for both interested parameters θ and model states O, i.e. θ ∼ N (µ, Σ) and O|θ ∼ N ( ˆO(θ), ∆). Essentially, the person-alisation problem equals to Maximum A Posterior. With Gaussian distribution,
Fig. 1: Schema of used cardiac 0D model (Adapted from [1]).
the objective function is derived as:
min{(O(θ) − ˆO)T∆−1(O(θ) − ˆO) + γ(θ − µ)TΣ−1(θ − µ)}
where ˆO refers to observed model states and ∆, a diagonal covariance matrix, represents the tolerance interval for each dimension of model states. The second term is regarded as a regulariser. γ controls to what extent we forces the param-eter θ to follow the prior distribution, which helps to attenuate the non-unique solution effect of this ill-posed inverse problem.
We solve this high-dimensional and convex problem by applying a non-parametric evolutionary strategy CMA-ES [6]. Iteratively Updated Prior (IUP) method, as defined in [10], is deployed to iteratively update the prior distribution based on former population personalisation results.
Experiments We first investigate the intrinsic prediction power of the 0D cardiovascular model. Based on the available clinical data, we chose the fol-lowing 5 features extracted from echocardiography for personalisation: systolic pulmonary artery pressure (sPAP), right ventricle ejection fraction (RVEF), right ventricle end-diastolic volume (RVEDV), left ventricle ejection fraction (LVEF). In order to assure equal stroke volume of left and right heart, the left ventricle end-diastolic volume (LVEDV) is calculated from available data: LV EDV = RV EDV ∗RV EF
LV EF . Considering the uncertainty of measurement, we
as-sign a tolerance interval for every selected feature: 200 Pa for sPAP, 5% for LVEF and RVEF and 10mL for RVEDV and LVEDV. Available RAP values are not included in our setting. Finally, parameters of both left heart and right heart are selected for personalisation: left and right heart contractility (σ0), left and right
myocardial stiffness (c1), right ventricle inner radius (R0), pulmonary proximal
resistance (Zc) and pulmonary distal resistance(Rp). Left ventricle radius is set
is set to 18mm, the mean value in the population. Since every patient possesses at least one target feature, we fit the model on the whole dataset of 95 patients. We assume the covariance Σ of varying parameters is a full matrix and γ is selected from {0.1, 0.5, 1, 2}.
We follow the same protocol as the cardiologist to extract mPAP and PVR from model output curves: mPAP is calculated as the mean value of pulmonary pressure-time integral during one cardiac cycle, and PVR is calculated as PVR (UW) = (mPAP - Pcap)/CO, where CO comes from flow-time integral and heart rate and Pcap is fixed at 10 mmHg.
A supervised method is also proposed based on personalisation. We split our dataset into training data and test data with a configuration of 5-fold cross-validation. In the training phase, echocardiography and catheter features are fitted iteratively with γ = 0.5 for 10 iterations. Then the fitted parameter dis-tribution of the 10th iteration of training data is used as test prior. We then
perform one iteration of personalisation to fit only echocardiography features for test data with γ ∈ {0.5, 1, 2}.
The optimisation of 0D model personalisation is performed over the logarithm of the parameter values.
Table 2: Selected features and parameters for 0D model personalisation Echo Catheter Varying parameters
sPAP mPAP Left heart contractility σ0
RVEF CO Left heart stiffness c1
LVEF Pcap Right heart contractility σ0
RVEDV PVR Right heart stiffness c1
LVEDV Right ventricular radius R0
Pulmonary proximal resistance Zp
Pulmonary distal resistance Rp
Model Implementation Our cardiac 0D model is originally implemented in CellML language. It was exported into C language and incorporated into a Python program which enables flexible experiments. The 0D model is very fast and it takes less than 1 second to output cardiac curves. CMA package implemented by N. Hansen et al. [7] is used in our optimisation. With parallel computation, optimal parameters for one patient can be found in 3 minutes on a computer with 8 cores (Intel i7-8650U CPU 1.90GHz).
2.3 Learning-based prediction
5 regression methods implemented in scikit − learn 0.21.2 were tested using echocardiographic cardiac features to predict catheter data: lasso regression, ridge regression (RR), k-nearest neighbour regression (KNN), partial least-square
regression (PLR) and ada-boosting decision tree regression (ADAT). Optimal hyper-parameters of different estimators were determined through nested 10-fold cross-validation grid search. Specifically, we search α ∈ {10−3, 10−2, ...102}
for Lasso and Ridge, number of neighbors N ∈ {2, 3, ...10} for KNN , num-ber of components N ∈ {1, 2, ...15} for PLR and numnum-ber of estimators N ∈ {2, 4, 8, 16, 50, 100, 200} for ADAT.
We use all the data except catheter data to perform regression analysis. Cat-egory data, such as NYHA, Group PAH, and columns with more than 40% missing values (V T ILV OT, DRV OT, DLV OT, LVESD and BP) were eliminated.
From available data, we are able to calculate T RVmax and V T IT RVmax
RV OT, the later
of which is reported correlated with PVR [11]. A correlation analysis on the 18 predictors shows linearity between some predictors (correlation coefficient larger than 0.6) and finally we have 11 predictors left for regression analysis : age, BSA, LVEF, RVEF, HR, RAP, sPAP, LVEDD, RVEDV,V T IRV OT, TAPSE.
Consid-ering the missing value problem of our dataset, simple and multiple imputation methods implemented in scikit − learn 0.21.2 are also conducted before every regression learning : mean imputation, median imputation, Bayesian ridge re-gression iterative imputation, k-nearest neighbour iterative imputation, decision tree regression iterative imputation and extra-tree iterative imputation. We re-port R2score (coefficient of determination) and root mean squared error (RMSE)
for each regression method based on a 5-fold cross validation.
We also test simple estimation (SIMPLE) methods for mPAP and PVR based on formulas mP AP = 0.61 ∗ P AP s + 2(mmHg) following the work of [3] and P V R = 29.7 ∗ (T RVmax/V T IRV OT) − 0.29 following the work of [11].
3
Results
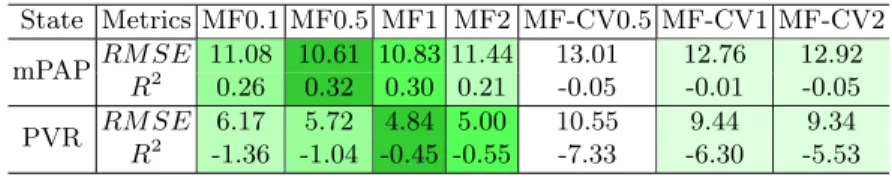
Modelling-based Prediction With only echocardiography-based indicators, our result of 0D model personalisation indicate that a reasonable γ improves prediction accuracy. A large γ will nominate objective function and forces vary-ing parameter to follow prior distribution, while a small γ enables more accurate feature fitting. In our case, with γ = 0.5, estimated mPAP correlates modestly with ground truth ( r = 0.65, p < 0.0001) and demonstrates a reasonable er-ror (shown in Table 3: MF0.5). With γ = 1, estimated PVR has the lowest error and correlates slightly with ground truth (r = 0.40, p < 0.001).
How-Table 3: 0D Cardiac Model based Prediction Results
State Metrics MF0.1 MF0.5 MF1 MF2 MF-CV0.5 MF-CV1 MF-CV2 mPAPRM SE 11.08 10.61 10.83 11.44 13.01 12.76 12.92
R2 0.26 0.32 0.30 0.21 -0.05 -0.01 -0.05 PVR RM SE 6.17 5.72 4.84 5.00 10.55 9.44 9.34 R2 -1.36 -1.04 -0.45 -0.55 -7.33 -6.30 -5.53
ever,in modelling-based supervised method (MF-CV), when echocardiography and catheter data are mixed for personalistion, the discrepancy between ECHO and CAT data mislead parameter prior direction. After training phase, we ob-tain prior distribution from last iteration of group personalisation. When new test data comes, personalisation is moving to a biased direction.
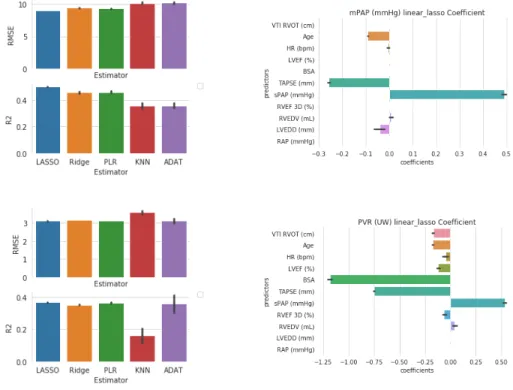
Learning-based Prediction In Fig.3, we observe that LASSO and PLR esti-mators not only demonstrate less prediction error, but also are more stable to various imputed data. Lasso coefficients show that both sPAP and TAPSE are significant factors for mPAP and PVR regression. This is consistent with the fact that mPAP and PVR are highly correlated (r = 0.81, p < 0.01).
Fig. 3: Mean Pulmonary Artery Pressure (mPAP) and Pulmonary Vascular Resistance (PVR) prediction results (Data-driven methods). Results of models with different im-putation methods are averaged to distinguish the performance of estimators. Results shown in mean ± std. (a) RMSE and R2 metric of different estimator for mPAP. (b) Lasso regression coefficient (alpha = 0.1) for mPAP prediction. (c) RMSE and R2 metric of different estimator for PVR. (d) Lasso regression coefficient (alpha = 0.01) for PVR prediction.
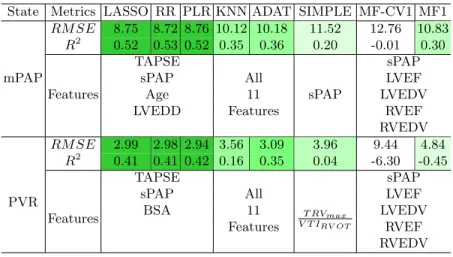
Prediction Summary we present the averaged metric value (based on different imputation methods) and involved features for all estimators. With lasso regres-sion result, we exclude the features with normalized coefficient smaller than 0.01 for mPAP and 0.2 for PVR, e.t. we have sPAP, TAPSE, LVEDD and age for mPAP and BSA, sPAP, TAPSE for PVR. We then redo LASSO RIDGE and PLR with those selected features. Here mPAP’s best prediction is with tuned hyperparameter: α = 0.01 for Lasso, α = 0.1 for RR, N = 8 for KNN, N = 2 for PLR and N = 500 for ADAT. PVR best result is with hyperparameters: α = 0.01 for Lasso, α = 0.5 for RR, N = 7 for KNN, N = 2 for PLR and N = 500 for ADAT.
Table 4: Best Regression results of different estimators for mPAP and PVR State Metrics LASSO RR PLR KNN ADAT SIMPLE MF-CV1 MF1
mPAP RM SE 8.75 8.72 8.76 10.12 10.18 11.52 12.76 10.83 R2 0.52 0.53 0.52 0.35 0.36 0.20 -0.01 0.30 Features TAPSE sPAP sPAP
sPAP All LVEF
Age 11 LVEDV
LVEDD Features RVEF RVEDV PVR RM SE 2.99 2.98 2.94 3.56 3.09 3.96 9.44 4.84 R2 0.41 0.41 0.42 0.16 0.35 0.04 -6.30 -0.45 Features TAPSE T RVmax V T IRV OT sPAP
sPAP All LVEF
BSA 11 LVEDV
Features RVEF RVEDV
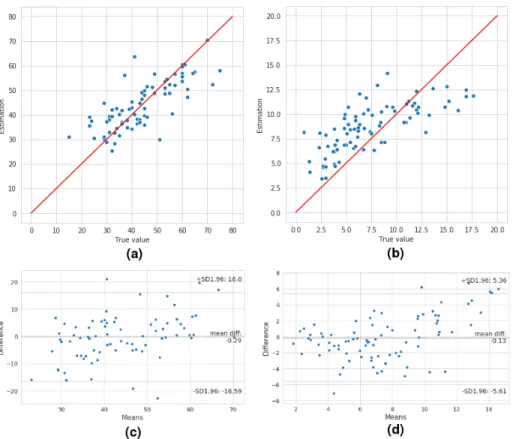
Using LASSO regression, we average the coefficient from different imputation methods and get the following estimation formula:
mP AP = 0.32 ∗ sP AP –0.65 ∗ T AP SE–0.12 ∗ Age–0.12 ∗ LV EDD + 45.83 (1) P V R = 0.05 ∗ sP AP − 0.33 ∗ T AP SE − 4.94 ∗ BSA + 18.83 (2) Supervised 0D model prediction (MD-CV1) fails to retain a good parameter prior for prediction however, echocardiography-based group optimisation demon-strates a prediction potential, which reveals the regularizing effect of population-based prior distribution. Here, best result is reached at γ = 1.
SIMPLE methods provide simple approximation of mPAP and PVR but their validity is restricted due to their dependence on one single measurement. Besides, regression methods surpass model-based estimation approaches. There may be two main reasons for their difference. First, we are not using all the available information for 0D model personalisation. For example, TAPSE, who is of signif-icance in regression, are difficult to incorporate into 0D personalisation system.
Fig. 4: Estimated value and ground truth comparison (lasso formulas). (a) The plot of mPAP ground truth and its estimated value using Equation 1. (b) The plot of PVR ground truth and its estimated value using Equation 2. (c) Bland-Altman analysis demonstrating the limits of agreement between invasive mPAP and mPAP determined via echocardiography, using equation 1. (d) Bland-Altman analysis demonstrating the limits of agreement between invasive PVR and PVR determined via echocardiography, using equation 2.
Secondly, our 0D model is highly reduced, some important measurements like V T IRV OT and T Rmax which exhibit important hemodynamic characteristics,
is not compatible. Whereas, unlike the imperative demand of complete data for regression methods, 0D model personalisation can deal with missing data issue naturally [10].
4
Conclusion
Our preliminary results show a good potential of using data-driven methods and model-based approaches for estimating pulmonary pressure in pulmonary hypertension patients. Data-driven method is fast, simple and give good approx-imation of pulmonary pressure, but it strongly demands complete observation. Model-based approach captures complex hemodynamics from observed data and deals with missing data issue naturally. Compared with data-driven methods, it exhibits a slightly poorer prediction accuracy. Based on current exploration, there are two directions of future work. One is to extend 0D model personal-isation method so as to integrate more observed data into system. The other is adopting data-driven methods to predict accurate parameter distribution for personalisation.
Acknowledgements. This work was supported by the Inria Sophia Antipolis - Mediterran´ee, ’NEF’ computation cluster. The authors would like thank the work of relevant engineers and scholars.
References
1. Banus, J., Lorenzi, M., Camara, O., Sermesant, M.: Large Scale Cardiovascular Model Personalisation for Mechanistic Analysis of Heart & Brain Interactions. Functional Imaging and Modelling of the Heart pp. 1–9 (2019)
2. Caruel, M., Chabiniok, R., Moireau, P., Lecarpentier, Y., Chapelle, D.: Dimen-sional reductions of a cardiac model for effective validation and calibration. Biome-chanics and Modeling in Mechanobiology 13(4), 897–914 (2014)
3. Chemla, D., Castelain, V., Humbert, M., H´ebert, J.L., Simonneau, G., Lecarpen-tier, Y., Herv´e, P.: New Formula for Predicting Mean Pulmonary Artery Pressure Using Systolic Pulmonary Artery Pressure. Chest 126(4), 1313–1317 (oct 2004) 4. Dea˜no, R.C., Glassner-Kolmin, C., Rubenfire, M., Frost, A., Visovatti, S.,
McLaughlin, V.V., Gomberg-Maitland, M.: Referral of Patients With Pulmonary Hypertension Diagnoses to Tertiary Pulmonary Hypertension Centers. JAMA In-ternal Medicine 173(10), 887 (may 2013)
5. Gudigar, A., Raghavendra, U., Devasia, T., Nayak, K., Danish, S.M., Kamath, G., Samanth, J., Pai, U.M., Nayak, V., Tan, R.S., Ciaccio, E.J., Acharya, U.R.: Global weighted LBP based entropy features for the assessment of pulmonary hypertension. Pattern Recognition Letters 125, 35–41 (jul 2019)
6. Hansen, N.: The CMA Evolution Strategy: A Comparing Review 102(2006), 75– 102 (2016)
8. Howard, L.S., Grapsa, J., Dawson, D., Bellamy, M., Chambers, J.B., Masani, N.D., Nihoyannopoulos, P., Gibbs, J.S.R.: Echocardiographic assessment of pul-monary hypertension: Standard operating procedure. European Respiratory Re-view 21(125), 239–248 (2012)
9. Kheyfets, V.O., O’Dell, W., Smith, T., Reilly, J.J., Finol, E.A.: Considerations for Numerical Modeling of the Pulmonary Circulation—A Review With a Focus on Pulmonary Hypertension. Journal of Biomechanical Engineering 135(6), 061011 (2013)
10. Moll´ero, R., Pennec, X., Delingette, H., Ayache, N., Sermesant, M.: Population-based priors in cardiac model personalisation for consistent parameter estimation in heterogeneous databases. International Journal for Numerical Methods in Biomed-ical Engineering (2018)
11. Rajagopalan, N., Simon, M.A., Suffoletto, M.S., Shah, H., Edelman, K., Mathier, M.A., L´opez-Candales, A.: Noninvasive Estimation of Pulmonary Vascular Resis-tance in Pulmonary Hypertension. Echocardiography 26(5), 489–494 (may 2009) 12. Rosenkranz, S., Preston, I.R.: Right heart catheterisation: best practice and pitfalls
in pulmonary hypertension. European Respiratory Review 24(138), 642–652 (2015) 13. Zuckerman, W.A., Turner, M.E., Kerstein, J., Torres, A., Vincent, J.A., Krishnan, U., Kerstein, D., Rosenzweig, E.B.: Safety of Cardiac Catheterization at a Cen-ter Specializing in the Care of Patients with Pulmonary ArCen-terial Hypertension. Pulmonary Circulation 3(4), 831–839 (dec 2013)

![Fig. 1: Schema of used cardiac 0D model (Adapted from [1]).](https://thumb-eu.123doks.com/thumbv2/123doknet/13477085.413066/5.918.210.712.173.386/fig-schema-used-cardiac-d-model-adapted.webp)