HAL Id: halshs-00809736
https://halshs.archives-ouvertes.fr/halshs-00809736
Preprint submitted on 11 Apr 2013HAL is a multi-disciplinary open access archive for the deposit and dissemination of sci-entific research documents, whether they are pub-lished or not. The documents may come from teaching and research institutions in France or abroad, or from public or private research centers.
L’archive ouverte pluridisciplinaire HAL, est destinée au dépôt et à la diffusion de documents scientifiques de niveau recherche, publiés ou non, émanant des établissements d’enseignement et de recherche français ou étrangers, des laboratoires publics ou privés.
Ageing, chronic conditions and the evolution of future
drugs expenditures
Thomas Barnay, Sophie Thiebault, Bruno Ventelou
To cite this version:
Thomas Barnay, Sophie Thiebault, Bruno Ventelou. Ageing, chronic conditions and the evolution of future drugs expenditures. 2010. �halshs-00809736�
WORKING PAPER
N° 2010 - 8
Ageing, chronic conditions and the evolution of
future drugs expenditures
T
HOMAS
B
ARNAY
,
S
OPHIE
T
HIÉBAUT
,
B
RUNO
V
ENTELOU
www.tepp.eu
TEPP - Institute for Labor Studies and Public Policies
1
Ageing, chronic conditions and the evolution of
future drugs expenditures
A five-year micro simulation from 2004 to 2029
Thomas BARNAY (ERUDITE, Université Paris-Est Créteil – TEPP FR CNRS 3126) Sophie THIEBAUT (INSERM U912)1
Bruno VENTELOU (INSERM U912 – CNRS Greqam/IDEP)
Abstract
• ContextThe healthy ageing assumptions may lead to substantial changes in paths of aggregate healthcare expenditures, notably catastrophic expenditures of people at the end of the life. But clear assessments of involved amounts are not available when we specifically consider ambulatory care (as drug expenditures) generally offered to chronically-ill people who can remain in this health-status for a long time onward. The Government and Social Security need tools to predict the future cost of health in particular drugs expenditures taking account epidemiological changes on future. This study estimates the evolution in reimbursable outpatient drug expenditures, attributable to age structure and chronic conditions changes, of the French population up to 2029.
• Methods
Matched data from both the 2004 Health and Social Protection Survey (carried out by IRDES) and from French Social Security databases were used in this study. We estimate the effects of epidemiological and life expectancy changes on French health expenditures until 2029 by applying a markovian microsimulation model from a nationally representative database. The originality of these simulations holds in using an aggregate indicator of morbidity-mortality, capturing vital risk and making it possible to adapt the quantification of life expectancies by taking into account the presence of severe chronic pathologies. Three epidemiological scenarios were constructed.
• Findings
We forecast future national drugs expenditures, under different epidemiological scenarios of chronic morbidity: Trend scenario, healthy ageing scenario and medical progress scenario. For the population aged 25+, results predict an increase in reimbursable drug expenditures of between 1.1% and 1.8% (annual growth rate), attributable solely to the ageing population and changes in health status.
• Conclusion
The small difference between the healthy ageing scenario (1.1%) and the simple continuation of trends scenario (1.4%) indicates that, contrary to expectations, reduced chronic conditions of future cohorts does not imply a large saving in terms of drug expenditures.
Code JEL : C15, D12, I11
1
2
1
Introduction
In 2009, health expenditures in France reached 11.5% of GDP and are likely to keep growing into the future. At the macro level, this trend is explained by five main factors: demography (Bebbington and Shapiro, 2005), income effect2, innovation, the health care system characteristics (public/private insurance, public policy and organization scheme) and the price effect (see Dormont, Grignon et al., 2006 for a decomposition of these effects on past trends). In this paper, our attention is focused on the first factor and its future impact on drug expenditures. We propose an evaluation of the financial consequences of population age structure evolution (i.e.: proportion of old people in the population) and population size change, coupled with morbidity and mortality changes at the micro level.
Drug expenditures are the main contributor of the growth in the volume of global health expenditures (increase in health expenditures in France saw an average annual growth rate of 3.5% (in volume) from 2000 to 2008, while drug expenditures, during the same period, increased twice as quickly). Drug expenditures represented 20.5% of total health expenditures in 2008, or 544 Euros per inhabitant per annum, accounting for almost 2% of French GDP. Projections for drug expenditures therefore play a decisive role. The issues are industrial but also concern the financing of health expenditures, especially in the context of the recent growth seen in the use of generics together with the massive cut backs seen in drug reimbursements (in 2008, 65% of drug expenditures were reimbursed by the Social Security). In the past, demography had weak impact on the growth of health expenditures. From French data, Azizi and Pereira, 2005 estimated that between 1970 and 1979 population ageing was annually responsible for 0.82% of spending growth with 0.65 points due to population increase and 0.17 points due to age structure changes. Dormont, Grignon et al., 2006 found, between 1992 and 2000, demographic changes were responsible for 7.63% or 0.92% annually. However the effects of demography will obviously be greater in the future with the baby-boomers reaching old age and the recent changes in longevity and health status.
In France, life expectancy at age 60 is increasing on average by two months every year, and one third of the French population will be over 60 by 2030 (WHO, 2006). Moreover, it is commonly postulated that drug expenditures increases as a function of age. In this framework, population ageing is expected to result in large drug expenditures increases into the future. However, the explanatory power of age has been criticized by Zweifel, Felder et al., 1999, who consider this demographic concern a “red herring” argument. Age is not a stable explanatory variable for health expenditures, since morbidity and mortality are changing over time. Health status and “time to death” explain most of the expenditure, greatly mediating the impact of age (Yang, Norton et al., 2003; Stearns and Norton, 2004; Shang and Goldman, 2008). Two possible scenarios are hypothesized to account for the observed increase in life expectancy and the likely impact on future health expenditures. First, medical and sanitary progress and healthier lifestyle choices have led to a longer healthy life expectancy (Olshansky and Ault, 1986; Nusselder, 2002; Oeppen and Vaupel, 2002). Second, medicine
2 The income effect can be explained on both sides of the health care market. On the demand side, life styles have improved over the last decades. People are also more educated and so have higher expectations in term of treatments and quality of care. At the same time, the supply side is better endowed in resources.
3
and treatment have led to an increase in life expectancy without increasing life quality by transforming deadly illnesses into chronic conditions (Michel and Robine, 2004; Robine, 2007). In that second case, chronic conditions become a highly relevant predictor of health expenditures during the life cycle at the micro-level, specifically regarding out-patient cares (Druss, Marcus et al., 2001; Fenina, Le Garrec et al., 2009). The micro-level nature of these important epidemiological transition variables (health status, time to death) strongly suggest that it is hazardous to rely on macro-level economic models to accurately determine future health expenditures.
2
Methods
Three steps are necessary to construct this micro-simulation:
(i) The definition of representative cohorts using a database created from large samples representative of the national population.
(ii)The artificial ageing of individuals, carried out using transition rates between health states.
(iii) The estimation of the drug expenditures vector, and finally the “simulation” of these expenditures, which consists in applying the vector to the artificially aged population.
2.1. Database
The data used in this study come from the joint use of a database belonging to the principal French health insurance providers - entitled “Echantillon Permanent d’Assurés Sociaux (EPAS)” (i.e. Permanent Sample of Social Security Contributors), with a French household survey entitled“Enquête sur la Santé et la Protection Sociale (ESPS)” (i.e. Health, health care and insurance survey), carried out by the Institute of Research and Documentation in Health Economics (IRDES).
EPAS comprises a panel of public health insurance recipients and contains exhaustive information about reimbursed expenditures by Social Security. The major advantage of this database is that it contains the exact values of out-patient expenditures, thereby avoiding any possible self reporting biases about healthcare consumptions. Note as well that the over-the-counter medications are not recorded by this administrative file. On the other hand, the organization of health insurance payments within hospital structures is such that drug expenditures are not individually accounted for, but form part of a “collective expense” (a sort of public ownership). However in France, outpatient drug expenditures account for 82% of total drug expenditures reimbursed by the public health care system, and are therefore driving the growth of reimbursed drugs expenditures.
The ESPS has been carried out using a self-administered survey every two years since 1988 in metropolitan France on a sample of 7,000 Social Security contributing households, or 22,000 individuals which are representative of over 96% of the French population. This database contains a great deal of information about Social Security contributors: individual and household data, demographic and epidemiological characteristics (notably several summary
4
indicators of health status), socio-economic data, and information about individuals’ insurance coverage.
In France, the ESPS coupled with the EPAS forms the only database cross-checking exact individual health expenditure with accurate information about insured. This database contains 10,328 observations of which 6,996 were exploitable for this study. The data were adjusted using calibration on margins (for age, sex and for household income) in order to obtain a representative sample of the global metropolitan population of 62.4 million individuals.
2.2 The chronic conditions measure
Morbidity rates and healthy life expectancies, for a given cohort, change over time and modify the relationship between age, health status and health expenditures. As a result, age is not a stable determinant of health expenditures (Dormont, 2009).
For example, Shang and Goldman, 2008 found a strong link between expenditures and self assessed health (SAH) after controlling for age. Indeed, age lost significance when SAH was introduced into the regression. The effects of age were thus explained by health status. .As well, the literature highlights that end of life expenditures explain the biggest part of the observed increase in expenditures associated with age, as the probability of dying is an increasing function of age (Zweifel, Felder et al., 1999; Yang, Norton et al., 2003; Stearns and Norton, 2004). Authors insist on the need to introduce a ‘time to death’ variable in the estimations, relating end-of-life expenditures with intensive care at hospital. In this paper we do not observe hospital spending but rather focus on another contributing factor than end of life: chronic illness and its potential compression, or expansion, within future cohort of older people (Stuckler, 2008). This variable of “chronic disease” better characterizes the (possibly long) life-history of people after 60 and is a better predictor of ambulatory expenditures, such as drugs. Thus, we need to determine a health status indicator which enables the evolution of chronic morbidity to be modeled, and more important, which gives us a consistent explanatory variable for the econometric model.
Various instruments for measuring health status are available. We usually find three main dimensions in health measurement (Blaxter, 1989): lists of diseases and symptoms (medical model), activity limitations (functional model) and self-assessment health (SAH) measures (subjective model). To sidestep this difficulty IRDES researchers have built two health status indexes, vital risk and disability. These scores have been provided by doctors on the basis of ESPS database (Mizrahi and Mizrahi, 1985). Vital risk corresponds to the death likelihood level and is built from illness and individual risk factors. It is rated on a 6-point scale from “no essential risk” to “a definite poor prognosis” which reflects an 80% probability of death within five years. Disability level induced by chronic conditions and is rated on an 8-point scale from “no impairment” to “permanently bed-ridden”.
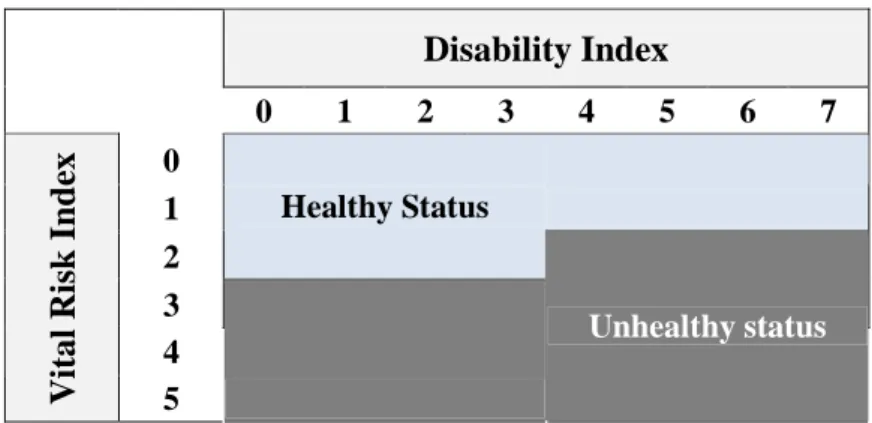
A chronic condition is one which medical treatment can alleviate but not cure. It is commonly described as a long-lasting or recurrent disease which generates disability. To capture those dimensions, we used the previous indexes to construct an aggregate binary index of health status by crossing the two variables3 of vital risk and disability, as described in appendix 3.The proxy variable for chronic conditions is composed of two modes: healthy e1 and
3 Note that the frontier has been chosen according to the classification made by Perronnin, M., L. Rochaix, et al. (2006). "Building a continuous indicator of state of health aggregating vital risk and disability (Construction d’un indicateur continu d’état de santé agrégeant risque vital et incapacité)." Questions d’Economie de la Santé(107).
5
unhealthy state e2. Thank to this synthetic indicator, it is not necessary to consider the whole
range of diseases in order to predict future health expenditures. Furthermore, the problem of poly-diseases (i.e. co-morbidities), which are very frequent in those aged over-60, is immediately accounted for. The unhealthy state refers to serious pathologies or chronic diseases (e.g. diabetes) for which complete remission is not generally possible. Accordingly in the model, state e2 is semi-absorbent (i.e. it is not possible to pass from e2 to e1).
2.3 The microsimulation model
2.3.1 Artificial ageing of the database
To simulate an individual’s future health status, we use an ageing algorithm based on Markov’s process (Briggs and Sculpher, 1998). The artificial process of ageing needs the construction of transition rates matrices, which contain probabilities of transition from one health status to another. We consider a matrix constructed by age group (each age group being equal to 5 years) and by sex. We therefore identify 72 types of people (19 age groups + 2 sexes + 2 health statuses; therefore 38 matrices containing 3 states of which 1 is an absorbing state - i.e. death) for which the pathway probabilities from one health status to another are different. At time t, an individual is either healthy or unhealthy. Then, at t+1 (i.e. five years later), health status will be determined by the probabilities of the transition matrix which he/she belongs to, knowing that his/her lottery (i.e. the line of the matrix) depends on his/her state of health at t.
Therefore, the epidemiological dynamic is written as:
[ ]
t t n e e t n t n e P e e j i = Γ = +1 , / , , .... ... r r vwith ern,t individual health status n at time t and
P
ei/ej being the probability of transition between state i and state j.These 5-year probabilities are arranged in the transition rate matrices as follows:
→ → → → → → → → → = Γ ) ( ) ( ) ( ) ( ) ( ) ( ) ( ) ( ) ( 3 3 2 3 1 3 3 2 2 2 1 2 3 1 2 1 1 1 e e P e e P e e P e e P e e P e e P e e P e e P e e P sex t sex t sex t sex t sex t sex t sex t sex t sex t sex t
2.3.2 Construction of epidemiological scenarios
In 2004, according to World Health Organization (WHO), the French spend on average 7.7 years in poor health and can expect to remain in good health 90% of their lives (WHO, 2006). France is thus in a position of dynamic equilibrium (Manton, 1982; Robine and Michel, 2004) characterized by an increase in prevalence of chronic diseases, offset by a lower severity (Robine, Mormiche et al., 1996). We must therefore distinguish two epidemiological effects. On the one hand, the morbidity compression delaying the onset of disease in the life cycle and leads to longer life expectancy (Fries, 1980; Crimmins, 1990; Robine, 1992; Khaw,
6
1997; Nusselder, 2002). On the other hand, the expansion of morbidity is defined by extending the unhealthy life expectancy (Kramer, 1980; Fuchs, 1984).
Population ageing is proposed according to three different scenarios of morbi-mortality. Except for the trend scenario, the previously calculated transition matrices are “deformed” in order to integrate epidemiological ageing hypotheses, basically by shifting transitions rate of the younger cohort to the older one. However, the shift is differentiated by sex. Meslé, 2004 found accelerated growth in life expectancy and morbidity compression for males when compared to females, due to an increase in healthier behaviors on the part of men. Indeed in 1990, the gap in life expectancy at birth was 8.2 years in 1990 and against men, it is in 2008 equal to 6.7 years.
Consequently we chose to differentiate between male and female morbidity (second and third scenario) and mortality (third scenario) evolution. To this end the shift is 10 years for men but only 5 for women. Thus men are catching up with women in terms of healthy life years and life expectancy.
- Trend scenario
Incidence and death rates are held constant with rates observed in 2004. The risk of falling ill is defined by reference to 2004, and we only take into account longer life span known as of 2010. The matrices correspond therefore to current morbidity rates, which come directly from the cross-sectional analysis of the ESPS2004 database. Accordingly, after simulating the drug expenditures, we obtain the degree of increase in expenditures linked only to the demographic effects arising from the deformation of the age pyramid. The predicted expenditures within the framework of this scenario consequently are only the result of continuation of trends.
-“Healthy ageing” scenario
This scenario is based on the hypothesis of reduced morbidity while mortality rates remain constant with the trend scenario. In order to obtain the healthy ageing scenario matrices, we reduce the probabilities of becoming chronically ill. Hence the probability of staying healthy is improved by the same magnitude as we do not change the death rates of the healthy population.
This way reflects rejuvenation by a shift in biological age which is now distinct from chronological age - and therefore improves health status of future populations. From the shift in probabilities, we redefined the degree of longer life span through its redistribution between healthy and unhealthy days. This hypothesis translates Robine, 2007 theory on ageing and the rectangularization of the survival curve: longer life results from an improvement in health states.
- Medical progress Scenario
In this scenario, the healthy ageing hypothesis is kept. We add a hypothesis of reduced mortality for healthy and unhealthy people. Thus, we suppose that the future will bring a reduction in mortality rates of unhealthy (by the transformation of fatal pathologies into chronic ones). This is an extreme healthy ageing scenario, characterized by a complete rejuvenation of age groups, incorporating a longer life expectancy. This scenario corresponds to the modeling of medical-technical progress which, for unhealthy people (having passed into state 2), increases their life span. Here, “medical progress” is only defined in terms of its demographic and epidemiological impacts (e.g, no scenario for changes in prices is tested).
7
2.4 Estimation of drug expenditures
2.4.1 The Econometric model
In order to project drug expenditures, we have used an econometric model based on individual data. Generally, the econometric treatment of health expenditures requires particular characteristics to be taken into account, notably the presence of individuals who have had no consumption of drugs for a whole year.
Although several estimation techniques are available, the analysis of the characteristics of the EPAS-ESPS2004 data determines the most suitable econometric model for drug expenditures. Twelve point five percent of the population had no drug expenditures in 2004. Based on Jones, 2000 and Deb and Trivedi, 2006, the “two-part” model seems the most appropriate to deal with the problem of “zero expense”, as it separates consumption behavior into two steps. First, the individual decides whether to consume or not (part 1), and then he/she decides the degree of consumption based on different factors (part 2). The global model (i.e. the conditional mathematical expectation of expenditures) is obtained by multiplying the probability of the decision to consume by the estimated conditional expenditures:
1, 2 1 2
( / p p ) Pr( 0 / p ) ( / p , 0)
i i i i i i i
E y x = y > x E y x y > (1) Where yi is the individual level of expenditures and xip1, 2p is the vector of the expenditures
explanatory co-variables (part 2) and of the decision to consume (part 1). The choice of such a modelization is also justified by the flexibility it brings to the model, by dividing the mechanism of consumption into nearly independent parts. The first part of the model (i.e. the probability of consuming), is estimated using a Logit:
1 1 1 ' ' ' 1 Pr( 0) 1 1 p i p p i i x i x x e y e e β β β − > = = + + (2) Where 1 ' p i
x β is the expression of the predictions ( p1
i
x the explanatory co-variables vector and β the vector of parameters estimated from the Logit model)
To model the second part of health expenditures we have the choice between two main types of models: generalized least squares models (GLM), and ordinary least squares (OLS) models with transformation of the dependent variable (see Manning and Mullahly, 2001; Buntin and Zaslavsky, 2004 for an algorithm to determine the best data fitting method). Having tested both alternatives, the GLM was rejected due to flatness in the distribution of residuals (indicated by the kurtosis coefficient). An OLS log-transformed model, re-transformed using a smearing factor, was identified as the best fitting model for projections of drug expenditures based on EPAS-ESPS2004 (Duan, Manning et al., 1983).
3
Results
3.1 Econometric model predictions
According to the methodological section, we proceed with the implementation of the two regression models, first in the general population and then in the consuming population. The result of these regressions is presented in appendices 2 and 3. Especially note that the health
8
status indicator is highly significant and captures well pharmaceutical expenditures heterogeneity in both parts of the model. Indeed, it appears to be the strongest expenditures predictor, while the impact of age remains very small. “Chronic conditions” is indeed playing the same role for ambulatory expenditures as “time-to-death” in the inpatient expenditures case.
Figure 1 enables the quality of predictions to be evaluated by establishing the comparison between the “real” expenditures (i.e. those coming from the database) and those which the model predicts for 2004. We then execute the model on the 2004 ESPS-EPAS survey data and simulate pharmacy based expenditures for 2004. The model respects the profile of expenditures very closely, in particular replicating the drop in expenditures after 80 years of age.
Figure 1. Comparison of real expenditures with predicted expenditures
3.2 Projected Populations and drug expenditures
The simulations of different ageing scenarios for individuals enable the assessment of the effects of epidemiological changes on the demographic structure of the population to be carried out. Table 1 confirms the significant increase in the over 60 population, which practically doubles in size in the medical progress scenario. Moreover, this artificial ageing model is true to INSEE’s (National Institute of Statistics and Economic Studies) predictions, their trend scenario predicting 19.7 million people aged over 60 years by 2030 (Léon and Godefroy, 2006). However, the scenarios clearly differ in terms of the distribution of elderly people between the “sick” and “not-sick”. In 2004, 51% of the over-60 population was unhealthy.
Whatever the scenario, the proportion of unhealthy people increases in the general population (+25). 27% of people aged 25 and over is in poor health in 2004. In 2029, this number reaches 36% in the trend scenario, 29% in the healthy aging scenario and 33% in medical progress one. The examination of an older population increases the prevalence of the disease but only in the trend scenario and medical progress. In 2004, 51% of the population over 60 is unhealthy. In 2029 this proportion was 58% in the baseline scenario, 48% in the healthy aging scenario and 54% in that of medical progress.
9
Table 1: Population (in millions) in 2004 and 2029 according to 3 scenarios and distribution between the sick and people in good health
ESPS 2004 Trend Scenario
Healthy Ageing Scenario Medical Progress Scenario Population ≥ 25 42,62 49,38 49,93 53,46
Whose healthy people 30,98 31,75 35,45 35,68
Whose unhealthy people 11,65 17,63 14,47 17,77
≥ 60
Population ≥ 60 12,66 20,87 21,41 24,83
Whose healthy people 6,16 8,84 11,21 11,44
Whose unhealthy people 6,50 12,02 10,20 13,39
Figure 2 shows the impact of the hypotheses of decreased morbidity (i.e. longer lifespan in good health) when underpinned by the healthy ageing and medical progress scenarios. Because in these two cases, the population is in better health than in the trend scenario, the average expenditures per age group are inferior. Mean expenditures in the medical progress scenario, which include a longer lifespan of both the sick and not-sick, are nevertheless higher than those for the healthy ageing scenario. In effect, in the former scenario, there is a greater number of unhealthy survivors.
Figure 2. Average individual drug expenditures according to age and scenario
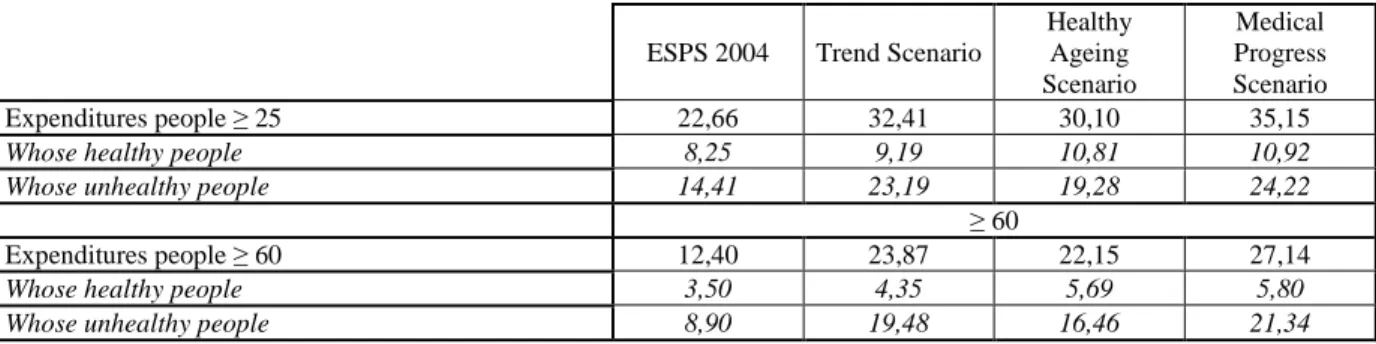
Population ageing, even with healthy ageing, seems to be responsible for a significant increase in drug expenditures (Table 2). The simple effect of ageing in the French population should lead to an increase of 43% in drug expenditures for those over 25 years old (when compared with 2004 and the trend scenario). The healthy ageing hypothesis limits this increase only slightly as drug expenditures continue to grow substantially, increasing by 33%. The medical progress scenario predicts a much stronger increase. Expenditure from now until 2029 could reach more than 35 billion Euros instead of the 22 billion Euros in 2004.
10
Table 2. Drug expenditures in 2004 and in 2029 according to the 3 scenarios and distribution between the healthy and unhealthy people (in billions euros)
ESPS 2004 Trend Scenario
Healthy Ageing Scenario Medical Progress Scenario Expenditures people ≥ 25 22,66 32,41 30,10 35,15
Whose healthy people 8,25 9,19 10,81 10,92
Whose unhealthy people 14,41 23,19 19,28 24,22
≥ 60
Expenditures people ≥ 60 12,40 23,87 22,15 27,14
Whose healthy people 3,50 4,35 5,69 5,80
Whose unhealthy people 8,90 19,48 16,46 21,34
4
Discussion
Longer life span is a matter of great debate amongst epidemiologists. In the future, shall it concern the compression of morbidity linked to an improvement in individual behaviours (e.g. improved daily hygiene and new knowledge in terms of preventive medicine (Fries, 1980; Crimmins, 1990; Robine, 1992; Nusselder, 2002) or instead shall it concern the development of medical progress and the nature of pathologies in elderly people, with a resulting automatic increase in the number of people living with chronic diseases Kramer, 1980; Fuchs, 1984? In the first case, the increase in life expectancy would be the result of increased life expectancy in good health, while, in the second case, life span while living with chronic disease would be prolonged.
As economists, we take no position about these theses. Instead we provide the means to evaluate the consequences of both. We propose the scenarios reflecting these two alternatives, in order to evaluate their differential impact using the means of microsimulation. The originality of the study is also to use a health status variable indicating “chronic condition” which is appropriate for the prediction of ambulatory healthcare expenditures. Our results indicate that, despite the improvement of the health status of elderly and the large significance of the variable in elderly individual’s health consumptions, their expenditures are not considerably reduced in 2029, firstly because of a volume effect of elderly age-groups, who, from 2010 onwards, are particularly numerous in France. Moreover, unhealthy people drug expenditures go on growing with age, as the profile of expenditures does not depend solely on people’s health. Delaying the date of onset of chronic disease, the expenditures are not completely postponed. The healthy ageing scenario therefore would not be very “cost saving”, as it does not compensate for the predicted growth in the number of elderly people in France in 2029.
Several hypotheses had to be carried out in order to make the technical treatment of this microsimulation possible. In our model, health status is summarized by a binary variable which does not take into account various levels of the seriousness of the state of the disease, nor the progressivity in the volume of medicine consumed by the sick, which is something that constitutes a limit of this tool. It does, however, involve the interaction between two different measurements of health state both diagnosed by medical professionals and consequently not self-declared. This important fact in turn limits individual heterogeneity biases. Moreover, the state of illness is seen as “absorbing”, that is to say that no remission is possible. Accordingly, this hypothesis, imposed by the complexity of the transition matrices, tends to overestimate the number of sick people and therefore the volume of medicines
11
consumed. We have tried to limit the consequences of this constraint by considering as “sick” all those persons who had a “very poor” life prognosis.
The choice of scenarios can determine the nature of the results. We decided to consider that a global scenario of the expansion of morbidity did not appear a likely option. Obviously, it would appear necessary to follow the increase in the prevalence of diabetes and obesity, two illnesses which are likely to induce new drug expenditures. Besides, in order to construct the healthy ageing scenario, we decided to shift (back) men of two age brackets, with one age bracket for women. A greater degree of shift would obviously increase the effects of the scenario on expenditures. Nevertheless, we recognize that this assumption seems already relatively optimistic, and so we opted for a situation where the measured differences gave results which are a priori magnified.
Despite these limits, rates of growth in drug expenditures seem relatively consistent with results from the literature. With regards to French data, two studies can be mentioned regarding total health expenditures (no estimations are available for drugs only). The OECD, 2006 estimates that between 2005 and 2025 population ageing would annually account for +1.76% in the pessimistic assumption (increase of life expectancy trends are accounted for but the current age expenditures profile remains constant) and for +1.43% in the optimistic assumption (they propose a healthy ageing scenario in the sense that their expenditures age profile progressively shifts to the right). The European Comission and Economic Policy Commitee, 2006 estimate that between 2004 and 2030, demographic-related growth will annually account for +2.1% in the pessimistic assumption and +1.87% in the optimistic assumption.
5
Conclusion
To our knowledge, this work is the first prospective microsimulation model for determining drug expenditures in France by the year 2029. It allows considering the acceleration of the ageing population due to high fertility after the second world-war. Our results show the sensitivity of drug expenditures projections to demographic and epidemiological changes (including increase of chronic diseases of elderly). In addition to a baseline scenario, we decided to test a hypothesis of delayed age of disease (healthy ageing) and a scenario additive increases in life expectancy (medical progress).
The pure effect of ageing of population in France is expected to generate an increase in drug spending of 43% (comparing 2004 and the trend scenario) equal to 1.44% of annual rate of growth). The assumption of healthy ageing is only slightly limiting growth. Drug spending continues to grow substantially, with a total increase of 33% (1.14 % of annual growth rate). The scenario anticipates medical advances grew significantly stronger. We notice that longer life span, notably for unhealthy people (i.e. the medical progress scenario), further accentuates the growth in drug expenditures associated with ageing. Drug expenditures by 2029 could reach more than 35 billion Euros against 22 in 2004 (1.77% of annual rate of growth).
Of course, these evaluations constitute a ceteris paribus prediction in terms of the evolution of pharmaceutical expenditures in France – i.e. it only takes account of the “automatic” effect of ageing and changes in morbidity.These rates of growth in drug expenditures are the minimum rates.
12
The drugs regulation policy of the French health care system could also play an important role in the future of reimbursed drugs expenditures. First, the authorization for the drug market is highly regulated. Reimbursed Drug Prices (and reimbursement rate) are not Market Prices but negotiated between the relevant public authorities and the pharmaceutical industries. Drug Volumes partially depend on Parliament regulation. Any change in this policy (e.g. a decrease of reimbursement rate) can modify the dynamics of drug expenditures, in value and perhaps in volume.
Other factors will play a role as follows: therapeutic decisions favoring the use of medicines (e.g. substituting surgery or other therapeutic actions for medicines, or innovations in available molecules); modification of relative prices; intensification of the demand for healthcare (cultural reasons). Healthcare seeking behaviors are also dictated both by the level of drug expenditures reimbursement and the level of coverage provided by complementary health insurance.
13
6
References
Azizi, K. and C. Pereira (2005). "Comparaison internationale des dépenses de santé: une analyse des évolutions dans sept pays (1970- 2002)." Dossiers solidarité et santé 1: 43- 60.
Bebbington, A. and J. Shapiro (2005). "Aging, health status and determinants of health expenditure (A.H.E.A.D.)." Personal Social Services Research Unit. University of Kent PSSRU Discussion Paper 2219.
Blaxter, M. (1989). A comparison of measures of inequality in morbidity. Health inequalities in European countries. J. Fox. Aldershot, UK: 199-230.
Briggs, A. and M. Sculpher (1998). "An introduction to Markov modelling for economic evaluation." Pharmacoeconomics 13: 397-409.
Buntin, M. B. and A. M. Zaslavsky (2004). "Too much ado about two-part models and transformation? Comparing methods of modeling Medicare expenditures." Journal of Health Economics 23: 525- 542.
Crimmins, E. M. (1990). "Are Americans healthier as well as longer-lived?" Journal of Insurance Medicine 22: 143- 166.
Deb, P. and P. K. Trivedi (2006). Empirical models of health health care use. The Elgar Companion to Health Economics. A. Jones, Edward Elgar Publishing.
Dormont, B. (2009). Les dépenses de santé : une augmentation salutaire ?
Dormont, B., M. Grignon, et al. (2006). "Health expenditures growth: reassessing the threat of aging." Health Economics(15): 947-963.
Druss, B., S. Marcus, et al. (2001). "Comparing the national economic burden of five chronic conditions." Health Aff (Millwood) 20(6): 233-41.
Duan, N., W. G. Manning, et al. (1983). "A comparison of alternative models for the demand for medical care." Journal of business & economic statistics 1(2): 115- 126.
European Comission and Economic Policy Commitee (2006). The impact of ageing on public expenditures: projections for the EU25 Member States on pensions, health care, long term care, education and employment transfers (2004-2050). Special Report.
Fenina, A., M.-A. Le Garrec, et al. (2009). Les comptes nationaux de la santé en 2008. Études et résultats. 701.
Fries, J. F. (1980). "Aging, natural death, and the compression of morbidity." New England Journal of Medicine 303: 130- 135.
Fuchs, V. R. (1984). ""Though much is taken": reflections on aging, health and medical care." Milbank Mem Fund Q Health Soc 62: 143- 166.
Jones, A. (2000). Health Econometrics. Handbook of Health Economics. Newhouse. 1: 285-299.
Khaw, K. T. (1997). "Healthy aging." British Medical Journal 315: 1090-6.
Kramer, M. (1980). "The rising pandemic of mental disorders and associated chronic diseases and disabilities." Acta Psychiatr Scand 62(Suppl. 285): 282- 297.
Léon, O. and P. Godefroy (2006). "Projections régionales de population à l’horizon 2030." INSEE première(1111).
Manning, W. G. and J. Mullahly (2001). "Estimating log models: to transform or not to transform?" Journal of Health Economics 20: 461- 494.
Manton, K. G. (1982). "Changing concepts of morbidity and mortality in the elderly population." Milbank Mem Fund Q Health Soc 60: 183- 244.
14
Meslé, F. (2004). "Gender gap in life expectancy: the reasons for a reduction of female advantage." Revue d'épidémiologie et de santé publique 52(4): 333-52.
Michel, J. P. and J. M. Robine (2004). "A ‘new’ general theory of population aging." The Geneva Papers on Risk and Insurance(29): 667-678.
Mizrahi, A. and A. Mizrahi (1985). Indicateurs de morbidité et facteurs socio-démographiques. CREDES. 657.
Nusselder, W. J. (2002). Compression of morbidity. Determining health ecpectancies, Chichester: John Wiley: 35- 58.
OECD (2006). Projecting OECD health and long term expenditures: what are the main drivers? . OECD Economics Department Working Papers: no. 477.
Oeppen, J. and J. W. Vaupel (2002). "Broken limits to life expectancy." Science 296(5570): 1029-1031.
Olshansky, S. J. and A. B. Ault (1986). "The fourth stage of the epidemiologic transition: the age of delayed degenerative diseases." The Milbank Quarterly 64(3): 355- 391. Perronnin, M., L. Rochaix, et al. (2006). "Building a continuous indicator of state of health
aggregating vital risk and disability (Construction d’un indicateur continu d’état de santé agrégeant risque vital et incapacité)." Questions d’Economie de la Santé(107). Robine, J.-M. (2007). Research issues on human longevity. Human longevity, individual life
duration, and the growth of the oldest-old population, Springer. Chapter 1: 7- 42. Robine, J.-M. and J.-P. Michel (2004). "Looking forward to a general theory on population
aging." Journal of gerontology 59A: 590-597.
Robine, J., P. Mormiche, et al. (1996). "Evolution des courbes de survie totale, sans maladie chronique et sans incapacite´ en France de 1981 à 1991: application d’un modèle de l’OMS." Ann Demogr Hist: 99–115.
Robine, J. M. (1992). Disability-free life expectancy. London, HMSO.
Shang, B. and D. Goldman (2008). "Does age or life expectancy better predict health care expenditures?" Health Economics 17(4): 487- 501.
Stearns, S. and E. C. Norton (2004). "Time to include time to death? The future of health care expenditure predictions." Health Economics(13): 315-327.
Stuckler, D. (2008). "Population Causes and Consequences of Leading Chronic Diseases: A Comparative Analysis of Prevailing Explanations." The Milbank Quarterly 86(2): 273-326.
WHO. (2006). "Highlights on health in France 2004." Highlights on health, from
http://www.euro.who.int/document/E88547.pdf.
Yang, Z., E. Norton, et al. (2003). "The real reasons older people spend more." Journal of Gerontology Science 58B(1): S1-S10.
Zweifel, P., S. Felder, et al. (1999). "Ageing of population and health care expenditure: a red herring?" Health Economics 8(6): 485 - 496.
15
Appendix 1. Transitions states
Table 3: Example of transition rates for female aged 50 to 59 years old
Female P(e1->e1) P(e1->e2) P(e1->e3) P(e2->e2) P(e2->e3) Trend 50-54 0,9102 0,0825 0,0072 0,9781 0,0218 55-59 0,8908 0,1001 0,0091 0,9723 0,0277 HA 50-54 0,9266 0,0661 0,0072 0,9781 0,0218 55-59 0,9102 0,0805 0,0091 0,9723 0,0277 MP 50-54 0,9266 0,0681 0,0052 0,9843 0,0157 55-59 0,9102 0,0825 0,0072 0,9781 0,0218
16
Appendix 2. Descriptive Statistics
Table 4. Co-variable descriptive statistics
Variable Modality Distribution (%)
Sex Men 47.15
Women 52.85
Health state Indicator In good health 72,67 Chronic Disease 27,33
Complementary Health Insurance Has Com Health Ins 88.01 Does not have Comp Health Ins 11.99
CMU* ( Special Public Complementary Insurance)
CMU recipients 4.25
Not a recipient of CMU 95.75
Body Mass Index (BMI) Underweight 2.80
Overweight 31.54
Obese 12.54
Normal 53.11
(Public) Health Insurance Regime Special Regime 24.28
General Regime 75.72
Alcohol Profile Non drinker 24.04
Not at-risk drinker 48.55
At risk drinker 27.41
Tobacco Smoker 23.81
Non smoker 76.19
Doctor Density High Doctor density 50.60 Low doctor density 49.40
Couples Not living in a couple 22.11 Living in a couple 77.89
* CMU is a public supplementary health insurance program which grants free of charge to those households with an annual income of around 9,000 Euros or less.
17
Appendix 3. Building the binary chronic conditions variable
To build the health status indicator we cross the vital risk and the disability variable as follow :
Table 5. Binary Chronic conditions status
Disability Index 0 1 2 3 4 5 6 7 0 1 2 Healthy Status 3 4 V it a l R is k I n d ex 5 Unhealthy status
Table 6. Items of the Disability Index
0 No Disability 1 Minimal Disability 2 Few Disability
3 Disability, but Normal Living
4 Have to Decrease Professional and Household Activities 5 Low Autonomy
6 No Household Autonomy 7 Full time Confinement to Bed
Table 7. Items of the Vital Risk Index
0 No Vital Risk
1 Very Low Poor Prognosis 2 Low Poor Prognosis 3 Possible Vital Risk 4 Poor Prognosis 5 Very Poor Prognosis
18
Appendix 4. Estimation of the probability of being a consumer of reimbursed medicines
Table 8. Association of predicted probabilities and observed responses
Concordant Percentage 73.6 Somers' D 0.477
Discordant Precentage 25.9 Gamma 0.480
Ties percentage 0.5 Tau-a 0.106
Pairs 1627968 c 0.739
Table 9. The logistic model: the probability of being a consumer of reimbursed medicines
Odds Ratios
Effect Estimated
Point
95% Wald Confidence Interval
Has a Chronic disease 2.785 1.975 3.928
Age 1.007 0.780 1.300
Age2 0.999 0.994 1.004
Age3 1.000014 1.000 1.000
Has complementary Health insurance 2.571 1.822 3.627
CMU recipients 4.674 1.926 11.343
General Insurance regime vs Special Insurance Regime 1.712 1.308 2.240
Living in a couple 1.366 1.038 1.798
Women 2.026 1.563 2.628
High Doctor Density VS Low Doctor density 1.292 1.049 1.592 Y = 1 represents 12.48% of the weighted sample of those over 25 years old
19
Appendix 5. Estimation of expenditures for reimbursed medicines
Table 10. Statistics of OLS model
R-square 0.3926
Root mean square of error 1.2366
Degrees of freedom 3335
Table 11. Estimated coefficients of regression
Parameter Estimation Standard error t Test value Pr > |t|
Constant 6.1433204 0.78592090 7.82 <.0001 Has a Chronic Disease 1.0814673 0.05681064 19.04 <.0001 Age -0.1994922 0.04617721 -4.32 <.0001 Age2 0.0043394 0.00086101 5.04 <.0001 Age3 -0.0000253 0.00000494 -5.12 <.0001 Health Insurance 0.3402625 0.08741645 3.89 0.0001 CMU recipients 0.5041919 0.18191389 2.77 0.0056 Body Mass Index (BMI) Normal Reference
BMI Underweight 0.3997516 0.16217829 2.46 0.0138 BMI Overweight 0.1619703 0.05054641 3.20 0.0014 BMI Obese 0.3142043 0.07027668 4.47 <.0001 Alcohol profile : at risk Consumer Reference
Alcohol profile : non Consumer 0.4052201 0.07552941 5.37 <.0001 Alcohol profile : not at risk Consumer 0.1887194 0.06445822 2.93 0.0034 Women 0.2753358 0.05587362 4.93 <.0001 Non-smoker 0.1615484 0.06053003 2.67 0.0076
TEPP Working Papers
10-1. Are young French jobseekers of ethnic immigrant origin discriminated against? A controlled experiment in the Paris area
Emmanuel Duguet, Noam Leandri, Yannick L’Horty, Pascale Petit
10-2. Couple’s Work Hours, Satisfaction and reconciling Work and family Life
Nathalie Georges, Dominique Méda, Danièle Trancart
10-3. Housing ownership, social housing and unemployment: an econometric analysis of the Paris area
Emmanuel Duguet, Yannick L’Horty, Florent Sari
10-4. Do Public Subsidies Have an Impact on New Firm Survival? An Empirical Study with French Data
Lionel Désiage, Richard Duhautois, Dominique Redor
10-5. The effect of social security payroll tax reductions on employment and wages: an evaluation of the 2003 French reform
Matthieu Bunel, Fabrice Gilles, Yannick L’Horty
10-6. What are Entrepreneurs’ Objectives When Starting a New Business?
Lionel Désiage
10-7. Health and Early Retirement: Evidence from French Data for individuals
Thomas Barnay, Karine Briard
10-8. Ageing, chronic conditions and the evolution of future drugs expenditures
Thomas Barnay, Sophie Thiébaut, Bruno Ventelou
10-9. Entrepreneurial motives and performance: Why might better educated entrepreneurs be less successful?
Arnab Bhattacharjee, Jean Bonnet, Nicolas Le Pape, Régis Renault
10-10. Returns to firm-provided training in France: Evidence on mobility and wages
Arnaud Chéron, Bénédicte Rouland, François-Charles Wolff
10-11. Taxation of early retirement windows and delaying retirement: the French experience
10-12. Pre Entry Motives into Entrepreneurship and Post Entry Entrepreneurial Orientation
Jean Bonnet, Nicolas Le Pape
10-13. Hiring Practices, Employment Protection and Temporary Jobs
Anne Bucher
10-14. Young-in Old-out: a new evaluation
Michela Bia, Pierre-Jean Messe, Roberto Leombruni
10-15. On the impact of the TFP growth on the employment rate: does training on-the-job matter?
Eva Moreno-Galbis
10-16. The dynamics of youth labor market integration
Anne Bucher
10-17. Fostering the potential endogenous development of European regions: a spatial dynamic panel data analysis of the Cohesion Policy on regional convergence over the period 1980-2005
Salima Bouayad-Agha, Nadine Turpin, Lionel Védrine
10-18. Cost-saving or Cost-enhancing Mergers: the Impact of the Distribution of Roles in Oligopoly
Nicolas Le Pape, Kai Zhao
10-19. Bankruptcy Risk, Product Market Competition and Horizontal Mergers
Bernard Franck, Nicolas Le Pape
10-20. Endogenous Job Destructions and the Distribution of Wages
Arnaud Chéron, Bénédicte Rouland
10-21. Employment Protection Legislation and Adverse Selection at the Labor Market Entry
The TEPP Institute
The CNRS Institute for Labor Studies and Public Policies (the TEPP Institute, FR n°3126 CNRS) gathers together research centres specializing in economics and sociology:
• the Centre d'Etudes de l'Emploi (Centre for Employment Studies), CEE, Public Administrative Organization, under the leadership of the Ministers of Work and Research
• l'Equipe de Recherche sur les Marchés, l'Emploi et la Simulation (Research Team on Markets, Employment and Simulation), ERMES, University of Paris II Panthéon-Assas
• the Centre d'Etudes des Politiques Economiques de l'université d'Evry (Research Centre focused on the analysis of economic policy and its foundations and implications), EPEE, University of Evry Val d’Essonne
• the Centre Pierre Naville (Research on Work and Urban Policies), CPN, University of Evry Val d’Essonne
• l'Equipe de Recherche sur l'Utilisation des Données Temporelles en Economie (Research Team on Use of Time Data in Economics), ERUDITE, University of Paris-Est Créteil and University of Paris-Paris-Est Marne-la-Vallée
• the Groupe d'Analyse des Itinéraires et des Niveaux Salariaux (The Group on Analysis of Wage Levels and Trajectories), GAINS, University of the Maine
The TEPP Institute brings together 115 researchers and research professors, 140 PhD students and 40 associate researchers who study changes in work and employment in relation to the choices made by firms and analyse public policies using new evaluation methods.