HAL Id: hal-00302006
https://hal.archives-ouvertes.fr/hal-00302006
Submitted on 24 Jul 2006HAL is a multi-disciplinary open access
archive for the deposit and dissemination of sci-entific research documents, whether they are pub-lished or not. The documents may come from teaching and research institutions in France or abroad, or from public or private research centers.
L’archive ouverte pluridisciplinaire HAL, est destinée au dépôt et à la diffusion de documents scientifiques de niveau recherche, publiés ou non, émanant des établissements d’enseignement et de recherche français ou étrangers, des laboratoires publics ou privés.
On the time-averaging of ultrafine particle number size
spectra in vehicular plumes
X. Yao, N. T. Lau, M. Fang, C. K. Chan
To cite this version:
X. Yao, N. T. Lau, M. Fang, C. K. Chan. On the time-averaging of ultrafine particle number size spectra in vehicular plumes. Atmospheric Chemistry and Physics Discussions, European Geosciences Union, 2006, 6 (4), pp.6825-6839. �hal-00302006�
ACPD
6, 6825–6839, 2006
Time-averaging of ultrafine particle number size spectra
X. Yao et al. Title Page Abstract Introduction Conclusions References Tables Figures J I J I Back Close
Full Screen / Esc
Printer-friendly Version Interactive Discussion
EGU
Atmos. Chem. Phys. Discuss., 6, 6825–6839, 2006 www.atmos-chem-phys-discuss.net/6/6825/2006/ © Author(s) 2006. This work is licensed
under a Creative Commons License.
Atmospheric Chemistry and Physics Discussions
On the time-averaging of ultrafine particle
number size spectra in vehicular plumes
X. Yao1, N. T. Lau1, M. Fang1, and C. K. Chan2
1
Institute for the Environment, Hong Kong University of Science and Technology, Clear Water Bay, Hong Kong, PRC
2
Department of Chemical Engineering, Hong Kong University of Science and Technology, Clear Water Bay, Hong Kong, PRC
Received: 17 May 2006 – Accepted: 14 July 2006 – Published: 24 July 2006 Correspondence to: M. Fang (fangming@ust.hk)
ACPD
6, 6825–6839, 2006
Time-averaging of ultrafine particle number size spectra
X. Yao et al. Title Page Abstract Introduction Conclusions References Tables Figures J I J I Back Close
Full Screen / Esc
Printer-friendly Version Interactive Discussion
EGU
Abstract
Ultrafine particle (<100 nm) number size distributions presented in the literature are mostly averages of long scan-time (∼30 s or more) spectra mainly due to the non-availability of commercial instruments that can measure particle distributions in the <10 nm to 100 nm range faster than 30 s even though individual researchers have built 5
faster (1–2.5 s) scanning instruments. With the introduction of the Engine Exhaust Par-ticle Sizer (EEPS) in 2004, high time-resolution (1 full 32-channel spectrum per second) particle size distribution data become possible and allow atmospheric researchers to study the characteristics of ultrafine particles in rapidly and perhaps randomly varying high concentration environments such as roadside, on-road and tunnel. In this study, 10
particle size distributions in these environments were found to vary as rapidly as one second frequently. This poses the question on the generality of using averages of long scan-time spectra for dynamic and/or mechanistic studies in rapidly and perhaps randomly varying high concentration environments. One-second EEPS data taken at roadside, on roads and in tunnels by a mobile platform are time-averaged to yield 5, 15
10, 30 and 120 s distributions to answer this question.
1 Introduction
Size distributions of on-road ultrafine (<100 nm) particle number concentrations are im-portant to the study of particle formation and evolution processes, and they can be used as signatures for source identification (Zhu et al., 2002a, b; Bukowiecki et al., 2003; 20
Gidhagen et al., 2003; Jacobson and Seinfeld, 2004; Vouitsis et al., 2005; Morawska et al., 2006). Averages of long scan-time (∼30 s or more) spectra are usually reported in the literature (Wang and Flagan 1989; Bukowiecki et al., 2002a, b, 2003; Moln ´ar et al., 2002; Zhu et al., 2002a, b; Gidhagen et al., 2003; Sturm et al., 2003; Kittelson et al., 2004; Burtscher, 2005; Desantes et al., 2005; Gramotnev and Gramotnev, 2005; 25
ACPD
6, 6825–6839, 2006
Time-averaging of ultrafine particle number size spectra
X. Yao et al. Title Page Abstract Introduction Conclusions References Tables Figures J I J I Back Close
Full Screen / Esc
Printer-friendly Version Interactive Discussion
EGU
developed to explain the formation and evolution processes of these particles (Kim et al., 2002; Gidhagen et al., 2003; Jacobson and Seinfeld, 2004; Vouitsis et al., 2005).
Commercially available ultrafine particle sizers such as Scanning Mobility Particle Sizer (SMPS) take as long as 30 s to yield a full 3–560 nm particle size spectrum al-though individual researchers have custom-improved the scanning speed of SMPS to 5
1–2.5 s (Wang et al., 2002; Shah and Cocker, 2002). Faster scanning speed data are deemed to be more favorable for mechanistic studies. However, none of these fast in-struments are commercially available, and most of the literature reports are still based on 30-s SMPS spectra. Upon the introduction of the Engine Exhaust Particle Sizer (EEPS, TSI, Inc.) in 2004, size (5.6–560 nm) distribution measurements as fast as 32-10
channel per second can be obtained (Johnson et al., 2004; Jacobson et al., 2005; Yao et al., 2005), and the results showed that particle number concentration frequently var-ied at least as rapidly as 1 s in concentrated particle environments such as roadside, on roads and in tunnels. This poses the question on the generality of using averages of long scan-time spectra for dynamic and/or mechanistic studies in rapidly and perhaps 15
randomly varying high concentration environments. Conceivably, in slow or relatively non-varying environments, time-averaging of particle size distributions for mechanistic studies would not a problem.
In this study, ultrafine particle number size distributions obtained from time-averaging (5, 10, 30 and 120 s) 1-sec data as measured by EEPS are compared to the original 20
dataset and the implication of numerically averaging these rapidly changing data are discussed.
2 Experimental
The Mobile Real-time Air Monitoring Platform (MAP) has been used since 2002 to ob-tain temporal and spatial size distributions of ultrafine particles as it traveled or parked 25
at roadsides as a stationary station to obtain time-series air pollutant data. Detail spec-ifications of MAP are reported in Yao et al. (2005). There are two state-of-art fast
ACPD
6, 6825–6839, 2006
Time-averaging of ultrafine particle number size spectra
X. Yao et al. Title Page Abstract Introduction Conclusions References Tables Figures J I J I Back Close
Full Screen / Esc
Printer-friendly Version Interactive Discussion
EGU
response particle counters onboard: Engine Exhaust Particle Sizer (5.6–560 nm, 1 s per 32-cut scan), Electrical Low Pressure Impactor (ELPI, 12 cuts ranging 0.03–20 µm at a scan rate of 1 s) (Dekati, Ltd.). Stand-alone gas analyzers for SO2, NOx, CO and O3(API, Inc., response time from 10 s to 20 s) and an aethalometer (Magee Scientific, response time is 5 s) for black carbon (BC) yield real-time data for these species. A 5
composite global positioning system (GPS)/digital compass/speedometer navigation system and an automatic weather station are also used. MAP has a forward-pointing isokinetic, unidirectional sampling probe for taking aerosol samples at a vehicle speed of 50–70 km hr−1. The nominal vehicle speed is 60 km hr−1. It can be deployed as a conventional stationary monitoring facility with an omni-directional PM10 inlet (R&P, 10
Corporation). The probe is on the top of the front of the vehicle and is ∼4 m above ground level. The exhaust is at the tail end of the vehicle, a distance of ∼2 m from the probe in horizontal direction. In the normal driving mode, any self-contamination is thus circumvented. Depending of the distance between MAP and the vehicles ahead, the samples can either be localized plumes directly from the vehicles in front or a dispersed 15
mixture.
On 23 and 27–28 September and 7–8, 11–14 October 2004, ∼50 h of air pollutant measurements were made and, in particular, ultrafine particle number concentrations using EEPS. The measurements started daily at 10:00 and ended at 16:00. The data taken on 7 and 8 October are analyzed and used in this discussion as examples to 20
demonstrate some of the problems associated with time-averaging ultrafine particles for size distribution studies.
3 Results and discussion
In the afternoon of 7 October 2004, MAP was parked on the roadside to collect high time resolution ultrafine particle data. In Figs. 1a–e are the concentrations (all con-25
centrations are number concentrations unless otherwise specified) of the 10.8, 19.1, 29.4 and 52.3 nm particles and particle size distributions as measured by EEPS for
ACPD
6, 6825–6839, 2006
Time-averaging of ultrafine particle number size spectra
X. Yao et al. Title Page Abstract Introduction Conclusions References Tables Figures J I J I Back Close
Full Screen / Esc
Printer-friendly Version Interactive Discussion
EGU
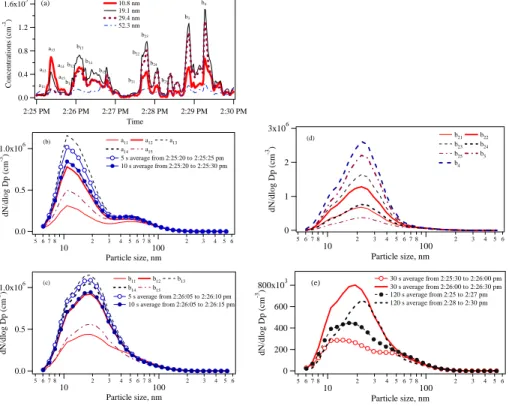
a period of five minutes. No gaseous pollutant data were measured. The traffic was light (<100 vehicles per hour). Several peaks can be seen in the particle concentration (Fig. 1a); they were plumes from vehicles passing by MAP. For these peaks, there are two types of bi-modal distributions: one characterized by the dominant ∼10 nm mode and a minor ∼50 nm mode, and the other by the dominant mode at ∼20 nm and a minor 5
∼10 nm mode (Figs. 1b–d). Time-averaging these size distribution data for relatively short times (5 and 10 s) yielded distributions that are similar to the original 1 s distribu-tions, however, for relatively long times (30 and 120 s), the resulting distributions can sometimes be distorted and tri-modal size distributions are obtained (Fig. 1e).
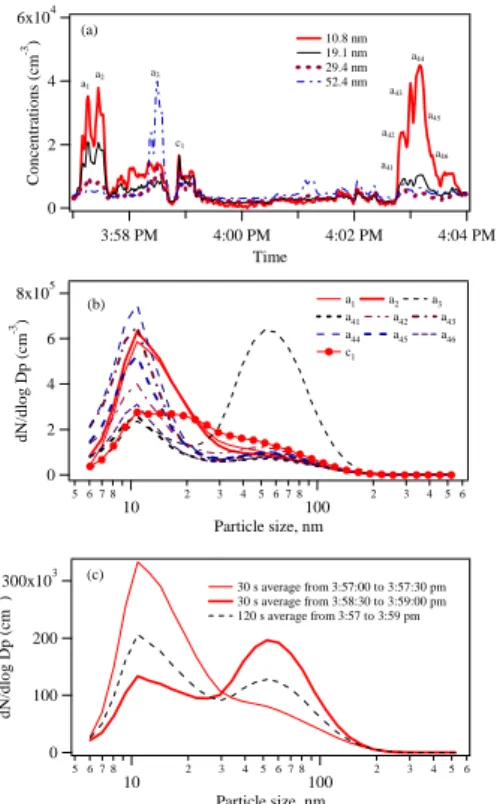
In the case when only one type of size distribution dominated such as the light traffic 10
roadside data in Figs. 2a–c, there is no significant change of the particle mode number and diameter between the original and time-averaged distributions.
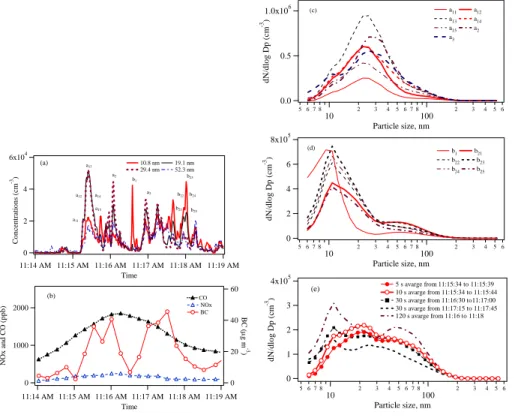
For on-road data (Figs. 3a–e), particle concentration peaks exist (Fig. 3a) and they were due to plumes from either the vehicles ahead of MAP and/or the vehicles pass-ing by in the opposite lane. The particle peaks a11−a15, a2 and a3 coincided with the 15
black carbon (BC) peaks (Fig. 3b) suggesting that they were probably due to emis-sions from heavy-duty diesel vehicles. On the other hand, low BC concentrations were detected at b1 and b21−b−25, suggesting emissions from light-duty vehicles such as gasoline-powered cars. Due to longer instrument response times (∼20 s), CO and NOx concentrations are less sensitive than the particle and BC concentration changes. 20
In Figs. 3c–d, at a11−a−15, a2 and a3, bi-modal particle size distributions with a dominant mode at ∼20 nm and a minor mode at ∼10 nm are detected. A different bi-modal distribution is observed at b1and b21−b25with a dominant mode at ∼10 nm and a minor mode at ∼50 nm. This difference in the size distribution is attributed to the different evolution of particles in the respective vehicle plumes, including the growth of 25
nucleated particle by gas-condensation and particle-particle coagulation (Jacobson et al., 2005; Yao et al., 2005).
Time-averaging (5, 10, 30 and 120 s) the bi-modal distributions resulted in tri-modal patterns with ∼10, ∼20 and ∼50 nm modes or bi-modal distributions with modes at
ACPD
6, 6825–6839, 2006
Time-averaging of ultrafine particle number size spectra
X. Yao et al. Title Page Abstract Introduction Conclusions References Tables Figures J I J I Back Close
Full Screen / Esc
Printer-friendly Version Interactive Discussion
EGU
∼20 and ∼50 nm (Fig. 3e). What happened is particle size distributions from different sources measured at different times are numerically mixed, and, in particular, the 50 nm mode is significantly enhanced. In the literature, these time-averaged size distributions are often times attributed to particle evolutions and/or to engine operating conditions (Zhu et al., 2002ab; Bukowiecki et al, 2003; Gidhagen et al, 2003; Ketzel et al, 2003; 5
Sturm et al, 2003; Morawska et al, 2006). It becomes obvious that numerically mixing physically meaningful particle modes from different sources would not and should not link them in evolutionary interpretations.
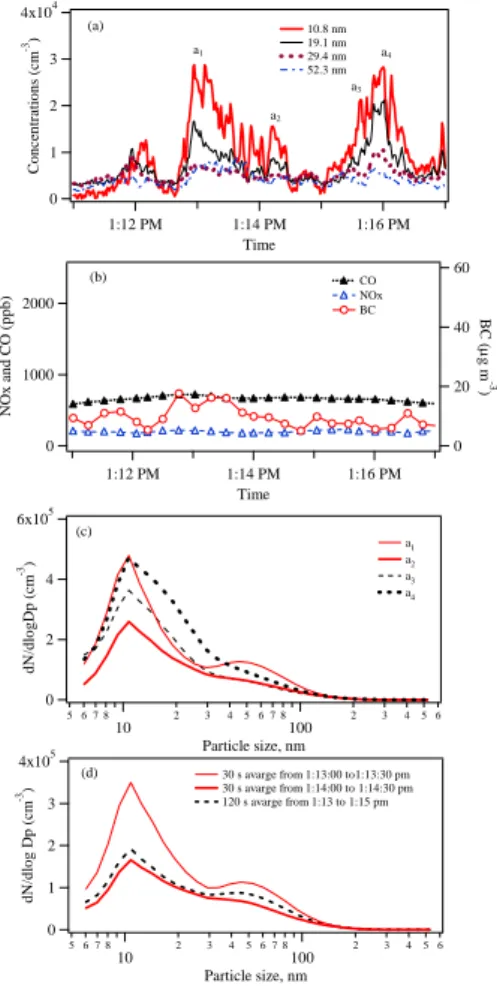
Similar gas and particle data measured for a period of 6 min by MAP traveling on roads on 8 October are in Figs. 4a–d. In this dataset, only one particle size distribution 10
dominated: a bi-modal pattern with a dominant mode at ∼10 nm and a minor mode at ∼50 nm. Time-averaged (30 s and 120 s) particle size distributions (Figs. 4c and d) are similar to the original size distribution (1 s) and no significant difference on the particle mode number and diameter is detected.
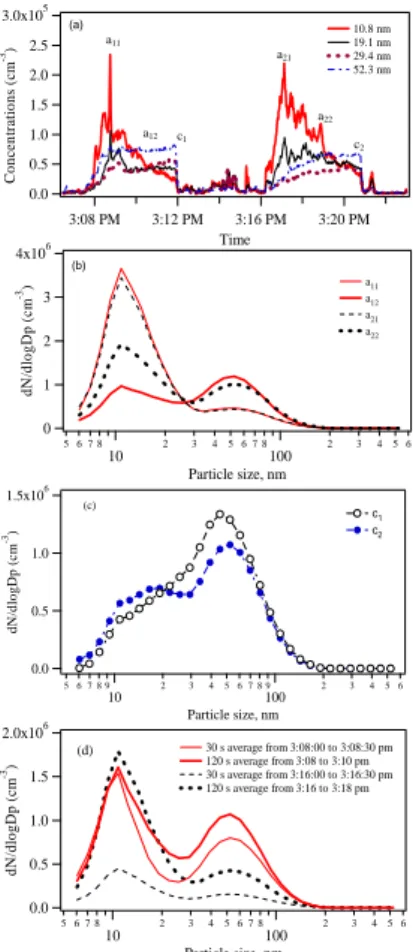
Additional MAP EEPS data collected inside tunnels where particles from multiple 15
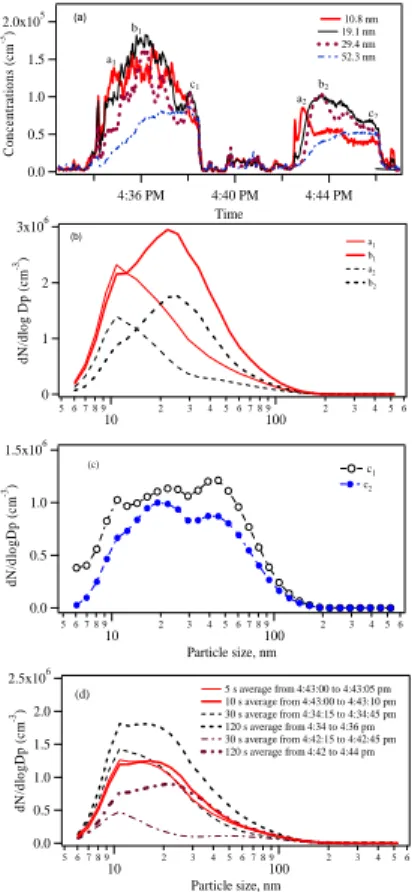
sources with much higher concentrations are in Figs. 5 and 6 to further substantiate this discussion. When only one particle size distribution dominated, time-averaged (30 s and 120 s) particle size distributions (Fig. 5d) are similar to the original size distribution (1 s). When size distribution varies rapidly (in seconds), time-averaged (5, 10, 30 s and 120 s) particle size distributions display distortions (Fig. 6d) due to the numerical 20
mixing of particles from two types of sources.
What has been demonstrated is time-averaging (5–120 s) 1-sec size distribution data of two different types of particle size distributions can numerically yield a large variety of complicated size distributions, depending on the relative strengths of the respec-tive sources, and in particular, tri-modal size distributions can be obtained. By the 25
same token, a fast particle sizer could also measure particle size distributions that are physically mixed. In Figs. 5b and 6b, in the mid-section of the tunnel when only one dominant mode exists, tri-modal distribution is not detected due to the overwhelmingly high concentrations of the smaller particles (∼10 nm). At the end section when no one
ACPD
6, 6825–6839, 2006
Time-averaging of ultrafine particle number size spectra
X. Yao et al. Title Page Abstract Introduction Conclusions References Tables Figures J I J I Back Close
Full Screen / Esc
Printer-friendly Version Interactive Discussion
EGU
mode dominates, tri-modal particle size distributions (1 s) are measured in Figs. 5c and 6c. It is possible that these tri-modal size distributions are due to physically mixing particles from different sources and not a true tri-modal distribution from a particular source. Tri-modal distributions were occasionally detected in well-dispersed vehicle plumes outside tunnels as shown in Fig. 2b.
5
4 Summary and conclusion
High time resolution ultrafine particle concentration data in vehicular plumes at road-side, on roads and in tunnels show that they can vary rapidly in the second scale. Time-averaging of particle size distributions collected in such environments can yield misleading and/or meaningless evolutionary interpretations in that the time-averaged 10
spectra can be vastly different from the real ones. In this case, time-averaging amounts to numerically mixing particles from different sources. However, in a slow varying at-mosphere, time-averaging may still be justified. To be fair, fast sizers can also measure physically mixed particles.
Acknowledgements. This project is sponsored by the Hong Kong Jockey Club Charities Fund
15
for which the team is grateful. TSI, Inc., USA generously loaned the EEPS (Model 3090) to the team without which this study would not have been possible.
References
Biskos, G., Reavell, K., and Collings, N.: Description and theoretical analysis of a differential mobility spectrometer. Aerosol. Sci. Technol., 39, 527–541, 2005. Bukowiecki, N., Kittelson,
20
D. B., Watts, W. F., Burtsher, H., Weingartner, E., and Baltensperger, U.: Real-time charac-terization of ultrafine and accumulation mode particles in ambient combustion aerosols, J. Aerosol Sci., 33, 1139–1154, 2002a.
Bukowiecki, N., Dommen, J., Pr ´ev ˆot, A. S. H., Richter, R., Weingartner, E., and Baltensperger, U.: A mobile pollutant measurement laboratory-measuring gas phase and aerosol ambient
ACPD
6, 6825–6839, 2006
Time-averaging of ultrafine particle number size spectra
X. Yao et al. Title Page Abstract Introduction Conclusions References Tables Figures J I J I Back Close
Full Screen / Esc
Printer-friendly Version Interactive Discussion
EGU
concentrations with high spatial and temporal resolution, Atmos. Environ., 36, 5569–5579, 2002b.
Bukowiecki, N., Dommen, J., Pr ´ev ˆot, A. S. H., Richter, R., Weingartner, E., and Baltensperger, U.: Fine and ultrafine particles in the Z ¨urich (Switzerland) area measured with a mobile laboratory: an assessment of the seasonal and regional through a year, Atmos. Chem. Phys.,
5
3, 1477–1494, 2003.
Burtscher, H.: Physical characterization of particulate emissions from diesel engines: a review, J. Aerosol Sci., 36, 896–932, 2005.
Desantes, J. M., Berm ´udez, V., Garc´ıa, J. M., and Fuentes, E.: Effects of current engine
strate-gies on the exhaust aerosol particle size distribution from a heavy-duty diesel engine, J.
10
Aerosol Sci., 36, 1251–1276, 2005.
Gidhagen, L., Johansson, C., Str ¨om, J., Kristensson, A., Swietlicki, E., Pirjola, L., and Hansson, H. C.: Model simulation of ultrafine particles inside a road tunnel, Atmos. Environ., 37, 2023– 2036, 2003.
Gramotnev, D. K. and Gramotnev, G. A.: New mechanism of aerosol evolution near a busy
15
road: fragmentation of nanoparticles, J. Aerosol Sci., 36, 323–340, 2005.
Jacobson, M. K. and Seinfeld, J. H.: Evolution of nanoparticle size and mixing state near the point of emission, Atmos. Environ., 38, 1839–1850, 2004.
Jacobson, M. Z., Kittelson, D. B., and Watts, W. F.: Enhanced coagulation due to evaporation
and its effect on nanoparticle evolution, Environ. Sci. Technol., 39, 9486–9492, 2005.
20
Johnson, T., Caldow, R., Pocher, A., Mirme, A., and Kittelson, D. B.: A new electrical mobility particle sizer spectrometer for engine exhaust particle measurements, SAE-2004-01-1341, 2004.
Ketzel, M., W ˚ahlin, P., Berkowicz, R., and Palmgren, F.: Particle and trace gas emission factors under urban driving conditions in Copenhagen based on street and roof-level observations,
25
Atmos. Environ., 37, 2735–2749, 2003.
Kim, D., Gautam, M., and Gera, D.: Parametric studies on the formation of diesel particulate matter via nucleation and coagulation modes, J. Aerosol Sci., 33, 1609–1621, 2002.
Kittelson, D. B., Watts, W. F., and Johnson, J. P.: Nanoparticle emissions on Minnesota high-ways, Atmos. Environ., 38, 9–19, 2004.
30
Kuhn, T., Krudysz, M., Zhu, Y., Fine, P. M., Hinds, W. C., Froines, J., and Sioutas, C.: Volatility of indoor and outdoor ultrafine particulate matter near a freeway, J. Aerosol Sci., 36, 291–302, 2005.
ACPD
6, 6825–6839, 2006
Time-averaging of ultrafine particle number size spectra
X. Yao et al. Title Page Abstract Introduction Conclusions References Tables Figures J I J I Back Close
Full Screen / Esc
Printer-friendly Version Interactive Discussion
EGU
Moln ´ar, P., Janh ¨all, S., and Hallquist, M.: Roadside measurements of fine and ultrafine particles at a major road north of Gothenburg, Atmos. Environ., 36, 4115–4123, 2002.
Morawska, L., Johnson, G. R., He, C., Ayoko, G. A., Lim, M. C. H., Swanson, C., Ristovski, Z. D., and Moore, M.: Particle number emissions and source signatures of an Industrial Facility, Environ. Sci. Technol., 40, 803–814, 2006.
5
Shah, S. D. and Cocker, D. R.: A fast scanning mobility particle spectrometer for monitoring transient particle size distributions, Aerosol Sci. Technol., 39, 519–526, 2005.
Sturm, P. J., Baltensperger, U., Bacher, M., Lechner, B. Hausberger, S., Heiden, B., Imhof, D., Weingartner, E., Prevot, A. S. H., Kurtenbach, R., and Wiesen, P.: Roadside measurements of particulate matter size distribution, Atmos. Environ., 37, 5273–5281, 2003.
10
Vouitsis, E., Ntziachristos, L., and Samaras, Z.: Modelling of diesel exhaust aerosol during laboratory sampling, Atmos. Environ., 39, 1335–1345, 2005.
Wang, J., McNeill, V. F., Collins, D. R., and Flagan, R. C.: Fast mixing condensation nucleus
counter: application to rapid scanning differential mobility analyzer measurements, Aero. Sci.
Technol., 36, 678–689, 2002.
15
Wang, S. C. and Flagan, R. C.: Scanning electrical mobility spectrometer, J. Aerosol Sci., 20, 1485–1488, 1989.
Yao, X. H., Lau, N. T., Fang, M., and Chan, C. K.: Real-time observation of the transformation of ultrafine atmospheric particle modes, Aerosol Sci. Technol., 39, 831–841, 2005.
Zhu, Y., Hinds, W. C., Kim, S., Shen, S., and Sioutas, C.: Study of ultrafine particles near a
20
major highway with heavy-duty diesel traffic, Atmos. Environ., 36, 4323–4335, 2002a. Zhu, Y., Hinds, W. C., Kim, S., and Sioutas, C.: Concentration and size distributions of ultrafine
ACPD
6, 6825–6839, 2006
Time-averaging of ultrafine particle number size spectra
X. Yao et al. Title Page Abstract Introduction Conclusions References Tables Figures J I J I Back Close
Full Screen / Esc
Printer-friendly Version Interactive Discussion EGU 1.0x10⁶ 0.5 0.0 dN /dl og D p (c m -3) 5 6 7 8 10 2 3 4 5 6 7 8 100 2 3 4 5 6 Particle size, nm b11 b12 b13 b14 b15 5 s average from 2:26:05 to 2:26:10 pm 10 s average from 2:26:05 to 2:26:15 pm (c) 1.0x10⁶ 0.5 0.0 dN /d log D p (cm -3) 5 6 7 8 10 2 3 4 5 6 7 8 100 2 3 4 5 6 Particle size, nm (b) a11 a12 a13 a14 a15 5 s average from 2:25:20 to 2:25:25 pm 10 s average from 2:25:20 to 2:25:30 pm 1.6x10⁵ 1.2 0.8 0.4 0.0 Conc e nt ra ti ons (c m -3) 2:25 PM 2:26 PM 2:27 PM 2:28 PM 2:29 PM 2:30 PM Time (a) 10.8 nm 19.1 nm 29.4 nm 52.3 nm a11 a12 a13 a14 b13 b11 a15 b12 b14 b15 b21 b22 b23 b24 b25 b3 b4 3x10⁶ 2 1 0 dN /dl og D p (c m -3 ) 5 6 7 8 10 2 3 4 5 6 7 8100 2 3 4 5 6 Particle size, nm b21 b22 b23 b24 b25 b3 b4 (d) 800x103 600 400 200 0 dN /d log D p (cm -3) 5 6 7 8 10 2 3 4 5 6 7 8 100 2 3 4 5 6 Particle size, nm
(e) 30 s average from 2:25:30 to 2:26:00 pm
30 s average from 2:26:00 to 2:26:30 pm 120 s average from 2:25 to 2:27 pm 120 s average from 2:28 to 2:30 pm
Fig. 1. Light traffic roadside ultrafine particle concentrations and size distributions, 02:30 p.m.,
7 October 2004. (a) Concentrations of 10.8, 19.1, 29.4 and 52.3 nm particles, (b) Size
distri-butions and 5 s and 10 s time-averaged spectra at a11–a15,(c) Size distributions and 5 s and
10 s time-averaged spectra at b11–b15,(d) Size distributions at b21–a25, b3−4,(e) 30 s and 120 s
time-averaged spectra. Note: a1n are bi-modal size distributions at ∼10 nm and ∼50 nm, bm
and bmnare bi-modal size distributions at ∼10 nm and ∼20 nm; the subscripts reflect different
ACPD
6, 6825–6839, 2006
Time-averaging of ultrafine particle number size spectra
X. Yao et al. Title Page Abstract Introduction Conclusions References Tables Figures J I J I Back Close
Full Screen / Esc
Printer-friendly Version Interactive Discussion EGU 6x10⁴ 4 2 0 C once n tr at ions (cm -3) 3:58 PM 4:00 PM 4:02 PM 4:04 PM Time (a) 10.8 nm 19.1 nm 29.4 nm 52.4 nm 8x10⁵ 6 4 2 0 dN/ d log D p (cm -3) 5 6 7 8 10 2 3 4 5 6 7 8 100 2 3 4 5 6 Particle size, nm a1 a2 a3 a41 a42 a43 a44 a45 a46 c1 300x103 200 100 0 dN /d log D p (cm -3) 5 6 7 8 10 2 3 4 5 6 7 8 100 2 3 4 5 6 Particle size, nm 30 s average from 3:57:00 to 3:57:30 pm 30 s average from 3:58:30 to 3:59:00 pm 120 s average from 3:57 to 3:59 pm (c) a3 c1 a1 a44 a43 a45 a42 a46 a2 a41 (b)
Fig. 2. Light traffic roadside ultrafine particle concentrations and size distributions, ∼04:00 p.m/
on 7 October 2004. (a) Concentrations of 10.8, 19.1, 29.4 and 52.3 nm particles, (b) Size
distributions at a1, a2, a3, a41,a42, a43, a44,a45, a46 and c1, (c) 30 s and 120 s time-averaging
spectra. Note: am and amn are bi-modal size distributions at ∼10 nm and ∼50 nm, c1 is a
ACPD
6, 6825–6839, 2006
Time-averaging of ultrafine particle number size spectra
X. Yao et al. Title Page Abstract Introduction Conclusions References Tables Figures J I J I Back Close
Full Screen / Esc
Printer-friendly Version Interactive Discussion EGU 6x10⁴ 4 2 0 C o n cen tratio n s (cm -3) 11:14 AM 11:15 AM 11:16 AM 11:17 AM 11:18 AM 11:19 AM Time 10.8 nm 19.1 nm 29.4 nm 52.3 nm (a) 2000 1000 0 N O x a nd C O (ppb) 11:14 AM 11:15 AM 11:16 AM 11:17 AM 11:18 AM 11:19 AM Time 60 40 20 0 BC ( μ g m -3 ) CO NOx BC (b) a13 b23 b1 a11 b22 b24 a15 a12 a14 a2 b25 b21 a3 1.0x10⁶ 0.5 0.0 dN /dl og D p (c m -3) 5 6 7 8 10 2 3 4 5 6 7 8 100 2 3 4 5 6 Particle size, nm (c) a11 a12 a13 a14 a15 a2 a3 8x10⁵ 6 4 2 0 dN /d log D p (cm -3) 5 6 7 8 10 2 3 4 5 6 7 8 100 2 3 4 5 6 Particle size, nm (d) b 1 b21 b22 b23 b24 b25 4x10⁵ 3 2 1 0 dN /dl og D p (c m -3) 5 6 7 8 10 2 3 4 5 6 7 8 100 2 3 4 5 6 Particle size, nm
(e) 5 s avarge from 11:15:34 to 11:15:39 10 s avarge from 11:15:34 to 11:15:44
30 s avarge from 11:16:30 to11:17:00 30 s avarge from 11:17:15 to 11:17:45 120 s avarge from 11:16 to 11:18
Fig. 3. On road ultrafine particle concentrations and size distributions, 7 October 2004. (a)
Concentrations of 10.8, 19.1, 29.4 and 52.3 nm particles, (b) CO (ppb), NOx (ppb) and BC
(µg m−3), (c) Size distributions at a11–a15, a2and a3,(d) Size distributions at b1, b21–b25,(e)
5 s, 10 s, 30 s and 120 s time-averaging spectra. Note: a1nand anare bi-modal size distributions
at ∼10 nm and ∼20 nm; bnand bmnare bi-modal size distributions at ∼10 nm and ∼50 nm; the
ACPD
6, 6825–6839, 2006
Time-averaging of ultrafine particle number size spectra
X. Yao et al. Title Page Abstract Introduction Conclusions References Tables Figures J I J I Back Close
Full Screen / Esc
Printer-friendly Version Interactive Discussion EGU 2000 1000 0 N O x and C O (ppb) 1:12 PM 1:14 PM 1:16 PM Time 60 40 20 0 BC (μ g m -3 ) CO NOx BC (b) 4x10⁴ 3 2 1 0 C once n trat ions (c m -3) 1:12 PM 1:14 PM 1:16 PM Time (a) 10.8 nm 19.1 nm 29.4 nm 52.3 nm 6x10⁵ 4 2 0 d N /d lo g D p ( cm -3) 5 6 7 8 10 2 3 4 5 6 7 8100 2 3 4 5 6 Particle size, nm (c) a 1 a2 a3 a4 4x10⁵ 3 2 1 0 dN /d log D p (cm -3) 5 6 7 8 10 2 3 4 5 6 7 8100 2 3 45 6 Particle size, nm
30 s avarge from 1:13:00 to1:13:30 pm 30 s avarge from 1:14:00 to 1:14:30 pm 120 s avarge from 1:13 to 1:15 pm (d) a1 a2 a3 a4
Fig. 4. On road ultrafine particle number concentrations and size distributions, 8 October 2004. (a) Concentrations of 10.8, 19.1, 29.4 and 52.3 nm particles, (b) CO (ppb), NOx (ppb) and BC
(µg m−3),(c) Size distributions at a1, a2, a3and a4,(d) 30 s and 120 s time-averaging spectra.
Note: an are bi-modal size distributions at ∼10 nm and ∼50 nm and the subscripts reflects
ACPD
6, 6825–6839, 2006
Time-averaging of ultrafine particle number size spectra
X. Yao et al. Title Page Abstract Introduction Conclusions References Tables Figures J I J I Back Close
Full Screen / Esc
Printer-friendly Version Interactive Discussion EGU 4x10⁶ 3 2 1 0 dN/ dl ogDp ( cm -3) 5 6 7 8 10 2 3 45 6 7 8 100 2 3 45 6 Particle size, nm (b) a11 a12 a 21 a22 3.0x10⁵ 2.5 2.0 1.5 1.0 0.5 0.0 C o n ce n tr at io n s ( cm -3) 3:08 PM 3:12 PM 3:16 PM 3:20 PM Time 10.8 nm 19.1 nm 29.4 nm 52.3 nm (a) 1.5x10⁶ 1.0 0.5 0.0 dN/ dl o g Dp ( cm -3) 5 6 7 8 9 10 2 3 4 5 6 7 8 9100 2 3 45 6 Particle size, nm (c) c1 c2 2.0x10⁶ 1.5 1.0 0.5 0.0 dN/ d lo gDp ( cm -3) 5 6 7 8 10 2 3 45 6 7 8 100 2 3 45 6 Particle size, nm 30 s average from 3:08:00 to 3:08:30 pm 120 s average from 3:08 to 3:10 pm 30 s average from 3:16:00 to 3:16:30 pm 120 s average from 3:16 to 3:18 pm (d) a11 a12 c1 a21 a22 c2
Fig. 5. Ultrafine particle number concentrations and size distributions in Tate Cairn’s Tunnel, 7
October 2004. Concentrations of(a) 10.8, 19.1, 29.4 and 52.3 nm particles, (b) Size
distribu-tions at a11, a12, a21and a22,(c) Size distribution at c1, c2,(d) 30 s and 120 s time-averaging
spectra. Note: amnare bi-modal size distributions at ∼10 nm and ∼50 nm; cnare tri-modal size
ACPD
6, 6825–6839, 2006
Time-averaging of ultrafine particle number size spectra
X. Yao et al. Title Page Abstract Introduction Conclusions References Tables Figures J I J I Back Close
Full Screen / Esc
Printer-friendly Version Interactive Discussion EGU 2.0x10⁵ 1.5 1.0 0.5 0.0 Conc ent ra ti ons ( cm -3) 4:36 PM 4:40 PM 4:44 PM Time (a) 10.8 nm 19.1 nm 29.4 nm 52.3 nm 3x10⁶ 2 1 0 dN /dl og D p ( cm -3) 5 6 7 8 9 10 2 3 4 5 6 7 8 9100 2 3 4 5 6 a1 b1 a2 b2 (b) 1.5x10⁶ 1.0 0.5 0.0 d N /d lo g D p ( cm -3) 5 6 7 8 9 10 2 3 4 5 6 7 8 9100 2 3 4 5 6 Particle size, nm c1 c2 (c) 2.5x10⁶ 2.0 1.5 1.0 0.5 0.0 dN/ dl ogDp ( cm -3) 5 6 7 8 9 10 2 3 4 5 6 7 8 9100 2 3 4 5 6 Particle size, nm (d) 5 s average from 4:43:00 to 4:43:05 pm 10 s average from 4:43:00 to 4:43:10 pm 30 s average from 4:34:15 to 4:34:45 pm 120 s average from 4:34 to 4:36 pm 30 s average from 4:42:15 to 4:42:45 pm 120 s average from 4:42 to 4:44 pm a1 b1 c1 a2 b2 c2
Fig. 6. Ultrafine particle number concentrations and size distributions in Tseung Kwan O
Tun-nel, 7 October 2004. Concentrations of(a) 10.8, 19.1, 29.4 and 52.3 nm particles, (b) Size
distributions at a1, b1, c1, a2and b2and c2,(c) Size distributions at c1, c2,(d) 5 s, 10 s, 30 s and
120 s time-averaging spectra. Note: an are bi-modal size distributions at ∼10 nm and ∼50 nm;
bnare bi-modal size distributions at ∼10 nm and ∼20 nm; cnare tri-modal size distributions at