HAL Id: hal-01103150
https://hal.archives-ouvertes.fr/hal-01103150v2
Submitted on 14 Jan 2015
HAL is a multi-disciplinary open access
archive for the deposit and dissemination of
sci-entific research documents, whether they are
pub-lished or not. The documents may come from
teaching and research institutions in France or
abroad, or from public or private research centers.
L’archive ouverte pluridisciplinaire HAL, est
destinée au dépôt et à la diffusion de documents
scientifiques de niveau recherche, publiés ou non,
émanant des établissements d’enseignement et de
recherche français ou étrangers, des laboratoires
publics ou privés.
application to graph patterns
Sabeur Aridhi, Laurent d’Orazio, Mondher Maddouri, Engelbert Mephu
Nguifo, Sabeur Aridhi, Laurent Dorazio, Engelbert Mephu Nguifo
To cite this version:
Sabeur Aridhi, Laurent d’Orazio, Mondher Maddouri, Engelbert Mephu Nguifo, Sabeur Aridhi, et al..
Cost models for distributed pattern mining in the cloud: application to graph patterns. IEEE
Trust-com/BigDataSE/ISPA , Aug 2015, Helsinki, Finland. �10.1109/Trustcom.2015.569�. �hal-01103150v2�
application to graph patterns
Sabeur Aridhi∗ Laurent d’Orazio∗∗ Mondher Maddouri∗∗∗ Engelbert Mephu Nguifo∗∗
∗University of Trento, Italy
∗∗Blaise Pascal University, LIMOS, BP 10448, F-63000 Clermont-Ferrand, France.
{dorazio, mephu}@isima.fr
∗∗∗University of Tunis El Manar, LIPAH - FST, Academic Campus, Tunis 2092, Tunisia.
Abstract. Recently, distributed pattern mining approaches have become very popular, especially in certain domains such as bioinformatics, chemoinformatics and social networks. In most cases, the distribution of the pattern mining process generates a loss of information in the output results. Reducing this loss may affect the performance of the distributed approach and thus, the monetary cost when using cloud environments. In this context, cost models are needed to help selecting the best parameters of the used approach in order to achieve a better performance especially in the cloud. In this paper, we address the multi-criteria optimization problem of tuning thresholds related to distributed frequent pattern mining in cloud computing environment while optimizing the global monetary cost of storing and querying data in the cloud. To achieve this goal, we design cost models for managing and mining graph data with large scale pattern mining framework over a cloud architecture. We define four objective functions, with respect to the needs of customers. We present an experimental validation of the proposed cost models in the case of distributed subgraph mining in the cloud.
1
Introduction
Frequent pattern mining is one of the most important concepts in data mining, concerned with finding local structures in the data. It has become an important topic of research with numerous applications in several disciplines ranging from association rule mining Han and Pei (2000) and graph mining Suryawanshi and Kamalapur (2013), to image mining Melendez et al. (2011) and bioinformatics Maier et al. (2013). Generally, these fields exploit the extracted patterns for characterizing and classifying their associated data. For example, in graph mining, patterns are subgraphs extracted from a collection of graphs or a single large graph with a frequency no less than a user-specified support threshold. The discovered patterns are used lately to reveal interesting information hidden in the original data.
Nowadays, the amount of the available data has been exploding. Consequently, several distributed and cloud-based solutions have been proposed for distributed pattern mining from
large-scale data. However, the distribution of the pattern mining process generates a loss of information in the output results Aridhi et al. (2015); Riondato et al. (2012).
In Aridhi et al. (2015), a cloud-based approach for distributed frequent subgraph mining is presented. The output of the proposed approach is an approximation of the exact solution. In Riondato et al. (2012), PARMA, a parallel technique for mining frequent itemsets and associ-ation rules is proposed. The final result of PARMA is an approximassoci-ation of the exact solution since it mines random subsets of the input dataset. Reducing the loss generated by distributed pattern mining approaches may affect the performance of the distributed approach and thus, the monetary cost when using cloud environments. In this context, cost models are needed to help selecting the best parameters of distributed pattern mining approaches in order to achieve better performance especially in the cloud Kashef and Altmann (2012); Nguyen et al. (2012).
Several cost models have been developed for estimating costs of distributed data mining applications Ogunde et al. (2011); Nguyen et al. (2012). However, these approaches do not deal with distributed pattern mining. In addition, they do not incorporate an optimiser to be able to estimate the costs associated with the distributed pattern mining.
In this paper, we address the multi-criteria optimization problem of tuning thresholds re-lated to distributed frequent pattern mining in cloud computing environments while optimizing the global monetary cost of storing and querying data in the cloud. We propose cost models for managing and mining graph data with large scale pattern mining framework over a cloud architecture. We also define objective functions, with respect to the needs of cloud customers.
The contributions of this paper are as follows:
— We propose cost models for pattern mining over a cloud architecture. We focus on subgraph patterns.
— We define four objective functions, with respect to the needs of customers. These needs can be expressed by a financial budget limit, a response time limit or a mining quality limit.
— We validate experimentally the proposed cost models and the defined objective func-tions.
This paper is organized as follows. In the next section, we present the background infor-mation and the preliminary notions of our work. In Section 3, we describe our cost models for distributed pattern mining in the cloud. In Section 4, we present the optimization process and the objective functions. In Section 5, we describe our experimental study and we discuss the obtained results. Finally, in Section 6, we present an overview of some related works dealing with cost models for distributed pattern mining in the cloud.
2
Background
In this section, we present the background information related to pattern mining in the cloud. We first introduce a simple use case that serves as a running example throughout this paper. Then, we describe a typical pricing model in the cloud, illustrated by some of Windows Azure services and Amazon Web Services (AWS).
2.1
Running example
In order to illustrate our cost models, we rely on a frequent subgraph mining example. Con-sidering a graph dataset containing a set of community networks of a social network. Nodes of the graph represent people and edges represent interactions between them. Social network analysts need to examine the community networks patterns per day, month, and year. The anal-ysis consists of extraction of frequent subgraph patterns in community networks. It includes queries like “frequent subgraphs that occur in more than 30% of graphs in the database”. We suppose that our dataset contains ten million graphs and its size on disk is 100 GB. The query example consists of retrieving community networks patterns that occur in more than 30% of graphs in the database and of producing a query result of 10 GB.
2.2
Cloud pricing policies
Cloud Service Providers (CSPs) supply a variety of resources, such as hardware (CPU, storage, networks), development platforms and services with different services and pricing. In addition, they provide services that allow the design of MapReduce-based applications in the cloud such as HDInsight of Windows Azure and Amazon Elastic MapReduce of Amazon Web Services (AWS). In order to have an overview of CSPs pricing policy, the following examples present a simplified version of both HDInsight service offer Inc (2013b) and Amazon Elastic MapReduce (Amazon EMR) service offer Inc (2013a). The objective of this description is indeed not to compare the different providers, but to provide an idea about CSPs pricing offers. 2.2.1 HDInsight offer
HDInsight is a MapReduce service proposed by Windows Azure. It is based on Hadoop. A HDInsight environment consists of a head node, a gateway node and one or more compute nodes. The master node is charged $0.64 per hour and compute nodes are charged $0.32 per hour. The gateway node is free.
According to the HDInsight offer, the costs of five node hadoop cluster (one master node and four compute nodes), is $0.64 + $0.32 · 4 = $1.92 per hour.
We mention that the storage and the bandwidth consumption in HDInsight are billed ac-cording to the standard Windows Azure offer Inc (2013b). Bandwidth consumption is billed with respect to data volume (see Table 1).
TAB. 1: Windows Azure bandwidth prices (output data). Data volume Price per month First 5 GB per month free 5 GB-10 TB per month $0.12 per GB
40 TB per month $0.09 per GB 100 TB per month $0.07 per GB 350 TB per month $0.05 per GB
In this model, input data transfers are free, whereas output data transfer cost varies with respect to data volume, with an earned rate when volume increases. When applying this pricing
model onto our use case, the cost of bandwidth consumption (query result of 10 GB) is (10 − 5) · $0.12 = $0.60.
We mention that Windows Azure Storage provides storage of non-relational data, including storage blob, table and disk. It provides two options for storage: locally and geographically redundant. The locally redundant storage option allows multiple replicas of data within a single sub-region to provide the highest level of durability. The geographically redundant storage option offers an extra level of durability by replicating data between two remote sub-regions.
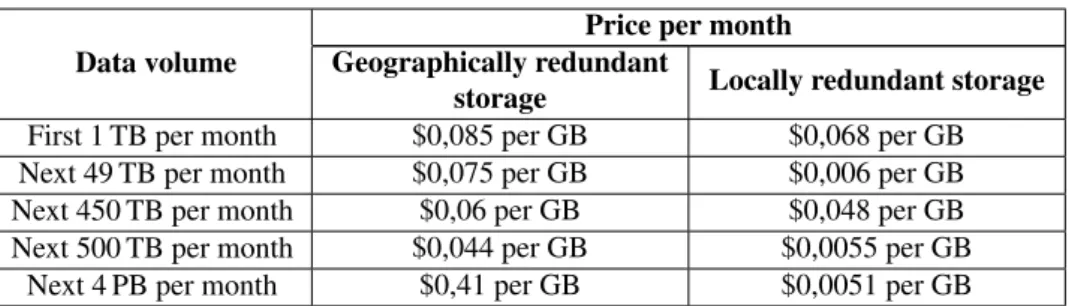
TAB. 2: Windows Azure storage prices (storage blob). Price per month Data volume Geographically redundant
storage Locally redundant storage First 1 TB per month $0,085 per GB $0,068 per GB Next 49 TB per month $0,075 per GB $0,006 per GB Next 450 TB per month $0,06 per GB $0,048 per GB Next 500 TB per month $0,044 per GB $0,0055 per GB
Next 4 PB per month $0,41 per GB $0,0051 per GB
In this model, the price varies with respect to data volume, with an earned rate when volume increases (see Table 2). In our running example, the monthly storage price of our data (100 GB dataset) with the locally redundant storage option is $0.068 · 100 = $6.8.
2.2.2 Amazon Elastic MapReduce offer
Amazon Elastic MapReduce (Amazon EMR) is a MapReduce web service provided by Amazon Web Service (AWS). Amazon EMR uses Hadoop to distribute and process the data across a resizable cluster of Amazon Elastic Compute Cloud (EC2) instances.
Amazon EMR provides a variety of standard Amazon EC2 instance that can be rent (extra small, small, large and extra large) at various prices, as illustrated in Table 3. We mention that the Amazon EMR price is included in the prices presented in Table 3.
TAB. 3: Amazon EC2 computing prices.
Type Virtual cores RAM Price per hour
Small 1 1.7 GB $0.075
Medium 1 3.75 GB $0.15
Large 2 7.5 GB $0.30
Extra large 4 15 GB $0.60
For example, the costs of five node hadoop cluster, with small instances, is $0.075 · 5 = $0.375 per hour.
Table 4 presents EC2 bandwidth prices with respect to data volume.
In this model, input data transfers are free, whereas output data transfer cost varies with respect to data volume, with an earned rate when volume increases.
TAB. 4: EC2 bandwidth prices (output data). Data volume Price per month First 1 GB per month free 2 GB-10 TB per month $0.12 per GB
40 TB per month $0.09 per GB 100 TB per month $0.07 per GB 350 TB per month $0.05 per GB
Finally, AWS Storage provides storage capabilities. Amazon Elastic Block Store (EBS) proposes a fixed price ($0.10 per GB), whereas Amazon S3 (see Table 5) enables an earned rate when volume increases.
TAB. 5: Amazon S3 storage prices. Data volume Price per month
First 1 TB $0,14 per GB Next 49 TB $0,125 per GB Next 450 TB $0,11 per GB
In our running example, monthly storage price of our data (100 GB dataset) with Amazon EBS is $0,10 · 100 = $10.
3
Cost models for distributed pattern mining in the cloud
Let Cdmbe the data management cost and Ccbe the cost of computing patterns in a
dis-tributed environment. We define the total cost C of disdis-tributed pattern mining by:
C= Cdm+Cc. (1)
Depending on the model used to distribute the computations (i.e. MapReduce or other) and the different parameters within each model, the factors which determine Cdmand Ccchange.
In our work, we consider MapReduce-based approaches. Two types of parameters setting are required in this setting: (1) parameters related to the pattern mining process such as the support threshold and the size of the database and (2) parameters related to the MapReduce framework that specify how the MapReduce job should execute the distributed pattern mining process. Let us define some functions that we use to express our cost models.
— Function s(·) returns the size in GB of any dataset, e.g., s(DS) is the size of the dataset DSand s(R) is the size of the result data R,
— Function ts(·) returns the storage time of any dataset, e.g., ts(DS) is the storage time of the dataset DS in the cloud and ts(R) is the storage time of the result data R,
— Function tmap(i, Parti(DS)) returns the runtime taken by the map task to process the ith
partition of DS,
3.1
Data management cost
We define the data management cost Cdmas the sum of data transfer cost Ct and storage
cost Cs. Formally, the data management cost is:
Cdm= Ct+Cs. (2)
Data transfer cost depends on several parameters: the size of the dataset, the size of the results and the pricing model applied by the Cloud Service Providers (CSP). The total data transfer cost Ct is the sum of the input data transfer and the output data transfer costs. The
input data transfer cost is the product of the CSP’s atomic transfer cost ctiof the input data and
the total size of input data. The output data transfer cost is the product of the CSP’s atomic transfer cost ctoof the output data and the total size of result data (s(R)):
Ct= cti· s(DS) + cto· s(R). (3)
As illustrated in equation (3), the total data transfer cost is proportional to the total size of input and output data. We notice that most cloud providers such as Windows Azure and Amazon Web Service (AWS) do not charge for input data transfers. Consequently, total data transfer cost Ctbecome:
Ct= cto· s(R). (4)
Storage cost depends on parameters such as the size of the dataset, the storage time, the type of data replication (locally redundant storage or globally redundant storage) and the CSP’s pricing policy. We assume that the storage period in the cloud is divided into intervals. In each interval, the size of the stored data is fixed. The total storage cost (Cs) is the CSP’s fixed price
per GB (cCSPs ) multiplied by the size of intial s(DS) and result data s(R), multiplied by the sum of sizes of the initial dataset and the result data, multiplied by their respective storage time during the intervals:
Cs=
∑
IntervalscCSPs · (s(DS) + s(R)) · (tend− tstart), (5)
where tstart, tendare start and end point of an interval.
By combining equations (2), (3) and (5), the total data management cost is:
Cdm=
∑
IntervalscCSPs · (s(DS) + s(R)) · (tend− tstart) + ct· (s(DS) + s(R)). (6)
As illustrated in equation (6), the data management cost depends essentially on the size of input data and result data. Indeed, it depends on the nature of data under consideration.
Beside the data management cost, it is necessary to study the computing cost on the data. In the context of our work, this computing cost consists of pattern mining cost.
3.2
Mining cost
In a cloud environment, mining processes are executed on computing instances {Ii}i=1···n
with different performances in terms of number of CPUs, available RAM, etc., and thus, with different costs. Each instance may bear different performances (with respect to its number of CPUs, its available RAM, etc.), and thus different costs.
The cost for renting instance Iiis denoted by c(Ii). This cost must be paid at each
connec-tion to the cloud. We define the cost of computing patterns by:
Cc= n
∑
i=0 c(Ii) · Tmining, (7) where Tmining= (tpart+ m max j=0(tmap( j, Partj(DS))) + r max k=0(treduce(k)) +CP · tcompress), (8)where tpartis the partitioning time, tmap( j, Partj(DS)) is the time taken by the jthMap task
to process the jth partition of DS, treduce(k) is the time taken by the kth Reduce task, tcompress
is the compression time of the result files, m is the number of Map tasks, r is the number of Reduce tasks and CP is a binary parameter set to 1 if the output data should be compressed and 0 otherwise. The values of tpart, tmap( j, Partj(DS)) and treduce(k) are estimated experimentally.
4
Optimization process
In this section, we investigate how the parametrization of the pattern mining approach and of MapReduce framework may impact the mining process performance. In the following, we present four objective functions with respect to the needs and capacity of customers. Such needs include budget limit, response time limit and mining quality limit.
Response time: The idea here is to achieve better performance in terms of response time. Given a predefined financial budget B and a predefined mining quality limit Q, our objective in this scenario is to select the best parameters that minimize the mining process in the cloud:
Ob j1= minimize Tmining, C= Cdm+Cc≤ B, MiningQuality≥ Q. (9)
Figure 1 presents the feasible solutions that minimize the response time with respect to financial budget B and a predefined mining quality limit Q. Each point in Figure 1 corresponds to a feasible solution of our objective function without considering constraints defined in equa-tion (9). The red points correspond to soluequa-tions that verify our mining quality limit (X axis) and budget limit (Y axis) constraints.
We notice that each point in Figure 1 corresponds to a response time value. The optimal solution in this context is the solution that presents the lower value of the response time.
FIG. 1: Minimizing response time under monetary cost and mining quality constraints.
Monetary cost: For a predefined response time limit T and a predefined mining quality limit Q, the objective in this scenario is to select the best parameters that minimize the monetary cost of the mining process in the cloud:
Ob j2= minimize C = Cdm+Cc, Tmining≤ T, MiningQuality≥ Q. (10)
Figure 2 presents the set of feasible solutions that minimize the monetary cost with respect to a response time limit T and a predefined mining quality limit Q. In the Figure 2, red points correspond to solutions that verify our mining quality limit (X axis) and response time (Y axis) constraints.
FIG. 2: Minimizing monetary cost under mining quality and response time constraints.
From the set of feasible solutions, we select the optimized solution that presents the lower value of monetary cost.
Mining quality: The goal of this objective function is to achieve the optimized quality of results (the mining quality). Given a predefined response time limit T and a predefined
financial budget B, our objective in this scenario is to select the best parameters that maximize the mining quality of the distributed pattern mining method in the cloud:
Ob j3= maximize MiningQuality, Tmining≤ T, C= Cdm+Cc≤ B. (11)
We show in Figure 3, the set of feasible solutions that maximize the mining quality with respect to a financial budget B and a predefined response time limit T . Points represented in Figure 3 corresponds to feasible solutions of our objective function without considering the constraints defined in equation (11). The red points correspond to solutions that verify our mining quality limit (X axis) and budget limit (Y axis) constraints.
FIG. 3: Maximizing mining quality under monetary cost and response time constraints. The optimized solution here is the one that presents the higher value of mining quality. In the case of the distributed subgraph mining task, the optimized solution is the one that presents the lower value of LossRate.
Response time vs. monetary cost vs. mining quality tradeoff: Our objective in this scenario is to select the best parameters that offer the best tradeoff between query processing time, mining quality of the distributed pattern mining method and financial cost:
Ob j4=
minimize (Tmining,C) and maximize (MiningQuality),
Tmining≤ T,
C= Cdm+Cc≤ B,
MiningQuality≥ Q.
(12)
The above presented objective function consists of multi-objective function since more than one objective function to be optimized simultaneously.
5
Experimental study
In this section, we first describe the experimental data and the overall setup of our prelim-inary experimentation effort. Then, we present the results we have obtained. We focused our experiments on solving the problem of distributed subgraph mining in the cloud. We adopted
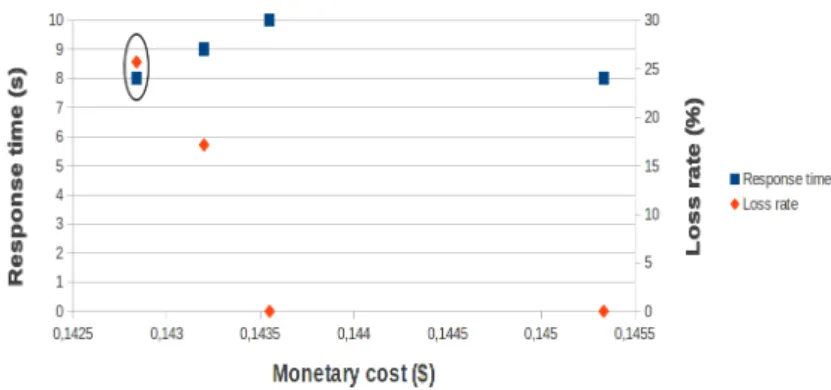
FIG. 4: Minimizing response time under monetary cost and loss rate constraints (Budget limit = $0.20 and LossRate limit = 10%).
the Pareto-based multi-objective optimization solution which aim to produce all Pareto optimal solutions. In fact, Pareto optimal solutions are very useful for decision makers who are faced with multiple objectives to make appropriate compromises, tradeoffs or choices.
5.1
Experimental setup
All experiments of our approach were carried out using a virtual cluster composed of five virtual machines. Each virtual machine is equipped with a Quad-Core AMD Opteron(TM) processor 6234 2.40 GHz CPU and 4 GB of RAM. All used machines feature Hadoop (version 0.20.2) and operate on Linux Ubuntu.
For our experiments, we have generated our data based on the obtained results from our approach for distributed subgraph mining in the cloud Aridhi et al. (2015). We used results that correspond to the distributed subgraph mining from a dataset of 100, 000 graphs (see Aridhi et al. (2015)) to form our set of multi-objective points. For each set of parameters, we noticed the values of our objectives such as the response time (Tmining), the monetary cost (C) and the
mining quality. The used parameters include MapReduce parameters and distributed subgraph mining approach parameters such as the support threshold (θ ) and a tolerance rate (τ) Aridhi et al. (2015). Monetary cost values are estimated based on the Windows Azure pricing model Inc (2014). We suppose that our experimental environment is close to the large cloud instances provided by Windows Azure. Consequently, we use the corresponding costs to compute the values of the monetary cost C of each experiment using our virtual cluster.
5.2
Experimental results
During our experimental study, we examined the four objective functions described in Sec-tion 4.
Figure 4 draws the set of feasible solutions that minimize the response time of our dis-tributed subgraph mining approach under monetary cost (C) and mining quality constraints ((LossRate in the case of subgraph patterns) ).
Each solution is represented by two points (a blue square point and a red diamond point). The blue square point corresponds to monetary cost in function of response time. The red diamond point corresponds to the loss rate in function of response time. Thus, the two points representing a solution have the same value of response time. Optimal solutions are determined by selecting solutions that present lower values of response time. For example, with budget limit = $0.20 and loss rate limit = 10% (see Figure 4), we distinguish one optimal solution (surrounded by an ellipse) which allows the lower value of response time. We notice that we can find more than one solution that allows a lower response time value.
In the Figure 5, we present the set of feasible solutions to solve the objective function associated to the monetary cost (Ob j2). Feasible solutions are represented by couples of points.
Each couple consists of one blue square point and one red diamond point. The blue square point corresponds to response time in function of monetary cost. The red diamond point corresponds to the loss rate in function of monetary cost.
FIG. 5: Minimizing loss rate under monetary cost and response time constraints (Response time limit = 10s and LossRate limit = 30%).
As shown in Figure 5, we can identify optimal solutions by selecting the solutions that present lower values of monetary cost in comparison with the set of feasible solutions. For example, with response time limit = 10s and loss rate limit = 30% (see Figure 5), we select one optimal solution (surrounded by an ellipse) which allows the lower value of loss rate.
Figure 6 illustrates the set of feasible solutions that optimize the objective function related to the loss rate of our subgraph mining approach in the cloud (Ob j3). Similarly, feasible
solutions are represented by couples of points. A couple of points contains one blue square point and one red diamond point. The blue square point corresponds to response time in function of loss rate. The red diamond point corresponds to the monetary cost in function of loss rate.
We recall that each feasible solution consists of a parametrization of the cloud-based sub-graph mining approach. As illustrated in Figure 6, the set of optimal solutions (surrounded by an ellipse) contains more than one optimal solution (six optimal solutions) that minimize the loss rate. Therefore, we have six possible parameterizations of our cloud-based subgraph mining approach.
In order to solve the multi-objective function defined in Section 4, we computed all Pareto optimal solutions from our data (a set of multi-objective points). Table 6 presents the set of
FIG. 6: Minimizing loss rate under monetary cost and response time constraints (Budget limit = $0.17 and Response time limit = 50).
Pareto optimal solutions that aim to quantify the trade-offs in satisfying the different objectives (response time, monetary cost and mining quality).
TAB. 6: Pareto optimal solutions. Cloud parameters
Optimal
solution Number of cloud
instances Data compression (CP)
Replication factor (RF)
Pattern mining approach parameters First solution 5 No 3 θ = 50% and τ = 60% Second solution 5 Yes 3 θ = 30% and τ = 0% Third solution 5 No 3 θ = 20% and τ = 0%
We notice that the presented optimal solutions in Table 6 may help the parametrization of cloud-based subgraph mining applications. They provide suggestions for the choice of parameters (cloud parameters and mining approach parameters). However, it is suitable to provide one suggestion instead of many. This can be done by ranking optimal solutions based on a user-defined parameter.
We show in Table 6, the details of the Pareto optimal solutions. These details include cloud parameter values and subgraph mining parameter values. The Pareto optimal solutions illus-trated in Table 6 aim to quantify the trade-offs in satisfying the different objectives (response time, monetary cost and mining quality).
6
Related works
Several distributed data mining systems have been proposed Ghoting et al. (2011); Chu et al. (2006); Riondato et al. (2012); Foundation et al. (2010). However, they do not incorporate an optimiser to be able to estimate the costs associated with the various distributed data mining scenarios. Consequently, several cost models have been developed for estimating costs of distributed data mining applications Ogunde et al. (2011); Nguyen et al. (2012).
In Ogunde et al. (2011), the authors present an optimized model for estimating the response time of distributed association rule mining. In this work, three estimates were defined:
— The communication cost estimates: They involve the time needed for the computing agent to travel from the agent zone (AZ) to the data sources.
— The local association rule mining costs: They make reference to the time needed for mining association rule locally at each data source.
— The results information transfer costs: They make reference to the time needed for the computing agent to travel back to the agent zone with results information concerning each local mining.
The overall response time for the distributed association rule mining T would be calculated as follows:
T= tdarm+ tdki,
where tdarm is the time taken to perform mining in a distributed environment and tdki is the time taken to perform distributed knowledge integration and return the results to the requesting server. The term tdarmis defined by:
tdarm= t1(AZ, i) + n
max
i=1t2(i) + t3(i, AZ)
where the first term is the time taken by the computing agent to travel from the agent zone to data source i. The second term is the maximum of the times taken by the computing agent to mine at all data sources. The third term is the time taken for the agent to travel from the data source back to the agent zone with the results information. The authors discussed the values of tdkiaccording to the number of used data servers and the number of data mining agents.
In Nykiel et al. (2010), the authors propose the MRShare framework that transforms a batch of MapReduce queries into a new batch that will be executed more efficiently, by merging jobs into groups and evaluating each group as a single query. The authors define a cost model for MapReduce that provide a solution that derives the optimal grouping of queries. The total cost of executing a set J of n individual jobs is the sum of the cost Treadto read the data, the cost Tsortto do the sorting and copying at the map and reduce nodes, and the cost Ttrof transferring
data between nodes. Thus, the cost in MapReduce is:
T(J) = Tread(J) + Tsort(J) + Ttr(J)
where the values of Tread(J), Tsort(J) and Ttr(J) with grouping of queries are not the same
without grouping.
Another attention was carried by Nguyen et al. (2012) to data management cost models in cloud environments. In their work, the authors propose new cost models that fit into the pay-as-you-go paradigm of cloud computing. They addressed the multi-criteria optimization problem of selecting a set of materialized views while optimizing the global monetary cost of storing and querying a database in a cloud environment. The total cloud data management cost Cis defined by:
C= Cc+Cs+Ct
where Ccis the sum of computing costs, Csis the sum of storage costs and Ct is the sum of
data transfer costs. The proposed cost models complement the existing materialized view cost models with a monetary cost component that is primordial in the cloud Nguyen et al. (2012).
In Ogunde et al. (2011), the authors deal with cost models of classic architectural models used in the development of DDM systems namely, client-server and software agents. However,
the proposed cost models in these works do not fit into cloud computing paradigm where the users only pay for the resources they use. In Nguyen et al. (2012); Nykiel et al. (2010), the authors deal with data management and execution aspect of MapReduce framework in a cloud setting. However, they do not include cost models for data mining processes in the top of MapReduce. Moreover, they do not consider monetary costs in the case of cloud-based data mining applications.
To the best of our knowledge, cost models for MapReduce-based pattern mining applica-tions in cloud environments have not been developed.
7
Conclusion
In this paper, we presented cost models for distributed pattern mining in the cloud. It consists of two levels. The first level is novel cost models for pattern mining in the cloud. We focused the defined cost models on subgraph patterns in cloud computing. The proposed cost models consist of monetary cost components that are primordial in the cloud. The second level consists of the definition of a set of objective functions with respect to the needs and the financial capacity of customers. An experimental study was carried out in the case of cloud-based subgraph mining. It provided a first evaluation of our approach by selecting the optimal solutions that minimize our objectives such as the monetary cost, the response time and the loss rate.
In the future works, we aim to extend the experimental validation of the proposed cost models to a wider-scale experimentation. In this context, additional experiments will be carried out in which we solve the defined objective functions using more methods of solving multi-objective optimization problems. We aim also to run experiments on a variable number of cloud cloud instances, thus, experimenting the effect of primordial elasticity characteristic of the cloud on our cost models.
References
Aridhi, S., L. d’Orazio, M. Maddouri, and E. M. Nguifo (2015). Density-based data partition-ing strategy to approximate large-scale subgraph minpartition-ing. Information Systems 48(0), 213 – 223.
Chu, C. T., S. K. Kim, Y. A. Lin, Y. Yu, G. R. Bradski, A. Y. Ng, and K. Olukotun (2006). Map-Reduce for Machine Learning on Multicore. In B. Schölkopf, J. C. Platt, and T. Hoffman (Eds.), NIPS, pp. 281–288. MIT Press.
Foundation, A. S., I. Drost, T. Dunning, J. Eastman, O. Gospodnetic, G. Ingersoll, J. Mannix, S. Owen, and K. Wettin (2010). Apache mahout.
Ghoting, A., P. Kambadur, E. Pednault, and R. Kannan (2011). Nimble: a toolkit for the implementation of parallel data mining and machine learning algorithms on mapreduce. In Proceedings of the 17th ACM SIGKDD international conference on Knowledge discovery and data mining, KDD ’11, New York, NY, USA, pp. 334–342. ACM.
Han, J. and J. Pei (2000). Mining frequent patterns by pattern-growth: methodology and implications. SIGKDD Explor. Newsl. 2(2), 14–20.
Inc, A. (2013a). Amazon ec2 offer.
Inc, A. (2014). Amazon ec2 offer. http://aws.amazon.com/fr/ec2/pricing/. Inc, M. (2013b). Windows azure offer.
Kashef, M. M. and J. Altmann (2012). A cost model for hybrid clouds. In Proceedings of the 8th international conference on Economics of Grids, Clouds, Systems, and Services, GECON’11, Berlin, Heidelberg, pp. 46–60. Springer-Verlag.
Maier, J., A. A. Adzhubei, and W. Egge-Jacobsen (2013). Sapa tool: finding protein regions by combination of amino acid composition, scaled profiles, patterns and rules. Bioinformat-ics 29(19), 2496–2497.
Melendez, J., M. A. Garcia, D. Puig, and M. Petrou (2011). Unsupervised texture-based image segmentation through pattern discovery. Comput. Vis. Image Underst. 115(8), 1121–1133. Nguyen, T.-V.-A., S. Bimonte, L. d’Orazio, and J. Darmont (2012). Cost models for view
materialization in the cloud. In Proceedings of the 2012 Joint EDBT/ICDT Workshops, EDBT-ICDT ’12, NY, USA, pp. 47–54. ACM.
Nykiel, T., M. Potamias, C. Mishra, G. Kollios, and N. Koudas (2010). Mrshare: sharing across multiple queries in mapreduce. Proc. VLDB Endow. 3(1-2), 494–505.
Ogunde, A. O., O. Folorunso, A. S. Sodiya, J. A. Oguntuase, and G. O. Ogunleye (2011). Improved cost models for agent-based association rule mining in distributed databases. In Annals. Computer Science Series, 9th Tome - 1st Fasc., pp. 231–251.
Riondato, M., J. A. DeBrabant, R. Fonseca, and E. Upfal (2012). Parma: a parallel randomized algorithm for approximate association rules mining in mapreduce. In Proceedings of the 21st ACM international conference on Information and knowledge management, CIKM ’12, New York, NY, USA, pp. 85–94. ACM.
Suryawanshi, S. J. and S. M. Kamalapur (2013). Algorithms for frequent subgraph mining. International Journal of Advanced Research in Computer and Communication Engineer-ing 2(3), 1545–1548.
Résumé
Durant ces dernières années, la fouille de motifs distribuée a fait l’objet de nombreux tra-vaux, notamment en bioinformatique, en analyse des données chimiques et en analyse des réseaux sociaux. Dans plusieurs cas, la distribution de la tâche de fouille de motifs génère une perte dans les résultats obtenus. La reduction de cette perte peut affecter les performances de l’approche distribuée de fouille de motifs et donc le coût monétaire surtout dans un environ-ment de cloud. Dans ce papier, nous abordons le problème d’optimisation multi-critères des paramètres liés à la fouille de motifs distribuée dans un environnement de cloud tout en op-timisant le coût monétaire global du stockage et l’interrogation des données dans le nuage. Nous définissons des modèles de coûts de gestion et de fouille de données avec une plateforme de fouille de sous-graphe à grande échelle sur une architecture cloud. Nous définissons des fonctions objectives qui traduisent le besoin de l’utilisateur. Ces besoins peuvent être exprimés par un seuil de temps de réponse, un seuil de budget ou un seuil de qualité des résultats. Nous présentons une première validation expérimentale des modèles de coûts proposés.