Guide des travaux écrits
Version 1.3 Septembre 2016
Guide des travaux écrits
Version 1.3 Septembre 2016
UNIVERSITÉ DE FRIBOURG, SUISSE FACULTÉ DES SCIENCES DÉPARTEMENT DE MÉDECINE
En collaboration avec
HAUTE ÉCOLE FÉDÉRALE DE SPORT MACOLIN
BIOMECHANICAL CORRELATION BETWEEN LINEAR AND CYCLIC MOVEMENT PATTERNS OF THE LOWER LIMBS IN ELITE BMX ATHLETES
Travail final pour l’obtention du Master en Sciences du Mouvement et du Sport
Option Santé et Recherche
Conseillers Urs MAEDER Micah GROSS
Thomy GROSS Fribourg, Novembre 2016
ABSTRACT
Maximal power depends on two parameters: force and velocity. The relation between the two parameters, also known as the force-velocity relationship, has been studied in linear as well as cyclic movement patterns. In both types of motion similar linear regressions were reported. To date, the correlation between the force-velocity relationships of linear and cyclic movements remains unknown. The aim of this study is to describe this correlation and to identify power parameters of the force-velocity relationships that favour sprint and start performances on a BMX bike. Thirteen junior and elite BMX athletes performed squat jumps in five loading conditions, five BMX starts on a supercross ramp and three 30-meter maximal BMX sprints on level ground. Using data from a force plate and on-bike powermeters, individual force-velocity profiles for each test were generated. Theoretical maximal force (F0) and
torque (T0), velocity (v0) and cadence (Cad0), cycling power (cPmax) and jumping
power (jPmax), as well as slope (SF-v and ST-Cad) were determined from the
force-velocity relationships. The correlation between the force-force-velocity parameters of the squat jump test and the two other BMX tests, as well as their relation to the sprint and start performances, were calculated. Squat jump Pmax and F0 were related to
sprint and start cPmax and T0 (p ≤ 0.01), suggesting a positive transfer from a simple
linear movement onto a complex, sport-specific cyclic movement. In Addition, F0 and
jPmax correlated with mean start and sprint power and start and sprint time (p ≤ 0.05)
and therefore proved to be good indicators of sprint performance, but more importantly competition-specific start performance. These findings have major implications for coaches and athletes regarding the design of training plans.
ACKNOWLEDGEMENTS
I would first like to thank my thesis advisor PhD. Gross Micah of the Haute école fédérale de sport de Macolin, for his continuous support, patience and availability. His guidance helped me during all the time of research and writing of this thesis. I would also like to thank MSc. Jan Ruffieux of the University of Fribourg for his coding skills and help in the data analysis.
Furthermore, I would like to express my appreciation to my sister-in-law Brittany Gross and my brother Stefan Gross for the proofreading.
I thank my fellow students and friends Joris Vaucher and Yves-Alain Kuhn for the stimulating discussions and the memorable times we have had in the last three years.
Finally, I wish to express my very profound gratitude to my spouse Aline for providing me with unfailing support and continuous encouragement throughout my years of study and through the process of researching and writing this thesis. This accomplishment would not have been possible without her. Thank you.
TABLE OF CONTENT
List of figures ... VI List of tables ... VIII List of abbreviations ... IX List of appendices ... X
1. Introduction ... 11
2. Review of literature ... 13
2.1. In vitro animal muscle ... 13
2.2. In vivo human muscle ... 13
2.2.1. Single joint movement ... 13
2.2.2. Multi-joint movement ... 15 2.3. Linear movements ... 16 2.3.1. Horizontal push-offs ... 16 2.3.2. Vertical jumps ... 19 2.4. Cyclic movement ... 21 3. Reliability study ... 28
3.1. Goals and research questions ... 28
3.2. Methods ... 28 3.2.1. Subjects ... 28 3.2.2. Study design ... 28 3.2.3. Data collection ... 29 3.2.4. Statistical analysis ... 31 3.3. Results ... 31 3.4. Discussion ... 34 4. BMX study ... 36
4.1. Goals and research questions ... 36
4.2. Methods ... 37
4.2.1. Subjects ... 37
4.2.2. Study design ... 37
4.2.3. Data analysis ... 41
4.3. Results ... 45
4.4. Discussion ... 49
4.4.1. Correlation of the power parameters jPmax and cPmax ... 49
4.4.2. Correlation of the F-v and T-Cad parameters ... 50
4.4.3. Correlation of the F-v parameters and start and sprint performances ... 52
4.4.4. Limitations ... 53 5. Conclusion ... 55 6. References ... 56 Personal statement ... 61 Copyrights ... 62 Appendices ... 63
LIST OF FIGURES
Fig. 1 : Relation between load and speed of shortening in isotonic frog
muscle contraction (Hill, 1938) ... 13 Fig. 2 : Experimental force-velocity relationship of isolated frog muscle (Hill,
1938) and in vivo human muscles (Perrine & Edgerton, 1978) as
determined in two separate experiments. ... 14 Fig. 3 : Normalized torque-velocity curve for knee extensors fitted to Hill’s
hyperbolic curve (Wickiewicz et al., 1984). ... 14 Fig. 4 : Average torque and average power developed during leg extension
exercises plotted against the average velocity (Rahmani et al.,
1999). ... 15 Fig. 5 : Distribution of r2 values of the linear regression obtained with the
linear position transducer (LPT) and the force plate (FP). Any
outliers are illustrated with a black dot. ... 33 Fig. 6 : F-v profiles of a typical subject for the same sessions implemented
from the LPT (panel A and B) and the FP (panel C and D). Open circles represent the results at different loading conditions and filled circles the extrapolated F0 and v0. Continuous lines show the results
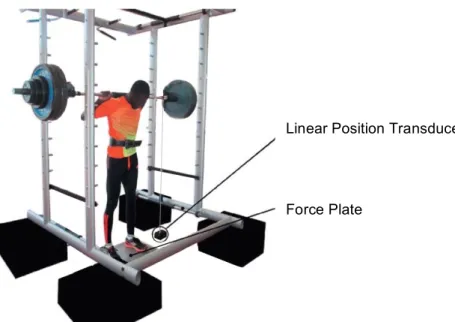
of session 1 and the dashed lines for session 2. ... 33 Fig. 7 : Overview of the experimental setup. Adapted from Giroux et al.
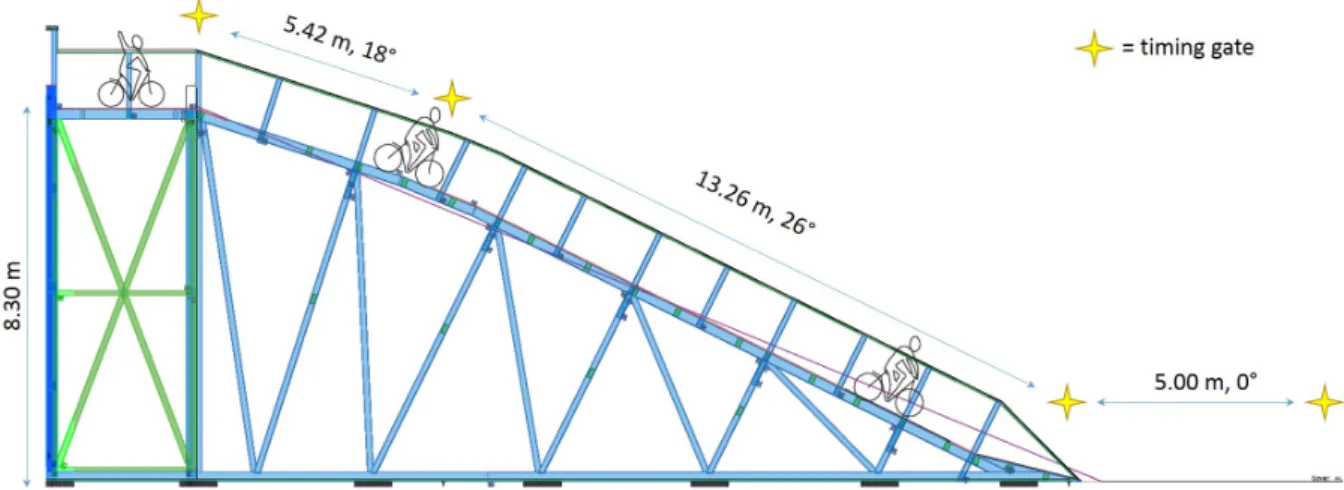
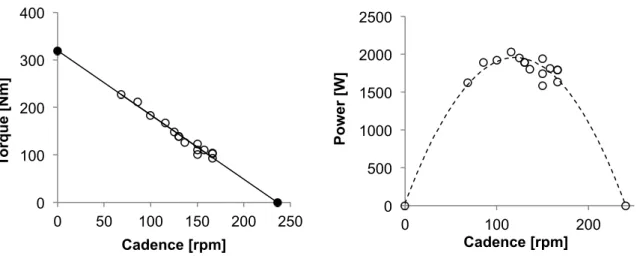
(2015b) ... 38 Fig. 8 : Cross section of the BMX Supercross start ramp. ... 40 Fig. 9 : F-v (left panel) and P-v (right panel) relationships of a typical
subject. Open circles represent the results at different loading
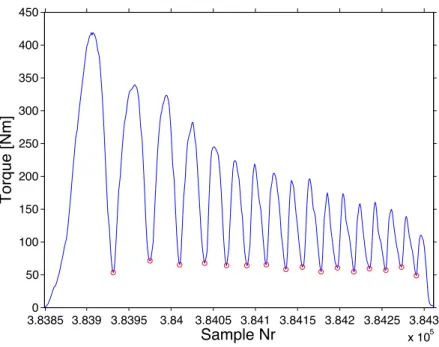
Fig. 10 : Typical torque curve over a level ground BMX sprint. Each red
circle represents a torque minimum. ... 43 Fig. 11 : T-Cad (left panel) and P-Cad (right panel) relationships of a typical
subject. Open circles represent the results at different loading
conditions and the filled circles the T0 and Cad0. ... 44
Fig. 12 : Relationship between the theoretical maximal power in the loaded squat jump and the maximal power in BMX sprint on the flat (left panel) and the maximal power in BMX start on a supercross ramp
(right panel). ... 47 Fig. 13 : Relationship between the theoretical maximal force and torque in
loaded squat jump and BMX sprint on the flat (left panel) and BMX
start on a supercross ramp (right panel). ... 47 Fig. 14 : Relationships between maximal velocity and maximal pedalling rate
in the sprint test (panel A) and the start test (panel B) and correlations between slopes of the jump test and the sprint test
(panel C) and start test (panel D). ... 48 Fig. 15 : Relationship between maximal force (panel A and C) and maximal
power (panel B and D) of the jump test and start performance
LIST OF TABLES
Tab. 1 : Mean absolute values and standard deviation of the F-v parameters for each session measured with the linear position transducer (LTP)
and the force plate (FP). ... 32 !
Tab. 2 : Within-subject variability and interclass correlation coefficient of the
F-v parameters for each measurement system. ... 32 !
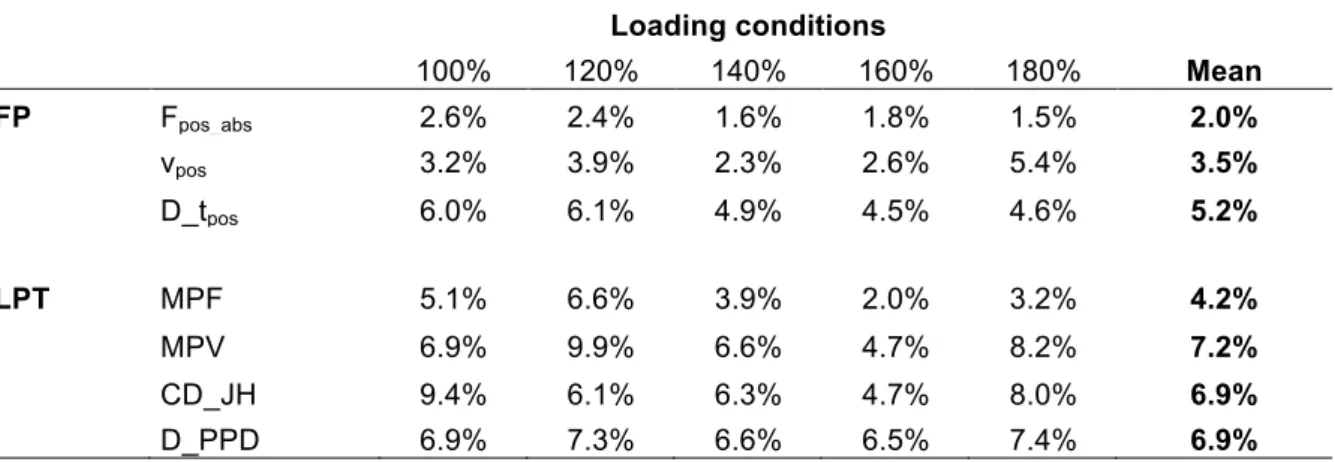
Tab. 3 : Coefficient of variance as percentage for various variables from the FP and the LPT for the 5 loading conditions. (Fpos_abs: mean concentric force, vpos: mean concentric velocity, D_tpos: mean velocity from concentric distance measured by hand and concentric time, MPF: mean concentric force, MPV: mean concentric velocity, CD_JH: mean velocity from concentric distance and concentric time, D_PPD: mean velocity from concentric distance measured by
hand and concentric time) ... 42 !
Tab. 4 : Correlation matrix between the various power parameters of the
jump test and the sprint and start test. ** p ≤ 0.01; * p ≤ 0.05 ... 45 !
Tab. 5 : Mean absolute values and standard deviation of the F-v profile parameters for each test and the sprint performance for the whole
group, male subjects and female subjects. ... 46
! !
LIST OF ABBREVIATIONS
BM Body mass
Cad0 Theoretical maximal cadence
cPmax Theoretical maximal cycling power
CV Coefficient of variation F0 Theoretical maximal force
F-v Force – velocity
FP Force plate
ICC Interclass correlation coefficient jPmax Theoretical maximal jumping power
LPT Linear position transducer
P-v Power – velocity
Pmean 30 Average power output over 30 m BMX sprint on level ground
Pmean start Average power output of a BMX start
r Correlation coefficient
r2 Coefficient of determination
rpm round per minute
SD Standard deviation
SF-v Slope of the force – velocity curve
SJ Squat jump
ST-Cad Slope of the torque – cadence curve
T0 Theoretical maximal torque
T-Cad Torque – cadence
v0 Theoretical maximal velocity
vmean 30 Average speed over 30 m BMX sprint on level ground
LIST OF APPENDICES
Appendix A: Recherche de volontaires ... 62
Appendix B: Questionnaire reliability study ... 63
Appendix C: Spreadsheet of Samozino’s computation method ... 64
Appendix D: MATLAB script ... 65
1. Introduction
Muscular power is a major determinant of performance in many sports. It is the ability to accelerate a system as much as possible in the shortest possible time. The underlying parameters of power output are (i) the capability of the neuromuscular and osteoarticular systems to generate high force level and (ii) the capacity to do it at a high contraction velocity. These two are however not unrelated, and thus, the force-velocity (F-v) relationship describes neuromuscular capacity of generating power. Many researchers have described this relationship choosing different approaches. Some analysed single muscles in vitro (Fenn & Marsh, 1935; Hill, 1938) while others described single joint movements (Perrine & Edgerton, 1978; Rahmani et al., 1999; Wickiewicz et al., 1984) or functional movements (Gardner et al., 2007; Hautier et al., 1996; Meylan et al., 2015; Rahmani et al., 2001; Samozino et al., 2012; Vandewalle et al., 1987). Most studies showed a strong curvilinear or linear F-v relationship. In addition, similar F-v relationships were found resulting from cycle ergometer sprints and squat jump tests. However, to the best of our knowledge, there is no study in literature that describes the relation between linear and cyclic movement F-v profiles. Nonetheless, such information could help coaches better understand the relationship between off-bike training exercises and on-bike performance in BMX or sprint cycling.
Therefore, the objective of this work is to analyse the correlations between the parameters of the F-v profiles of linear and cyclic movement patterns. By performing a squat jump test, a BMX sprint test on level ground and a start test on a BMX supercross ramp, the participant’s three individual F-v profiles are generated. The parameters of the F-v profiles are then extracted and compared in order to find any correlations. Performance time in the sprint and start tests are also recorded in an attempt to identify specific parameters of the squat jump test, which can favour BMX performance.
An extensive literature review will set the context of this present research and explain the significance of the F-v profile assessment. Then, a pilot study will test the reliability of two measurement systems and evaluate the protocol ahead of the main study. The BMX study will follow a standard structure. The goals and research questions of the study will be presented first followed by the methods and results.
The discussion will put the obtained result in context and present the limitations of the study. Finally, the conclusion will address the practical implications of our findings and suggest possible future work.
2. Review of literature
2.1. In vitro animal muscle
The first to study this force-velocity relationship were Fenn and Marsh in 1935. They discovered an exponential force-velocity relationship in isolated frog and cat gastrocnemius muscles in isotonic shortening conditions (Fenn & Marsh, 1935). Three years later Hill (1938) published a similar experiment on an isolated frog muscle, in which he describes the force-velocity relationship as hyperbolic (Figure 1). That means that the rate of change of force increases or decreases with changing velocity. At low velocity, a small increase in speed results in a large decrease of force. At high velocity, this same small increase in speed results in a very small decrease of force. This hyperbolic force-velocity relationship characterizes the relationship of force production and contractile velocity of a single isolated in vitro muscle while shortening. However, it does not necessarily explain the force-velocity relationship of a functional movement.
2.2. In vivo human muscle
2.2.1. Single joint movement
Studies on single joint movements have come to contrasting conclusions. Some research indicates similarities with Hill’s results (Perrine & Edgerton, 1978; Wickiewicz et al., 1984), while others discovered a linear relationship between force and velocity (Rahmani et al., 1999).
on April 19, 2016 http://rspb.royalsocietypublishing.org/
Downloaded from
Fig. 1 : Relation between load and speed of shortening in isotonic frog muscle contraction (Hill, 1938)
14 Perrin & Edgerton’s (1978) experimental
design was as follows: fifteen participants performed knee extensions with various angular velocities on an isokinetic dynamometer (Cybex II). By using the isokinetic device, it was possible to register the torque production of a muscle group at any desired velocity. Thus, with this device, velocity of muscle shortening is the controlled variable, whereas in normal muscle strength testing, velocity is the consequence of load. Seven angular velocities were tested. The results were similar to Hill’s hyperbolic single isolated muscle curve except for the lower
velocities (Figure 2). While the in vivo muscle relationship follows a hyperbolic shape over the three highest velocities (192°∙sec-1 to 288°∙sec-1), it clearly departs from that
curve at 192°∙sec-1 and shows a decreasing rate of rise in force as velocities lowers.
Wickiewicz et al. (1984) found very similar results with twelve subjects performing knee extensions, knee flexions, ankle plantarflexions and ankle dorsiflexions on a isokinetic dynamometer (Cybex II). They also noted lower torque values than what would be predicted by the Hill’s hyperbolic curve at low velocities (Figure 3). A possible explanation proposed by
the authors for this difference in results at lower velocities may be a neural regulatory mechanism. This neural mechanism would be restricting the maximal voluntary concentric force production to a maximum safe tension level of the in vivo muscle. This idea is supported by the fact that eccentric contractions obtain fairly higher
438 WICKIEWICZ ET AL.
KE
0.0 2.0 4.0 6.0 8.0 10.0 12.0 rad*s - '
0 4-O 8-O GO 16b 200 240 280 32-O mm.s'l 0.0 2.0 4.0 6.0 8.0 10.0 12.0 rad*s - ' * . . . 0 40 80 120 160 200 240 280 320 mm.s'l 1 0 . 0 2-o 20 40 40 60 6b 8-O 80 100 100 mms-l.lOOOsarc.-1 mms-l.lOOOsarc.-1 c 1.0 8 \ 8 0.8- \\ PF 0.6; 0.0 1.0 2.0 3.0 4.0 5.0 6.0 7.0 rad-s - 1 . . 1 0 20 40 60 80 100 110 mm& t . . . 1 1 0 10 20 30 40 50 60 70 mm.s-l.lOOOsarc.-1
FIG. 3. Normalized torque-velocity curves for A, knee extensors (A);
B, knee flexors (A); C, plantarflexors (0); and D dorsiflexors (0) fitted to experimentally predicted force-velocity curve (x) generated using Hill’s equation (16). Torque is expressed as a percent of maximum (P/ Although there was a large difference in cadaver limb size (36), the relative tendon excursions, when expressed as a percent change of whole muscle length, enabled us to approximate linear displacements of muscles in vivo. Table 4 lists the observed and estimated maximal angular and linear rates of shortening velocity for each muscle group. Based on the architectural data from a previous report (36) and the muscle length changes shown in Table 3, angular velocities were converted to linear ve- locities. This data was further normalized per 1,000 sarcomeres to eliminate the variable of the number of sarcomeres in series for each muscle group. The general shapes of the torque-velocity curves at the higher veloc-
08 0.2 0.0 II KF 0.0 2.0 4.0 6.0 8.0 10.0 12.0 fad&l
4-o S’O 1 2-o 160 20-o 24-O 28-o 320 mm3'1 . 10 20 30 40 50 60 70 mmzi-l~lOOOsarc.-l 0.8 0.6 DF 0.0 1.0 2.0 3.0 4.0 5.0 6.0 7.0 8.0 rads-1 0 2’0 40 i0 8’0 ld0 1;o 140 1;o mm& I 1 1 I 1 1 0 10 20 30 40 50 mms-l lOOOsarc9
P,) and velocity of shortening is expressed as rad. s-l, mm l s-‘, and
mm l s-l. 1,000 sarcomeres-? KE, knee extensors; KF, knee flexors; PF,
ankle plantarflexors; DF, ankle dorsiflexors.
ences between these muscle groups are even greater. The linear velocity differences can be accounted for, at least to a large degree, by the differences in the number of sarcomeres in series (Fig. 4).
To avoid using the predicted Vmax to compare the velocity potential of each muscle group, the observed difference between the velocity at 70 and 60% of the maximum measured torque was determined (Fig. 2). The relationship between this change in velocity in radians per second and in millimeters per second suggests that a major determinant of the velocity potential of the muscle groups studied is the number of sarcomeres arranged in series typical for each muscle group (Fig. 4). A similar
Fig. 3 : Experimental force-velocity relationship of isolated frog muscle (Hill, 1938) and in vivo human muscles (Perrine & Edgerton, 1978) as determined in two separate experiments.
Fig. 2 : Normalized torque-velocity curve for knee extensors fitted to Hill’s hyperbolic curve (Wickiewicz et al., 1984).
2
tension levels than maximal voluntary concentric tensions. So, at low velocities and high forces, there might be a functional maximum-tension limiting mechanism, which would explain the biphasic force-velocity relationship (Perrine & Edgerton, 1978; Wickiewicz et al., 1984).
In contrast to the two mentioned studies, Rahmani et al. (1999) discovered a linear relationship between force and velocity in a single joint movement (Figure 4). In their study, they tested 20 healthy elderly men on a series of maximal ballistic knee extensions at different loads. They used an inverse dynamic method allowing force and velocity to be deduced from the load displacement. This method has the advantage of allowing ballistic movements, which are closer to everyday life than isokinetic movements,
according to the authors. Their results showed a strong linear relationship for every subject (r = 0.92 – 0.99. p < 0.001). The lower force and higher velocity portion of the curves shows similarities with the previously describes biphasic curve, however the high force and low velocity portion does not. It is unclear if this discrepancy in the lower velocity part of the curve is due to the measuring method used or the protocol itself. Although isokinetic contraction of the leg extender muscle has a strong correlation with ballistic types of muscle activation, from a functional point of view, isokinetic movements represent an unnatural muscular activity (Bosco et al., 1983). This might be a possible explanation for this force-velocity disparity.
2.2.2. Multi-joint movement
Since pluriarticular movements are more important in many aspects than single joint movements, evaluation of their muscular dynamic properties seems only logical. Many studies have been conducted on the force-velocity relationship in multi-joint movements. To allow a better overview, it may be useful to structure the work
Fig. 4 : Average torque and average power developed during leg extension exercises plotted against the average velocity (Rahmani et al., 1999).
accomplished so far into two separate sections: one section focusing on linear multi-joint movement and the other on a cyclic movement pattern.
2.3. Linear movements
Linear movements of the lower limbs have been studied using different methods. Some researchers favoured a horizontal testing method (Meylan et al., 2015; Samozino et al., 2012; Yamauchi & Ishii, 2007) while others investigated vertical squatting or jumping (Bosco et al., 1995; Giroux et al., 2015b; Rahmani et al., 2001).
2.3.1. Horizontal push-offs
In order to understand the impact of maximal average power and F-v relationship on the performance of the leg extension neuromuscular system, Samozino et al. (2012) used a theoretical integrative approach. According to these authors, “jumping performance can be expressed as a function of some mechanical characteristics of the lower limbs” (Samozino et al., 2012). These mechanical characteristics are theoretical maximal force (F0) and theoretical maximal velocity (v0) extrapolated from
the force-velocity relationship and theoretical maximal jumping power (jPmax) being
the apex of the power-velocity 2nd-degree polynomial relationship. In their study, they
predicted theoretical performance and compared this with measured experimental performance. An Explosive Ergometer, consisting of a seat fixed on a carriage, which is free to move on a rail, was used. This apparatus can be inclined to a maximal angle of 30°. At the bottom of the ergometer, two force plates (FP) were fixed perpendicularly to the rail. The participants would accelerate themselves and the sled by pushing onto the FP. An electric motor was used to impose certain resistive forces onto the sled. These braking forces varied between 0% and 240% of the participants body mass (BM). Fourteen young athletic subjects took part in the experiment. All participants practiced physical activities including explosive movements. The participants were seated and strapped on the carriage seat. Starting position was set at 90° knee angle and the participants were instructed to perform maximal push-offs. Two trials were performed at each braking force separated by two minutes of recovery. The best trial of each braking force condition was used to determine average force, velocity and power during the entire push-off phase. These values
were then used to construct the F-v and P-v relationship for each participant in order to determine F0, v0 and jPmax. The collected data from the inclined push-offs were
then used to compare to the predicted ones in order to validate the theoretical integrative approach. The results showed a linear fit of the F-v relationship (r2 = 0.75– 0.99, p ≤ 0.012) which is in agreement with the aforementioned ballistic knee extension study (Rahmani et al., 1999). There was no significant difference between the theoretical predicted values and the measured values and the theoretical approach was therefore validated. The F-v relationship has usually been described as exponential or hyperbolic for isolated muscle (Fenn & Marsh, 1935; Hill, 1938), but in mono- and pluriarticular movements the F-v relationship, and thereby F0, v0 and
jPmax, refers to an entire in vivo neuromuscular system. This is a complex system
consisting of many different muscles with different fibre types, architectural characteristics, tendon properties and also different neuronal activation abilities (Cormie et al., 2011). This may explain the different F-v curve in isolated and in vivo muscle.
Yamauchi & Ishii (2007) have shown that jPmax is the greatest muscular characteristic
to affect push-off performance, but it has been demonstrated that it isn’t the only one. Indeed, Rahmani et al. (1999) showed that two participants with the same jPmax, don’t
necessarily attain the same push-off performance. Their respective F-v profiles play an important role especially the slope of the F-v curves (SF-v). SF-v is the ratio
between F0 and v0. Samozino et al. (2012) found that for each subject, there is an
optimal F-v profile. The greater the difference between the optimal F-v profile and the real one, the lower the performance will be. Differences ranging from 36 to 104% have been reported between individual F-v profiles and optimal ones. Unfavourable F-v profile can make up to 30% in push-off performance between participants with similar jPmax. This shows the importance of F-v profile assessment, not only for
scientists who are studying muscle function and its’ characteristics, but also for coaches who are monitoring athletes’ training.
Yamauchi and Ishii (2007) and Meylan et al. (2015) used a very similar approach to construct individual F-v profiles. They also used horizontal ballistic push-offs against different loads or braking forces on a sled: Yamauchi & Ishii (2007) with the purpose of comparing the different F-v parameters to vertical jump performance, and Meylan et al. (2015) in order to quantify the reliability of F-v and P-v profiles and estimate
maximal strength expressed as a one repetition maximum (1RM). In Yamauchi & Ishii’s (2007) study, 67 untrained young subjects performed ballistic push-offs with various loading, maximum isometric measurements, and vertical countermovement jumps. The ballistic push-offs resulted in linear and parabolic relationships for F-v and P-v, respectively, which are in line with previous results (Samozino et al., 2012). Furthermore, the maximum isometric force was not significantly different from F0.
This shows that F0 can be associated with maximal isometric force performance
(Cormie et al., 2011; Yamauchi & Ishii, 2007). By comparing F-v parameters to vertical jump performance, a positive correlation was found for F0, v0 and jPmax (r =
0.48, 0.68, and 0.76; p < 0.001). Although there is a strong correlation between jPmax
and vertical jump performance, it is not possible to predict jPmax from vertical jump
height with enough accuracy. This is due to the fact that the optimal load at which jPmax is attained during the push-off is not equal to the body weight during vertical
jumps (Yamauchi & Ishii, 2007).
In their study with 36 youth males Meylan et al. (2015) also employed ballistic push-offs against various loads (80 - 160% BM) on three separated occasions using a horizontal leg press. Instead of using two FP like in other studies (Samozino et al., 2012; Yamauchi & Ishii, 2007), they used a linear position transducer. The results showed a linear F-v relationship (r2 = 0.90), which is in accordance with the aforementioned research (Samozino et al., 2012; Yamauchi & Ishii, 2007). A much stronger reliability of the F-v parameters was found between sessions 2-3 compared to sessions 1-2. This variability is due to a learning effect and it is recommended to conduct a familiarization session prior to the testing in order to confidently assess athletes’ F-v profiles. It was also confirmed that the 1RM prediction method by Jidovtseff (2011) based on the load-velocity profile is a reliable method to asses maximal strength. This method predicts 1RM at 0.23 m∙s-1 on the individual
load-velocity curve and “could be a preferred method to determine maximal strength in untrained or youth athletes” (Meylan et al., 2015).
Overall, the studies that analysed the characteristics of the F-v relationship in horizontal pluriarticular ballistic movements showed a strong linear relation between force and velocity, as well as a strong parabolic relation between power and velocity. The testing method was revealed to be reliable for assessing F-v profiles, although a familiarization trial is recommended for untrained people. Furthermore, this horizontal
testing method has the advantage of assessing neuromuscular characteristics with resistance which is greater or less than body mass, and allows a population with poor squatting or landing skills to avoid any overloading of the spine (Faigenbaum et al., 2009). However horizontally performed push-offs are unusual movements; therefore, vertical squatting would represent a more functional movement.
2.3.2. Vertical jumps
Many researchers choose squatting to study mechanical behaviour of the lower limb muscles, because it is a basic and widely used training exercise among athletes. Several works concentrated on the F-v relationship in vertical squat jumps (Bosco et al., 1995; Cuk et al., 2014; Giroux et al., 2015a, 2015b; Rahmani et al., 2001; Samozino et al., 2014). Most of them performed the squat jump (SJ) with additional loads on their shoulder over a force plate (Bosco et al., 1995; Rahmani et al., 2001; Samozino et al., 2014) or with a pulley device, which simulated an increase or decrease in body weight (Cuk et al., 2014).
Rahmani et al. (2001) studied the F-v and P-v relationships from loaded SJ performed with a guided barbell over a FP. Fifteen international alpine ski racers took part in the study. The loading conditions ranged from 60 – 180 kg with an increment of 20 kg. In addition to the loaded dynamic tests, the participants also performed maximal isometric contractions at a knee angle of 90°. The results showed a strong linear relationship between force and velocity for each individual (r2 = 0.83 – 0.98).
These findings are in line with the F-v relationship from horizontal push-off movements (Meylan et al., 2015; Samozino et al., 2012; Yamauchi & Ishii, 2007) but also with other vertical SJ studies using a larger range of loads (Bosco et al., 1995) or lighter loads (Samozino et al., 2014). Researchers (Giroux et al., 2015a; Samozino et al., 2014) using a simple computation method proposed by Samozino et al. (2008) in which F0, v0 and jPmax are computed from SJ height, push-off distance and body
mass, have found the same linear correlation between force and velocity (r2 = 0.83 – 1.00). This was also the case for Cuk et al. (2014) with their method of measuring SJ with positive and negative loading. They used a pulley device, which simulated either an increase or decrease in bodyweight up to 30%. Their result showed a strong linear F-v relationship in addition to high reliability indices for F0, v0, jPmax and SF-v
(ICC = 0.80 – 0.98). This suggests that negative loading doesn’t affect the F-v profile and could therefore be used with untrained subjects or rehabilitating athletes.
In contrast to other studies (Cormie et al., 2011; Yamauchi & Ishii, 2007), the results of Rahmani et al. (2001) showed that the F0 extracted from the F-v curve, couldn’t be
associated with the maximal isometric contraction. Indeed, F0 was 23% higher than
the measured isometric contractions. This overestimation is partly attributed to the position of the subject. Isometric contractions were performed at 90° knee angle, whereas in dynamic contractions, the knee angle range from 90 to 180° with a maximal force production at 110°. It is therefore hypothesised that isometric contractions performed at 110° are more likely to give a closer result to F0.
SF-v is an important parameter of the F-v relationship, because it has a great
influence on the jump performance (Samozino et al., 2012). The results of Rahmani et al. (2001) exhibit a major variability between participants (CV% = 25.8%) for the SF-v. This might be surprising in such a homogenous group of athletes, but since SF-v
is the ratio of F0 and v0, a small variability in those two parameters results in a major
variability of the SF-v. Other research on the significance of the SF-v parameter in
squat jump showed that the slope of the F-v curve varies greatly from one sport to another due probably to the specific adaptations form chronic sport practice (Giroux et al., 2015a).
The research of Samozino et al. (Samozino et al., 2014) using the computation method based on jump height, BM and push-off distance, confirmed their earlier findings (Samozino et al., 2012) that not only jPmax but also SF-v had an impact on
jump performance. This time, the subjects performed vertical squat jumps with additional load (0, 25, 50 and 75% of BM). To quantify the impact of SF-v on
performance, the individual F-v imbalance was computed from actual and optimal F-v profiles. An average performance loss of 6.49 ± 6.25% was reported due to the individual F-v imbalance. These results are in line with the aforementioned findings from Samozino et al. (2012). In addition, the results again showed a strong and linear relationship between force and velocity (r2 = 0.87–1.00; p ≤ 0.05). Moreover, the results supported what has been previously demonstrated (Samozino et al., 2012; Yamauchi & Ishii, 2007) that jPmax was significantly related to jump performance (r2 =
0.78; p ≤ 0.001). This was also found by Bosco et al. (Bosco et al., 1995) who compared F-v and P-v relationships to jump and sprint performance. jPmax correlated
with SJ and countermovement jump performance (SJ: r2 = 0.80; p ≤ 0.01, CMJ: r2 =
0.80; p ≤ 0.01).
Overall, the studies assessing F-v relationship and P-v relationship in vertical multi-joint ballistic movement showed, despite different research methods, similar results to the above-mentioned single joint and horizontal multi-joint movement studies. A clear linear F-v relationship was reported and the importance of jPmax and SF-v was
reinforced. Ballistic jump squat is therefore a valid and reliable exercise to evaluate individual F-v and P-v relationship.
2.4. Cyclic movement
The muscle F-v relationship demonstrated in linear movement patterns was also studied in cyclic movement patterns (Bertucci & Hourde, 2011; Bertucci et al., 2007; Bertucci et al., 2005; Debraux & Bertucci, 2011b; Dorel et al., 2005; Driss et al., 1998; Gardner et al., 2007; Hautier et al., 1996; Martin et al., 1997; Sargeant et al., 1981; Seck et al., 1995; Vandewalle et al., 1987). The force-velocity test as its name suggests, was commonly used to assess the relationship between torque and pedalling cadence. The test consists of one or multiple short, all-out sprints against a resistance, which allows subjects to produce maximal torque while accelerating through a full range of cadences in approximately 6 seconds. It enables the description of the torque-cadence (T-Cad) and the power-cadence (P-Cad) relationships and the assessment of its components (T0, Cad0, ST-Cad, Cadopt and
cPmax). T0 and Cad0 are the theoretical maximal torque and cadence and Cadopt is
the optimal cadence at which maximal cycling power (cPmax) is obtained.
Several methods were used to perform the force-velocity test. One of them uses a friction braked ergometer, where different resistive loads are applied onto the flywheel (Arsac et al., 1996; Bertucci et al., 2007; Driss et al., 1998; Hautier et al., 1996; Vandewalle et al., 1987). This method uses standard equipment, but does not account for the flywheel acceleration and therefore may underestimate maximal power (Lakomy, 1986). Furthermore, it requires participants to perform multiple sprints. The isokinetic method on the other hand, controls pedalling rate and measures the force applied on the pedals (Sargeant et al., 1981). It generates valid measurement of instantaneous average and maximal power but also requires
multiple sprints at different pedalling rate and necessitates highly modified equipment (Martin et al., 1997). Then, there is the method using both friction resistance and flywheel inertia, which allows maximal power measurement in a single sprint, but requires important ergometer modification and doesn’t measure instantaneous power (Seck et al., 1995). Finally, the inertial-load method uses only the resistance provided by the moment of inertia of the flywheel. By adding an intermediate gear drive onto the ergometer between the crank and the flywheel, gear-ratio is increased (Driss & Vandewalle, 2013). This method allows measurement of instantaneous and average power and produces valid measure of maximal power in only one single sprint (Gardner et al., 2007; Martin et al., 1997).
Strong linear T-Cad relationships haven been found in numerous studies (Bertucci et al., 2005; Dorel et al., 2005; Gardner et al., 2007; Sargeant et al., 1981; Vandewalle et al., 1987) and is nowadays well accepted among researchers. Sargeant et al. (1981) measured power output and T-Cad relationship with the isokinetic method. They found strong linearity in the maximum peak force - cadence profiles (r > 0.97, p < 0.002) for all participants. The large intersubject difference was resolved when maximum peak torque was standardized to the upper leg volume. A parabolic relationship was displayed, when maximum peak power was plotted against cadence. This showed a decrease in power at higher cadence. Similar results have been shown by Vandewalle et al. (Vandewalle et al., 1987) in their study using a friction braked ergometer. Their research focused on the T-Cad relationship in different populations of elite and recreational athletes. Like reported by Sargeant et al. (1981), the individual T-Cad data were well described by a linear relationship for cadence values between 100 – 200 rpm (r > 0.99) as was the P-Cad by a parabolic relationship. This was also the case for the results of twelve elite track cyclists, where the coefficient of determination averaged 0.981 ± 0.01 for the T-Cad profiles and 0.957 ± 0.015 for the P-Cad profiles (Dorel et al., 2005). Gardner et al. (2007), in their attempt to compare laboratory and field measured power with elite track cyclists, found similar results for both tests to the aforementioned studies. For the laboratory test, the inertial-load method was used and for the field test, an SRM powermeter was fitted to the athlete’s bicycle. The laboratory and field T-Cad data showed also good linear fit (r2 = 0.990 ± 0.01; r2 = 0.983 ± 0.02, respectively) as previously reported.
The linear T-Cad relationship is describes by three parameters; T0, Cad0 and ST-Cad.
T0 represents the theoretical maximal torque of the cyclist and is the intercept of the
T-Cad curve with the torque axis. T0 was reported to be an index of maximal leg
strength, since a correlation was found between T0 and maximal isometric force [r =
0.73, p < 0.05 (Driss et al., 2002)]. In elite track cyclists this power parameter was reported to be 235.9 ± 19.1 Nm (Dorel et al., 2005). This is in agreement with the results of Martin et al. (1997) and Driss et al. (1998) with average T0 values of 203 ±
9 Nm and 183.4 ± 15.1 Nm, respectively. The slightly lower values are certainly due to the tested subjects, which were volleyball players (Driss et al., 1998) and active males (Martin et al., 1997), but not cyclists who were specifically trained for maximal power production. Gardner et al. (2007) also tested track cyclists and found higher T0
values for the laboratory test (266 ± 20 Nm) and the field test (266 ± 13 Nm). These higher values were partly due to the fact that the cyclists were allowed to stand out of the saddle for both tests, which generates greater power and torque values (Bertucci et al., 2005; Reiser et al., 2002). Not in line with the described results were the results of Bertucci et al. (2005), who compared field power on a road bicycle in a gymnasium to laboratory power on the same road bike mounted on an ergo-trainer. F0 for the field test was 857 ± 154 N and 745 ± 100 N for the laboratory test.
Assuming a crank arm length of 175 mm, it can be expected that T0 was 150 ± 27
Nm for the field test and 130 ± 17 Nm for the laboratory test. These values are relatively low it may be that the data collection had been compromised.
Cad0 is the theoretical maximal pedalling rate of the cyclist and is the intercept of the
T-Cad curve with the cadence axis. Its values have been reported to be 220 ± 8 rpm for active people (Sargeant et al., 1981), 233 ± 9.7 rpm for volleyball players and between 248 and 281 rpm for competitive cyclists in different test conditions [laboratory and field tests; seated and standing position (Bertucci et al., 2005)]. Vandewalle et al. (1987) showed various values for different populations. Among eight sport disciplines, endurance runners had the lowest Cad0 (212 ± 19 rpm). On
the other hand, track cyclists and sprint runners had the highest values (249 ± 12 rpm; 247 ± 13 rpm, respectively). This is in line with the aforementioned studies and with Dorel et al. (2005), who tested elite track cyclists (260 ± 8.6 rpm). These reported results show that power athletes exhibit greater T0 and Cad0 than
power production capacity is dictated by the T-Cad relationship, which is given by the two parameters T0 and Cad0 (Cormie et al., 2011).
ST-Cad is a further parameter of the T-Cad relationship, which describes the slope of
the curve. It value is given by the T0 and Cad0. From the data of Vandewalle et al.
(Vandewalle et al., 1987), the ST-Cad of different sport disciplines was calculated. Not
surprisingly steeper average ST-Cad values were found for power athletes (rugby
players: -0.847; sprint runners: -0.784; track cyclists: -0.727) compared to endurance athletes (endurance cyclists: -0.634; endurance runners: -0.659). These values differ from elite track cyclists in laboratory and field conditions [-1.040 ± 0.09 and -1.035 ± 0.10 (Gardner et al., 2007)]. Possible explanations for this discrepancy may be the level of the track athletes or the measuring method used. Unfortunately, the importance of ST-Cad has, as of yet, received little attention from the scientific
literature.
cPmax is the theoretical maximal power and corresponds to the apex of the parabolic
P-Cad relationship. It is the most researched power parameter, because it has been directly linked to sports performance (Giroux et al., 2015a). Cadopt is the pedalling
rate at which cPmax occurred and corresponds to 0.5 ∙!Cad0 (Vandewalle et al., 1987).
Sargeant et al. (1981) were among the first to describe the T-Cad and P-Cad relationship. They reported maximal power output averaged over a complete pedal revolution for active untrained subjects of 840 ± 153 W at 110 rpm. Similar results were discovered by Hautier et al. (1996) in their study on the P-Cad relationship and muscle fibre composition. Ten trained subjects performed a force-velocity test on an isokinetic ergometer. cPmax and Cadopt were 940 ± 155.5 W and 120 ± 8 rpm.
Furthermore, Cadopt and cPmax standardized to body weight were related to the
percentage of the cross-sectional area of fast twitch muscle fibres (r = 0.88, p < 0.001; and r = 0.60, p < 0.06, respectively). Therefore, when the percentage of type II fibres is high, Cadopt should be high. On the contrary, when the percentage of slow
twitch fibres is high, Cadopt should be lower. This confirms what has been reported
previously, namely that power athletes exhibit greater Cad0 (which is directly linked to
Cadopt) than endurance athletes. Vandewalle et al. (1987) confirmed this with the
following cPmax and Cadopt values in different sports; rugby players:1257 W at 119
rpm ; track cyclists: 1180 W at 125.5 rpm; sprint runners: 1252 W at 123.5 rpm; endurance runners: 776 W at 106 rpm and road cyclists: 870 W at 114.5 rpm. Driss
et al. (1998) and Arsac et al. (1996) found comparable result for trained athletes and volleyball players with the friction load method (cPmax: 868 ± 132 W and 1090 ± 96.6
W Cadopt: 125 ± 9 rpm and 116.5 ± 4.8 rpm). In high-level track cyclists, cPmax is
expected to be greater due to the specific demands of the sport. This is the case, as has been demonstrated by Gardner et al. (2007) and Dorel et al. (2005) with greater values than previously reported (1791 ± 169 W and 1600 ± 116 W, respectively). Cadopt was also slightly higher for elite track cyclists (128 ± 7 rpm and 129.8 ± 4.7
rpm). Like in the other T-Cad parameters, Gardner et al. (2007) found no significant differences between field and laboratory cPmax and Cadopt. This indicates that
maximal T-Cad values may provide an accurate means of modelling cycling performance. When comparing the two P-Cad parameters to performance (speed over 200 m), Dorel et al. (2005) showed that Cadopt was significantly related to
performance (r = 0.77, p < 0.01) but, interestingly, cPmax was not. However, when
scaling cPmax to frontal surface area, a correlation with performance was shown (r =
0.75, p = 0.01). Frontal surface area of the bike and the rider affects the air resistance, which makes up 90% of the resistive force when cycling on a track. In reducing the frontal surface area, air resistance will also decrease leading to an increase in speed at the same power output. Several other BMX studies (Bertucci & Hourde, 2011; Bertucci et al., 2007; Debraux & Bertucci, 2011b) also found correlations between cPmax and performance. Bertucci et al. (2007) performed a
force-velocity test using the friction-load method and BMX starts or sprints with 35 regional and national BMX riders. The results showed a strong correlation between maximal power output and BMX time performance over 30 m (r = 0.85, p < 0.01). This is in line with Bertucci (2011), who found a significant relationship between BMX race time over 25 and 27 m and maximal power output on an ergometer (r = 0.59, p < 0.05 and r = 0.61, p < 0.05, respectively). Debraux and Bertucci (2011a) studied the determining factors of the sprint performance in BMX riders. Seven elite BMX riders performed 30 m sprints on level ground from a stationary start. Their results were similar to the aforementioned study when comparing cPmax to average velocity
over 80 m (r = 0.99, p < 0.05). Interestingly cPmax was not significantly related to time
performance after 20 m but T0 was (r = 0.98, p < 0.05). T0 being a good indicator of
maximal force (Driss et al., 2002) suggests that T0 could be an important factor for
Many researchers have also investigated the link between power in linear movement, such as the vertical jump and in cyclic movement, such as short all-out sprint on a cycle ergometer or a bicycle (Bertucci & Hourde, 2011; Bertucci et al., 2007; Debraux & Bertucci, 2011b; Driss et al., 1998; Hautier et al., 1996; Vandewalle et al., 1987). Vertical jump height has been reported to be highly correlated with the peak jumping power measured with a force platform (Davies & Young, 1984) and with jPmax
extracted from the P-v relationship (Bosco et al., 1995; Samozino et al., 2012; Yamauchi & Ishii, 2007). Therefore measurement of vertical jump height can be considered as an effective field method of evaluating muscle power. Vandewalle et al. (1987) used this method and compared jump height results with cPmax obtained on
a cycle ergometer. A significant correlation between jump height and cPmax scaled to
body mass was shown (r = 0.85). However the correlation coefficient wasn’t particularly high. Similar results where shown by Hautier et al. (1996) and Driss et al. (1998) with correlation coefficient r being 0.87 and 0.754, respectively. More recently, Bertucci (Bertucci & Hourde, 2011) came to the same conclusion when comparing cPmax values collected on a bicycle in laboratory and field conditions with squat jump
height (r = 0.79, p < 0.05 and r = 0.69, p < 0.05). Bertucci et al. (2007) went even further and compared maximal power of a single SJ to BMX start performance. SJ maximal power was significantly related to time after 5 m and 30 m (r = 0.75, p < 0.01 and r = 0.83, p < 0.01). These different correlations obtained between brief cyclic and linear movements all show that they characterize related functional properties, namely instantaneous leg muscle power (Hautier et al., 1996). Debraux et al. (2011b) chose a different approach to compare cyclic and linear movements. Ten national elite BMX riders performed a series of loaded SJ in order to obtain the F-v profile and a force-velocity test on a cycle ergometer. From the F-v profile, jPmax, F0 and v0 were
extracted and from the force-velocity test cPmax was calculated. The relationships
between the tests were studied. The major finding of the study was the significant correlation between F0 and cPmax (r = 0.65, p < 0.05). Therefore theoretical maximal
force in SJ is a determining factor of the power output in short all-out cycling sprints. Maximal leg strength is thus an important parameter during the start phase of a cycling sprint.
Overall, the findings of studies describing the torque and power-cadence relationship show numerous similarities with the previously described force and power-velocity
relationship studies, not only in regards to their linear and parabolic nature, but also to the similarities found between the various parameters of the power profiles. But no study has yet analysed the correlation between the slopes and endpoints of the linear and cyclic movement profiles and therefore it remains unknown if there is any transfer mechanism.
3. Reliability study
3.1. Goals and research questions
The aim of the test-retest reliability study is to ensure that the T-Force (Ergotech, Spain), a linear position transducer (LTP), is an adequate measuring system by comparing it to a general accepted measuring system, the Quattro Jump (Kistler, Switzerland) force plate. Its results will aid the decision as to which measuring system will be used for the main BMX force-velocity relationships study. Furthermore, it serves as a pilot study to the main study, in which the protocols will be tested and gain experience in the manipulation of the measuring tools and software will be gained.
The research question is the following:
! How reliable are the measurements of concentric jump height obtained from a linear position transducer (T-Force) and force plate (Quattro Jump,) measuring systems?
3.2. Methods
3.2.1. Subjects
To recruit participants for this reliability study, an ad (see Appendix A) was published in the different gymnasiums and sent to all sport students at the University of Fribourg. Twelve students replied to the ad and agreed to take part in the study. Their mean (± SD) age, height, body mass and body mass index (BMI) were 24.6 ± 2.6 years, 178.5 ± 8.7 cm, 73.2 ± 11.0 kg and 22.9 ± 2.3 kg∙m2 respectively. Two
participants were not familiar to squat training. They underwent a brief introduction followed by a familiarization period. All participants were healthy and no injuries were reported.
3.2.2. Study design
The procedure included two tests (test and re-test) of maximal ballistic squat jumps with additional load separated by a week. After arriving at the university laboratory, the participants filled out a form provided by Swiss Olympic, where anthropometric,
training load, nutritional and physical data were collected, as well as the current motivation and mood (see Appendix B). Before doing a 10-minute warm up on a bicycle at a self-selected intensity, a brief instruction of the following test was given to the participants. Subjects’ weight was determined with the FP and this was used to calculate the different additional loads. After that, the exact squat depth was established. Participants were asked to assume a position with a knee angle of 90° while an apparatus was placed underneath their hip, which would help maintain the same start position throughout the trials. In addition, push-off distance was calculated. It corresponded to the distance from the ground to the iliac crest in the fully extended position subtracted to the same distance in the start position.
After the warm up, dynamic tests were conducted. Participants performed squat jumps under five loading conditions (0%, 25%, 50%, 75% and 100% of BM). The additional load was placed on a 8-kg barbell placed on participants shoulder. For the 0% BM condition, the barbell was replace with a wooden stick, which weighed 0.3 kg. Subjects were instructed to maintain the barbell in contact with their shoulder throughout the motion. Upon an auditory command, the participants went in the start position and after about two seconds jumped as fast and as high as possible. Three SJ were performed for each randomly assigned load condition, plus a fourth or fifth in the case of a 10% height difference between the three jumps. In between each jump, the barbell was taken off their shoulders for a 30 second break and between each load condition the subjects had approximately 3 minutes pause.
3.2.3. Data collection
The data were collected from both devices simultaneously. The FP, which was positioned underneath the participants and den LPT, which mobile portion was attached to the barbell.
The FP was setup according to the manufacturer’s specifications. Before each test, the FP was calibrated. The natural frequency is approximately 150 Hz and the force range is 0 – 10 kN at a linear force signal (<± 0.5), according to the manufacturer. Data is sampled at a rate of 500 Hz and stored on a PC. The Quattro Jump software (Kistler, Switzerland) processes the signal from the FP. Various variables from the vertical force component are calculated from the ground reaction force, but only the
jump height was used for further calculation using a simple computation method proposed by Samozino et al. (2008).
The LPT is composed of a two meter wire attached to the barbell and winding into a sensor unit placed on the floor. Inside the sensor unit, a tachogenerator measures the speed of the extension of the wire. The sampling rate is 1000 Hz. The sensor is connected to an electronic data acquisition board, which allows the data transfer to the software (T-Force System Software, Ergotech, Spain). The software calculates various variables from the measured displacement time of the wire, but only jump height was used for further calculations.
The Samozino computation method is a simple and accrued field method to evaluate force, velocity and power of the lower limbs during squat jumps (Samozino et al., 2008). This method is solely based on three parameters; total mass (BM + additional load), push-off distance and jump height. For each trial the mean vertical force (!) and the mean vertical velocity (!) were determined as following:
F = mg h
h!" + 1 (1)
! = !ℎ
2 (2)
with ! being the total mass (BM + additional load), ! being the gravitational acceleration (9.81m∙s-2), ℎ the vertical jump height and ℎ
!" the vertical push-off
distance. ℎ was obtained from the ground reaction force being measured by the FP and from the velocity measured by the LPT. The mean power (!) is the product of the mean vertical force (!) and the mean vertical velocity (!), obtained from (1) and (2):
Individual force-velocity relationships were obtained from the linear regression of force and velocity values (Rahmani et al., 2001; Yamauchi & Ishii, 2007). The following components were extracted from these individual F-v profiles: slope of the F-v line (SF-v), theoretical maximal force produced at null velocity (F0), which
corresponds to the extrapolated intercept with the force-axis, theoretical maximal velocity produced at zero load (v0), which corresponds to the extrapolated intercept
with the velocity-axis, and the theoretical maximal jumping power (jPmax) computed
by:
!"!"# = !!∙ !!
4 (4)
A spreadsheet was created in order to calculate the F-v and P-v profiles for each individual (see Appendix C). Total mass, push-off distance and jump height had to be entered in order to become the profile’s specific parameters (F0,v0,SF-v and jPmax)
3.2.4. Statistical analysis
The profile’s specific parameters from the test and re-test were compared to determine the reliability between the 2 sessions. The samples mean and standard deviation (SD), as well as the coefficient of variation (CV) and the interclass correlation coefficient (ICC) were determined for F0, v0, SF-v and jPmax. The
confidential interval was set at 95% (Hopkins et al., 2001).
3.3. Results
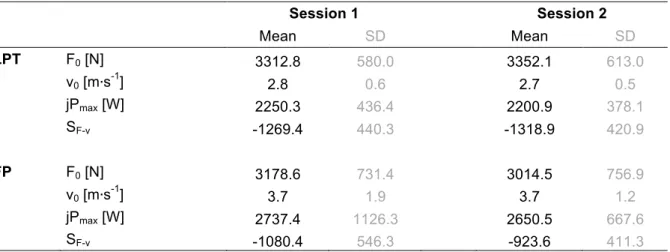
The four parameters from the F-v relationship for each measurement system and each session are represented in Table 1. Higher force values were attained with the LPT compared to the FP. However LTP measured lower v0 and jPmax parameter than
Tab. 1 : Mean absolute values and standard deviation of the F-v parameters for each session measured with the linear position transducer (LTP) and the force plate (FP).
Session 1 Session 2 Mean SD Mean SD LPT F0 [N] 3312.8 580.0 3352.1 613.0 v0 [m∙s-1] 2.8 0.6 2.7 0.5 jPmax [W] 2250.3 436.4 2200.9 378.1 SF-v -1269.4 440.3 -1318.9 420.9 FP F0 [N] 3178.6 731.4 3014.5 756.9 v0 [m∙s-1] 3.7 1.9 3.7 1.2 jPmax [W] 2737.4 1126.3 2650.5 667.6 SF-v -1080.4 546.3 -923.6 411.3
Table 2 shows the typical error, CV and ICC for the parameters for both measuring systems. The within-subject variability was higher when performance was measured with the force plate than with the linear transducer. In addition, the ICC values were much lower when measured with the FP (0.28 – 0.59) compared to the LPT (0.74 – 0.90).
Tab. 2 : Within-subject variability and interclass correlation coefficient of the F-v parameters for each measurement system.
Linear position transducer Force plate
Typical error CV (%) ICC Typical error CV (%) ICC
F0 206.5 N 6.2% 0.90 500.6 N 16.2% 0.59
v0 0.31 m∙s-1 11.3% 0.74 1.37 m∙s-1 37.5% 0.28
jPmax 159.9 W 7.2% 0.87 672.6 W 25.0% 0.51
SF-v 199.5 -15.4% 0.82 397.2 -39.6% 0.36
The F-v relationships were found to be linear for all trials, but great inconsistencies were revealed in the profiles derived from the FP data as shown in Figure 5. The coefficient of determination r2 averaged 0.92 ± 0.10 for the LPT and 0.63 ± 27 for the FP.
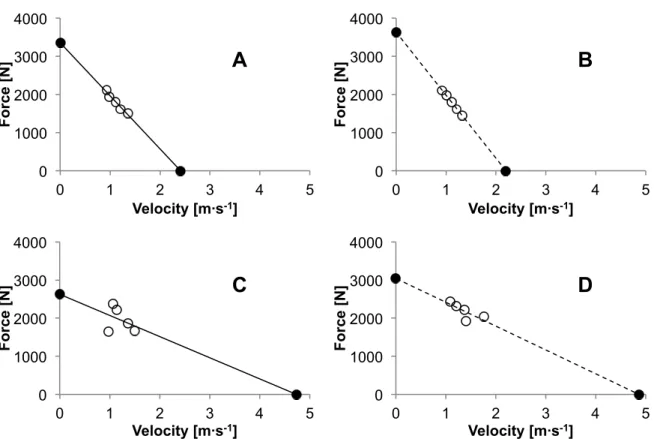
Figure 6 shows the F-v profile for a typical subject for the same sessions. Differences between LPT and FP are observed for the slopes of the regressions, which influences F0 and v0. Furthermore, the results of this subject vary much more when
recorded with the FP than the LPT. This was also representative of the whole group, as shown in Table 2.
Fig. 6 : F-v profiles of a typical subject for the same sessions implemented from the LPT (panel A and B) and the FP (panel C and D). Open circles represent the results at different loading conditions and filled circles the extrapolated F0 and v0. Continuous lines show the results of session 1 and the dashed
lines for session 2.
0 1000 2000 3000 4000 0 1 2 3 4 5 F o rc e [N ] Velocity [m·s-1]
A
0 1000 2000 3000 4000 0 1 2 3 4 5 F o rc e [N ] Velocity [m·s-1]B
0 1000 2000 3000 4000 0 1 2 3 4 5 F o rc e [N ] Velocity [m·s-1]C
0 1000 2000 3000 4000 0 1 2 3 4 5 F o rc e [N ] Velocity [m·s-1]D
0 0.2 0.4 0.6 0.8 1LPT_Session 1&2 FP_Session 1&2
r
2
Fig. 5 : Distribution of r2 values of the linear regression obtained with the linear position transducer (LPT) and the force plate (FP). Any outliers are illustrated with a black dot.
3.4. Discussion
The objective of this study was to test the reliability of the T-Force system, a linear position transducer, and the Quattro Jump system, a portable force plate. The main finding of this study was that the FP was not consistent in its results, whereas the linear position transducer showed low variability and moderate to good reliability. Jump heights from both devices were extracted and used to construct the individual force-velocity profile with Samozino’s computation method. Each parameter of the F-v relationships were compared with the retest and the analysis showed moderate to good repeatability for the T-Force device with ICC values between 0.74 to 90. Other authors reported similar ICCs for jump height, mean and peak power and power velocity measured by a LPT (Hansen et al., 2011; Hori et al., 2007). In addition to the ICC, the most common method of analysing reliability is the coefficient of variance. For the LTP measures, the CVs of all parameters ranged between 6.2 and 15.4%. This is higher than the range of 2.0 – 8.0% reported by the aforementioned authors (Hansen et al., 2011; Hori et al., 2007). It is, however, important to mention that our analysed parameters were not directly measured by the device like it is usually done in reliability studies. This could also be the explanation as to why our CV values differed slightly from those of Hansen et al. (2011) and Hori et al. (2007).
The Quattro Jump device did not deliver acceptable results. During the testing, subjects were often requested to repeat their jump, because of invalid jump height measurements. In addition, the analysis of the four parameters showed poor reliability. ICC values ranged between 0.28 and 0.59. The variability expressed in the CV ranged between 16.2 and 39.6%. This is much higher than what has been reported by other authors [CV: 3.1 – 6.6% (Hansen et al., 2011; Mauch et al., 2014)]. These inconsistent SJ results don’t support the use of jump height measurements from the Quattro Jump device in determining F-v profiles.
Another objective of this study was to test the protocol and to become familiar with the procedures and the test devices. By planning, organising and carrying out the study, valuable experience was gained. Moreover, testing the protocol made it possible to detect some weakness and modify them for the BMX force-velocity study. For example, the maximal loading condition was reduced to 80% BM instead of 100% BM.
In conclusion, this study suggests that the T-Force device is a reliable measuring system to assess loaded squat jump height in order to construct the individual force-velocity profiles. Therefore it should be preferred over the Quattro Jump device for the further BMX force-velocity study.
4. BMX study
4.1. Goals and research questions
The aim of this work is to investigate the transfer of muscle power and force-velocity properties from a simple, linear movement onto a complex, sport-specific, cyclic movement in trained BMX-athletes. In order to identify a transfer mechanism, the correlation between vertical jumps, BMX sprints and BMX starts on a ramp will be analysed based on the power-force-velocity relationships of the three actions.
Research questions
Is there a correlation between the maximal power output of the BMX sprints, BMX starts and the derived maximal power output of the vertical jump tests?
! cPmax sprint with jPmax
! cPmax start with jPmax
Do the various parameters of the F-v profiles from the BMX sprints, BMX starts and the vertical jump test correlate?
! T0 sprint, T0 start with F0
! Cad0 sprint, Cad0 start with v0
! ST-Cad sprint, ST-Cad start with SF-v
Are there specific parameters of the F-v profile, which favour the mean power (Pmean
30, Pmean start) or the end time (vmean 30, vmean start) of a 30-meter BMX sprint or a BMX
start?
! F0, v0, SF-v with Pmean 30, Pmean start
! F0, v0, SF-v with vmean 30, vmean start
Does vertical jump power (Pmax jump) favour sprint or start performance?
! jPmax with Pmean 30, Pmean start
4.2. Methods
4.2.1. Subjects
Ten male and three female BMX athletes from the Swiss national team selection pool volunteered and gave their informed consent to take part in this study. They all compete at the national and/or international level in either the junior or elite category. Their mean (± SD) age, height, body mass and body mass index (BMI) were 24.6 ± 2.6 years, 174.4 ± 8.0 cm, 72.2 ± 10.5 kg and 23.8 ± 1.9 kg∙m-2 respectively. Squat
training being part of their training routine, they were all familiar with dynamic squat exercises with additional load. All participants were healthy and no injuries were reported.
4.2.2. Study design
For each subject, three tests were conducted on the same day in the facilities of the Velodrome Suisse in Grenchen. Upon arriving at the performance lab, they were given instructions about the testing day and underwent anthropometric measurements. After an individual warm-up on a stationary bike, they first performed the jump test, followed by the BMX gate starts on the supercross ramp and finishing with the 30 m sprints on the flat. The testing of each subject lasted approximately 2.5 hours.
Vertical jump test
Before starting the testing, the subjects were free to perform some submaximal squat jumps with additional load and instructions about the test were given. Before beginning the test, push-off distance, body mass (BM) and jump position were measured. The push-off distance was necessary to calculate force, velocity and power with Samozino’s field method (Samozino et al., 2008). The subjects BM was used to calculate the additional loads used later in the test as well as for calculations using Samozino’s field method. Finally, the jump position at the start had to be prescribed, in order that every squat jump has the same push-off distance. This was done by placing a special apparatus underneath the subject’s hips in the individually chosen starting position. This apparatus stayed in position throughout the testing.