Intensive Care Med (2006) 32:919–922 DOI 10.1007/s00134-006-0161-2 B R I E F R E P O R T Karim Bendjelid Nicolas Schütz Peter M. Suter Jacques-Andre Romand
Continuous cardiac output monitoring after
cardiopulmonary bypass: a comparison with
bolus thermodilution measurement
Received: 25 August 2005 Accepted: 15 March 2006 Published online: 7 April 2006 © Springer-Verlag 2006
Electronic supplementary material The electronic reference of this article is http://dx.doi.org/10.1007/s00134-006-0161-2. The online full-text version of this article includes electronic supplementary material. This material is available to authorised users and can be accessed by means of the ESM button beneath the abstract or in the structured full-text article. To cite or link to this article you can use the above reference. The authors declare no conflict of interest (Financial and non-financial).
This work was performed in the Surgical In-tensive Care Division at the University Hos-pital of Geneva, Switzerland.
K. Bendjelid (u) · N. Schütz · P. M. Suter · J.-A. Romand
Geneva University Hospitals, Surgical Intensive Care Unit, Department of Anaesthesiology, Pharmacology and Surgical Intensive Care,
1211 Geneva 14, Switzerland e-mail: Karim.Bendjelid@hcuge.ch Tel.: +41-22-3827452
Fax: +41-22-3827455
Abstract Objective: The inter-changeability of continuous measure-ment of cardiac output (CO) with the traditional bolus method in patients after cardiopulmonary bypass (CPB) is uncertain. Design: Prospective observational clinical study. Setting: A 20-bed surgical ICU at a university hospital. Patients: Fourteen deeply sedated, ventilated, post-cardiac surgery patients, all equipped with a pulmonary artery catheter.
Inter-ventions: Six hours after the end
of the CPB, 56 simultaneous bolus and continuous measurements were compared by a linear regression analysis and Bland–Altman analysis. Bolus CO was estimated by aver-aging triplicate injections of 10 ml room-temperature NaCl 0.9%, deliv-ered randomly during the respiratory cycle. A stringent maximum differ-ence of 0.55 l min—1 (about 10% of the mean bolus measured) was considered as a clinically acceptable agreement between the two types of measurements. To be interchangeable the limits of agreement (± 2 SD of the mean difference between the
two methods) should not exceed the chosen acceptable difference.
Mea-surements and results: Continuous
was correlated with bolus CO, with a correlation coefficient of r2= 0.68. (p< 0.01). The Bland–Altman anal-ysis demonstrated an objective mean bias of 0.33± 0.6 l min–1 (confi-dence interval of –0.87 – 1.58) with 34% of measured values falling out-side of the clinically acceptable limits.
Conclusion: Our results suggest that,
in the first 6 h after CPB, continuous and bolus CO determinations are not interchangeable; one third of the values obtained by continuous CO fell outside the strict limits of clini-cally useful precision.
Keywords Cardiac surgery · Hypothermia · Swan–Ganz catheter Abbreviations BCO: Bolus cardiac output · CCO: Continuous measure-ment of cardiac output · CO: Cardiac output · CPB: Cardiopulmonary bypass · PAC: Pulmonary artery catheter
Introduction
The precise evaluation of hemodynamic variables is often necessary to manage unstable patients in a surgical intensive care unit. Among them, cardiac output (CO) monitoring allows assessment of cardiac function and the calculation of vascular resistance, global oxygen delivery
and consumption. The standard method for CO assessment still remains the intermittent determination using the bolus thermodilution technique (BCO), which has proven to be precise enough for clinical application [1]. Recently, a pulmonary artery catheter (PAC) equipped with a special thermal filament has allowed continuous cardiac output measurement (CCO) [2]. Compared to BCO, CCO has obtained promising results [2, 3].
920
To our knowledge few studies, with conflicting results, have investigated the interchangeability of CCO with BCO measurements in patients submitted to a cardiopulmonary bypass (CPB) [4, 5]. The aim of this prospective clinical study was to determine the comparability of CCO using an optical fiber catheter with the traditional BCO measure-ment in the early phase after cardiac surgery with CPB. The authors’ hypothesis was that mild hypothermic CPB may affect the accuracy of CCO measurement in the first few hours following CBP (unsteady-state thermal regula-tion) [5].
Materials and methods
The study was approved by our institutional ethics com-mittee. Only patients scheduled for coronary artery bypass graft (CABG) surgery were prospectively screened. Exclu-sion criteria were: (1) decreased left ventricular ejection fraction (< 45%) and (2) valvular disease. Postoperatively, patients presenting severe hemodynamic instability and/or bleeding greater than 100 ml/h were also excluded.
Postoperative management
Perioperative management was as previously de-scribed [6]. The CPB flow was set at 2 l min–1.m–1After surgery, the patients were placed on mechanical venti-lation. Body temperature, ECG and urine output were monitored throughout the postoperative period. Before the study period, patients were observed for at least 2 h to confirm hemodynamic stability, which was defined as a less than 10% change in heart rate, mean arterial pressure, CO and SvO2.
Hemodynamic measurements and study protocol
All pressure transducers were referenced to the mid-chest. The correct position of the PAC (CCOmbo, Edwards Lifesciences, Irvine, CA, USA) tip in West’s zone III was checked using a method previously described [7]. There-after, the PAC was connected to the monitor (Vigilance, Edwards Lifesciences, Irvine, CA, USA). Simultaneous measurements of CCO and BCO were taken. Values of CCO were obtained before BCO measurements, as CCO is interrupted during the bolus injection. BCO was estimated by averaging triplicate injections of 10 ml room-temperature NaCl 0.9%, delivered randomly during the respiratory cycle.
Statistical analysis
The results are expressed as mean ± standard deviation (SD). The values of CCO and BCO were compared by
linear regression. A Bland–Altman analysis was used to estimate the bias between the two methods. Bias, the lim-its of agreement (± 2 SD) and the percentage error were calculated [8]. The percentage error was calculated as the ratio between the limits of agreement (i.e., 2 SD of the bias) divided by the CO (calculated as the mean of both methods). In order to obtain results that would be clinically comparable, we determined using the method described by Critchley and Critchley [9] and LaMantia et al. [10] a max-imal limit of± 10% of the mean BCO measured as an ac-ceptable difference between the two measures. Statistical analyses were performed using Graph Pad Prism (Graph pad software V3, San Diego, CA, USA) for PC. A p value < 0.05 was considered statistically significant.
Results
Fourteen patients (11 males and 3 females, age 63± 9 years) were included in this study. The mean CPB duration was 106± 42 min and the aortic cross-clamp time 71 ± 33 min. Mean body temperature was 37± 0.6°C. The mean values of CCO and BCO were 5.8± 1.1 l min–1 (mini-mum 4.3, maxi(mini-mum 8.7) and 5.5± 0.9 l min–1(minimum 3.7, maximum 8.2) respectively. Thus, the limit of 0.55 l min–1(10% of the mean BCO) was used as an acceptable difference between the two measurements.
Fifty-six simultaneous measurements of CCO and BCO were obtained (4 measurements per patient every 30 min). Six measurements of BCO in 5 patients were excluded due to a signal defect. All measurements were performed between 4 h and 8 h after the end of CPB.
The mean and median differences between the two measurements were 0.33 (SD 0.6) l min–1, and 0.28 (range
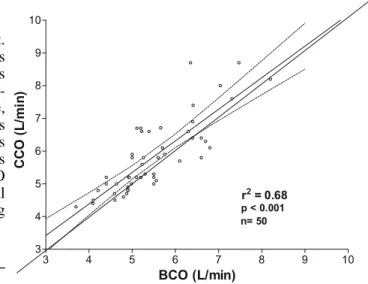
Fig. 1 Linear correlation between CCO and BCO. Linear regression
analysis (solid line), identity line value (dashed line) and 95% con-fidence intervals (dotted lines) are indicated
921
–0.8 to +2.35) l min–1, respectively. The comparison between CCO and BCO by linear regression shows a correlation coefficient r2= 0.68 (p< 0.01) (Fig. 1). The Bland–Altman analysis reveals a mean bias of 0.33
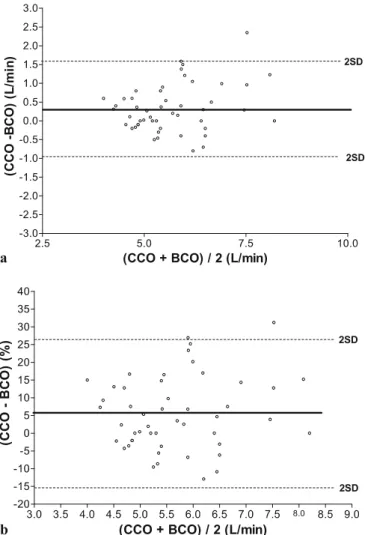
± 0.6 l min–1 (95% confidence interval –0.87 to 1.58) (Fig. 2a). The percentage error (see definition) was 22% [8]. To account for dependence in the data, we took the average of the four measures within each subject and found a nonsignificant difference in correlation and bias (Tukey’s multiple comparison test, p = 0.66; see electronic supplementary material). Seventeen measures (34%) fell out of the clinically acceptable range of 10% of mean BCO. The relative Bland–Altman analysis reveals a mean bias of 5.58± 10.3 % (95% confidence interval –15% to 26.2%) (Fig. 2b). Fifteen measures (30 %) fell out of
Fig. 2 a Bland–Altman analysis of agreement between CCO and
BCO. The middle solid line indicates the average differences be-tween the two methods (bias), while the outer dashed lines represent 2 SD. b Relative Bland–Altman analysis of agreement between CCO and BCO (bias in % calculated as (100×bias/mean CO of both meth-ods). The middle solid line indicates the average differences between the two methods (bias), while the outer dashed lines represent 2 SD
the clinically acceptable range of 10% of mean BCO. However, if a less strict clinically acceptable range (i.e., 20% of mean BCO) is chosen, only two measures (4%) fell out of the clinical acceptable range.
Discussion
The objective of the present study was to determine the comparability between CCO using an optical fiber catheter and traditional BCO measurement in patients after CABG involving CPB. The data show that CCO is reasonably cor-related to BCO (r2= 0.68; p< 0.01) but with a wide confi-dence interval (–0.87 to 1.58). Moreover, 34% of the val-ues were outside the clinically tolerable range of 10% dif-ference between the two methods.
Hemodynamic monitoring of patients undergoing car-diac surgery using PAC is safe and still largely used [11, 12]. However, even if CCO monitoring has no advantage over BCO regarding the risk of bacterial contamina-tion [13], continuous observacontamina-tion of cardiac funccontamina-tion by CCO allows immediate detection of changes in CO following (1) changes in mechanical ventilation setting, (2) an early undiagnosed hemorrhage and/or (3) a cardiac tamponade. Few studies have compared the continuous with the traditional bolus method in the post-operative period after cardiac surgery involving CPB. A French study including 44 patients scheduled for elective mitral and/or aortic valve surgery under mild hypothermic CPB showed a satisfactory correlation between CCO and BCO (r2= 0.83), with a bias of 0.066± 0.53 [4]. Bottiger and co-workers showed a good correlation and precision between CCO and BCO in 30 cardiac surgery patients before CPB and more than 45 min after hypothermic CPB (r2= 0.76; p< 0.01), but a lack of correlation in the early phase after CPB (r = 0.3) [14]. In the present investigation, we noted a correlation coefficient of 0.82 with a high mean bias, suggesting that CCO and BCO are not interchangeable. Indeed, 34% of all value obtained were outside a clinically tolerable range. Our data are in agreement with those of Zollner et al., who also studied patients after cardiac surgery and found that about 50% of all data points were outside a predefined clinical range [5]. It is essential to state that CCO assessment is an averaging technique. The value indicated by the device is a mean value reflecting the data collected in the past 3–6 min. Thus, more rapid changes in CO could not be reflected by CCO data with the current software version [15]. Others limits for such investigations have been well documented [16, 17, 18] in this patient popula-tion, including pulmonary artery thermal instability and background noise caused by the hypothermic CPB and mechanical ventilation. In addition, when comparing the two methods, the limits of agreement of their difference need to be larger than the limits of precision of the reference method [10]. Unfortunately, we have no better
922
mean for comparisons with new methods than the tradi-tional “standard” BCO, which has its own limitations and measurement error (10%, reproducibility 0.5 l min–1) [1]. Thus, we determined beforehand a maximal limit of 10% for the mean BCO (0.55 l min–1). To our knowledge, the study by Zollner et al. is the only published investigation reporting a similar comparison [5].
Some limitations of this work should be acknowledged. First, in view of the small sample size, its clinical rele-vance could be questioned. Second, the present study is limited by the fact that no measurements were performed in the late phase of CPB to investigate whether this ob-servation is time related and/or whether this phenomena persists after CPB. Third, in the present study, patients with decreased pre-operative left ventricular ejection
frac-tion (< 45%) and moderate and severe valvular disease were excluded, and the results may not be generalizable to this population. Fourth, as observed in our results, the conclusion of the present study is based on a strict clini-cally acceptable limit threshold of 10%. And undeniably, if the clinically acceptable limit chosen were fixed at 20% or higher the agreement between the two methods would be adequate. Finally, comparative data in cardiac surgical patients without CPB (beating heart) would also been ben-eficial to determine whether this observation is exclusively related to CPB.
In conclusion, the present study indicates that, com-pared to BCO measurement in the 6-h window after CPB, CCO assessment provides values which are beyond clini-cally useful precision of 10% in one third of cases.
References
1. Conway J, Lund-Johansen P (1990) Thermodilution method for measuring cardiac output. Eur Heart J 11 [Suppl I]:17–20
2. Yelderman ML, Ramsay MA, Quinn MD, Paulsen AW, McKown RC, Gillman PH (1992) Continuous ther-modilution cardiac output measurement in intensive care unit patients. J Car-diothorac Vasc Anesth 6:270–274 3. Boldt J, Menges T, Wollbruck M,
Ham-mermann H, Hempelmann G (1994) Is continuous cardiac output measurement using thermodilution reliable in the critically ill patient? Crit Care Med 22:1913–1918
4. Neto EP, Piriou V, Durand PG, Du Gres B, Lehot JJ (1999) Comparison of two semicontinuous cardiac output pul-monary artery catheters after valvular surgery. Crit Care Med 27:2694–2697 5. Zollner C, Goetz AE, Weis M,
Morstedt K, Pichler B, Lamm P, Kil-ger E, Haller M (2001) Continuous cardiac output measurements do not agree with conventional bolus thermo-dilution cardiac output determination. Can J Anaesth 48:1143–1147 6. Romand JA, Treggiari-Venzi MM,
Bichel T, Suter PM, Pinsky MR (2000) Hemodynamic effects of synchro-nized high-frequency jet ventilation compared with low-frequency inter-mittent positive-pressure ventilation after myocardial revascularization. Anesthesiology 92:24–30
7. Teboul JL, Besbes M, Andrivet P, Axler O, Douguet D, Zelter M, Lemaire F, Brun-Buisson C (1992) A bedside index assessing the reliabil-ity of pulmonary occlusion pressure measurements during mechanical ventilation with positive end-expiratory pressure. J Crit Care 7:22–29
8. Tibballs J, Hochmann M, Osborne A, Carter B (1992) Accuracy of the BoMED NCCOM3 bioimpedance cardiac output monitor during in-duced hypotension: an experimental study in dogs. Anaesth Intensive Care 20:326–331
9. Critchley LA, Critchley JA (1999) A meta-analysis of studies using bias and precision statistics to compare cardiac output measurement techniques. J Clin Monit Comput 15:85–91 10. LaMantia KR, O’Connor T, Barash PG
(1990) Comparing methods of mea-surement: an alternative approach. Anesthesiology 72:781–783
11. Jacka MJ, Cohen MM, To T, Devitt JH, Byrick R (2002) The use of and preferences for the transesophageal echocardiogram and pulmonary artery catheter among cardiovascular anesthe-siologists. Anesth Analg 94:1065–1071, table of contents
12. Sandham JD, Hull RD, Brant RF, Knox L, Pineo GF, Doig CJ, La-porta DP, Viner S, Passerini L, Devitt H, Kirby A, Jacka M (2003) A random-ized, controlled trial of the use of pulmonary-artery catheters in high-risk surgical patients. N Engl J Med 348:5–14
13. Myers ML, Austin TW, Sibbald WJ (1985) Pulmonary artery catheter infections. A prospective study. Ann Surg 201:237–241
14. Bottiger BW, Rauch H, Bohrer H, Motsch J, Soder M, Fleischer F, Mar-tin E (1995) ConMar-tinuous versus inter-mittent cardiac output measurement in cardiac surgical patients undergoing hypothermic cardiopulmonary bypass. J Cardiothorac Vasc Anesth 9:405–411 15. Siegel LC, Hennessy MM, Pearl RG
(1996) Delayed time response of the continuous cardiac output pul-monary artery catheter. Anesth Analg 83:1173–1177
16. Shellock FG, Riedinger MS, Bate-man TM, Gray RJ (1983) Thermod-ilution cardiac output determination in hypothermic postcardiac surgery patients: room vs ice temperature injectate. Crit Care Med 11:668–670 17. Bazaral MG, Petre J, Novoa R (1992)
Errors in thermodilution cardiac out-put measurements caused by rapid pulmonary artery temperature de-creases after cardiopulmonary bypass. Anesthesiology 77:31–37
18. Latson TW, Whitten CW, O’Flaherty D (1993) Ventilation, thermal noise, and errors in cardiac output measure-ments after cardiopulmonary bypass. Anesthesiology 79:1233–1243