Effect of Influenza Vaccination on Viral Replication and Immune Response
in Persons Infected with Human Immunodeficiency Virus Receiving Potent
Antiretroviral Therapy
Huldrych F. Gu¨nthard,1,4Joseph K. Wong,1,2 Celsa A. Spina,1,2Caroline Ignacio,1Shirley Kwok,3 Cindy Christopherson,3Jimmy Hwang,1
Richard Haubrich,1Diane Havlir,1 and Douglas D. Richman1,2
1Departments of Pathology and Medicine, University of California San Diego, School of Medicine, La Jolla,2San Diego Veterans Affairs Medical Center, San Diego, and3Roche Molecular Systems, Alameda, California;4University Hospital Zurich, Division of Infectious Diseases, Zurich, Switzerland
Nineteen patients infected with human immunodeficiency virus (HIV) with varying levels of viral suppression achieved with antiretroviral therapy were evaluated to determine whether trivalent influenza vaccine activated HIV replication. Humoral immune responses and CD4+ lymphocyte subsets were compared in 5 HIV-uninfected vaccinated subjects. Transient ele-vations of plasma HIV RNA levels (76–89 copies/mL) appeared within 2 weeks in 3 of 11 patients with!50 copies/mL at baseline. Sustained elevation in HIV plasma RNA was observed in 7 of 8 patients with baseline HIV RNA of150 copies/mL. HIV DNA decreased in patients with!400 RNA copies/mL at baseline and showed an HIV RNA increase after vaccination (n = 8) when compared with 8 patients with!50 copies/mL at baseline who lacked viral re-sponse to vaccination. Concurrent decreases in proviral DNA and memory phenotype CD4+ cells in association with increased plasma HIV RNA after vaccination in patients with!400 RNA copies/mL at baseline suggest that in vivo mobilization of the latently infected cell reservoir may occur during potent antiretroviral therapy.
A reservoir of latently infected CD4CD45RO1T cells har-boring replication-competent virus persists in human immu-nodeficiency virus (HIV)–infected patients who have achieved high-level viral suppression with potent antiretroviral therapy [1–3]. These latently infected memory cells turn over very slowly [4, 5], implying protracted decay of this virus pool. Activation of the latent cell reservoir in vitro upon T cell stimulation by various methods suggests that such activation of these cells might also occur in vivo and provides a rationale for evaluating therapeutic interventions that activate these cells and
poten-Received 6 July 1999; revised 28 October 1999; electronically published 8 February 2000.
Presented in part: 12th World AIDS Conference, Geneva, 28 June–3 July 1998 (abstract 21113); 6th Conference on Retroviruses and Opportunistic Infections, Chicago, 31 January–4 February, 1999 (abstract 337).
Informed consent was obtained from all patients who participated in this study, and human experimentation guidelines of the US Department of Health and Human Services and those of the University of California San Diego were followed in the conduct of clinical research.
Grant support: Swiss National Science Foundation (84AD-046176, H.F.G.); VA Career Development Award (J.K.W.); VA Merit Award (C.A.S.); NIH (AI 43752, J.K.W.; AI 27670, AI 38858, AI 36214, Center for AIDS Research; AI 29164); Research Center for AIDS and HIV Infec-tion of the San Diego Veterans Affairs Medical Center.
Reprints or correspondence: Dr. Huldrych Gu¨nthard, University Hospital of Zurich, Dept. of Medicine, Division of Infectious Diseases and Hospital Epidemiology, Ra¨mistrasse 100, CH-8091 Zu¨rich, Switzerland (huldrych .guenthard@dim.usz.ch).
The Journal of Infectious Diseases 2000; 181:522–31
q 2000 by the Infectious Diseases Society of America. All rights reserved.
0022-1899/2000/18102-0016$02.00
tially accelerate clearance of virus. The influenza virus and tet-anus toxoid vaccines, both of which are T cell–dependent com-mon recall antigens, have been shown to induce T cell activation and type 1 cytokine production [6], enhance HIV isolation from peripheral blood mononuclear cells (PBMC) of HIV-infected patients, increase viral burden in lymphoid tissue, and induce transient increases in HIV-1 viral load after immunization [7–11]. In addition, the in vitro infectability of PBMC from HIV-uninfected subjects is augmented after immunization with tetanus toxoid vaccine [11]. PBMC from such uninfected in-dividuals show a higher proportion of CD45RO1CD4 memory cells and a decrease of CD45RA1naive CD4 cells after 6 days of ex vivo stimulation with influenza antigens [12].
The increase of HIV RNA levels after influenza vaccination can be explained by several mechanisms. Vaccination may in-duce expansion of permissive target cells and activate latently infected quiescent CD45RO1memory CD4 cells. Alternatively, it could upregulate chronically infected, virus-producing cells nonspecifically through the release of activating cytokines. To obtain insight into the relative contributions of these mecha-nisms, we studied the effects of influenza vaccination in HIV-infected patients who had either undetectable plasma RNA levels, low-level plasma viremia (50–400 RNA copies at base-line), or HIV RNA levels1400 copies/mL.
Patients and Methods
Patients. Patients were prospectively enrolled in the study dur-ing September 1997 at the San Diego Veterans Affairs Health Care
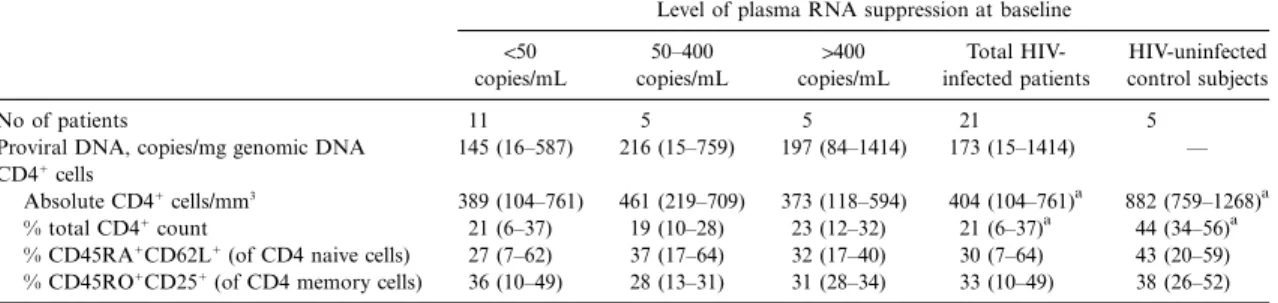
Table 1. Baseline characteristics of study subjects.
Level of plasma RNA suppression at baseline
!50 copies/mL 50–400 copies/mL 1400 copies/mL Total HIV-infected patients HIV-uninfected control subjects No of patients 11 5 5 21 5
Proviral DNA, copies/mg genomic DNA 145 (16–587) 216 (15–759) 197 (84–1414) 173 (15–1414) — CD41cells
Absolute CD41cells/mm3
389 (104–761) 461 (219–709) 373 (118–594) 404 (104–761)a 882 (759–1268)a % total CD41count 21 (6–37) 19 (10–28) 23 (12–32) 21 (6–37)a 44 (34–56)a % CD45RA1CD62L1(of CD4 naive cells) 27 (7–62) 37 (17–64) 32 (17–40) 30 (7–64) 43 (20–59) % CD45RO1CD251(of CD4 memory cells) 36 (10–49) 28 (13–31) 31 (28–34) 33 (10–49) 38 (26–52) NOTE. Data are mean (range). HIV, human immunodeficiency virus.
a
Healthy controls and all HIV-infected patients (n = 19) are significantly different (P!.05).
System (VA) according to institutional review board guidelines. All subjects had consented to receive the annual influenza vaccine. For HIV-infected subjects, entry criteria included age118 years,
treat-ment with triple- or double-drug antiretroviral therapy, HIV plasma RNA!400 RNA copies/mL for at least 3 months before
vaccination, and no opportunistic infection within the previous 3 months. HIV-negative controls were118 years of age and without
serious acute or chronic illness. Blood was collected at baseline (immediately before vaccination with trivalent influenza vaccine [season 1997/98; Wyeth-Ayerst Research Laboratories, St. Davis, PA]) and at weeks 1, 2, 4, and 6–8. Drug interruptions and interim infections were noted. At all study visits, HIV RNA was quanti-tated from plasma with the Amplicor Monitor assay (Roche Mo-lecular Systems, Somerville, NJ) [13]. The Roche ultrasensitive as-say, with a limit of detection of 50 copies/mL, was performed on plasma samples with values !400 copies/mL. Although patients
were required to have a recent viral load of!400 copies/mL, HIV
plasma RNA was1400 copies/mL in 3 subjects at baseline. Patients
were segregated into 3 groups according to their baseline RNA levels: group 1, “suppressed,” (baseline RNA level!50 copies/mL);
group 2: “partially suppressed” (baseline RNA level: 50–400 copies/ mL); and group 3: “unsuppressed” 1400 copies/mL at baseline.
Five HIV-uninfected volunteers were enrolled as controls.
PBMC-associated proviral HIV DNA. Proviral DNA levels were quantitated by use of a prototype assay developed at Roche Molecular Systems, Alameda, CA [14]. PBMC pellets were thawed and washed once with 1 mL of Specimen Wash Solution (Roche Molecular Systems). The cells were pelleted by centrifugation at 16,000 g for 3 min and lysed with a buffer that contains proteinase K and an internal quantitation standard (QS). The QS is a plasmid DNA that has the same primer binding sites as the target but contains a different probe region, similar to that described by Mulder et al. [13]. After heat inactivation of the proteinase K, the samples were amplified by use of the Amplicor Monitor v1.5 HIV-1 master mix (Roche Molecular Systems). Detection was performed by use of microwell plates coated with HIV and QS specific probes [13]. Total DNA was determined with Hoechst dye as recom-mended by the manufacturer (Amersham Pharmacia Biotech, Pis-cataway, NJ). The final DNA concentration was multiplied by 2 to correct for the 2-fold reduction in the binding of Hoechst dye to single-stranded DNA. The final number reported is HIV-1 DNA copies/mg of total DNA.
Hemagglutination inhibition assay. Serum antibodies to influ-enza antigens were measured in a standard hemagglutinin
inhibi-tion assay [15]. To remove nonspecific inhibitors, serum was treated with receptor-destroying enzyme (RDE; Bio Whittaker, Walkers-ville, MD). Twofold serum dilutions starting at 1 : 10 were tested against monovalent antigens B/HARBIN/07/94, A/JOHANNES-BURG/82/96, and A/NANCHANG/933/95 (4 HA units/0.025 mL antigen [Centers for Disease Control, WHO Influenza Center, At-lanta, GA]).
T cell subset phenotyping. T cell subsets were assessed in whole blood specimens within 4 h of collection into EDTA anticoagulant. Multicolor fluorescence-activated cell sorter (FACS) analysis was performed on a FACScan instrument (Becton Dickinson Cyto-metry Systems, San Jose, CA) with use of a CD4 (bright) anchor gate (CyChrome-conjugated antibodies) in conjunction with pre-titrated, premixed fluorescein isothiocyanate (FTIC)/phosphati-dylethanolamine (PE)–conjugated monoclonal antibody combi-nations that included CD45RA/CD62L, CD45RO/CD25, (Phar-Mingen, San Diego, CA).
Statistics. Correlations were calculated by the least-squares method. Statistical analyses were performed by use of SPSS version 6.1 (SPSS, Irvine CA). Analysis of variance, 2-tailed t-test, Wil-coxon rank sum test, and x2
test were used
Results
Patient characteristics. Eleven subjects had baseline RNA !50 copies/mL (group 1), 5 had 50–400 RNA copies/mL (group 2), and 3 had1400 copies/mL (group 3). Group 1 and group 2 patients all received triple combination therapy containing a protease inhibitor (indinavir,n = 15; nelfinavir,n = 1) and either AZT/3TC (n = 9), d4T/3TC (n = 5), efavirenz/3TC (n = 1), or nevirapine/d4T (n = 1). In group 3, 1 patient was taking rito-navir/saquinavir, 1 was taking AZT/3TC, and 1 had all anti-retroviral therapy stopped because of drug toxicities 4 weeks before vaccination. The mean baseline CD41cell counts for the entire patient cohort was 404 cells/mm3; baselines were sim-ilar among the 3 groups (table 1). The mean duration of un-detectable plasma HIV RNA levels (!400 RNA copies/mL) was 8 months (range, 3–14 months) for group 1 and 7 months (range, 3–9 months) for group 2. The average age of HIV-infected patients and healthy controls was 43 (range, 28–63 years) and 42 years (range, 35–54 years), respectively, and was similar among groups 1,2, and 3. These baseline characteristics
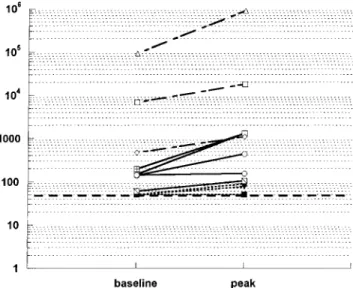
Figure 1. Logarithmic scale of plasma RNA at baseline and peak viremia at weeks 1 and 2 from 19 patients infected with human im-munodeficiency virus. Horizontal, thick broken line represents sensi-tivity of the assay when limit of detection was set at 50 copies/mL. Group 1: dotted lines, n = 11; group 2: solid lines,n = 5; group 3: dashed lines,n = 3.
were not statistically significant between groups. All but 2 of the HIV-infected subjects and all but 1 of the HIV-uninfected subjects had received influenza vaccination within the last 2 years before study initiation. Therapy was not changed during the study period except for 2 patients from group 3 at week 4 because of poor control of viremia. Two patients with 1400 RNA copies/mL at baseline were not included into group 3 for RNA, DNA, and lymphocyte subset analysis because of non-adherence but were included in the analysis of humoral immune response to influenza vaccination. In 1 patient of group 1, tho-racic herpes zoster was newly diagnosed on the third study week. No further infections or other diseases were observed.
HIV-1 plasma RNA. In group 1 (baseline RNA levels!50 copies/mL), 3 patients showed detectable RNA levels of 76 (n = 1) and 89 copies/mL (n = 2) at week 1 and at week 2 after vaccination, respectively (figure 1). HIV plasma RNA from those 3 patients was only transient and not detected again dur-ing the 8-week study period or the subsequent 8 months of follow up. The remaining 8 patients from group 1 had unde-tectable plasma RNA levels for the entire study period, with the exception of 1 subject who failed therapy at week 8 because of admitted nonadherence (5349 HIV RNA copies/mL; figure 2).
In group 2, 4 of 5 patients experienced a plasma RNA in-crease within the first 2 weeks after vaccination (3 with>0.5 log, 1 with 0.25 log); the fifth patient had an increase of 0.9 log at week 4 (figure 1). RNA increases were sustained at week 8 in 4 of the 5 patients (3 with>0.5 log, 1 with 0.3 log; figure 2). At week 8, treatment regimens in these individuals were changed, rendering subsequent data unsuitable for analysis.
All 3 patients from group 3 showed RNA increases that peaked at week 1 after influenza vaccination (1 with 1 log10, and 2 with 0.4 log10). At week 2, plasma viremia declined in all 3 patients. However, by week 4, plasma viremia increased above baseline in 2 of the 3 patients (0.5–0.7 log10; figure 2). Therapy was changed in 1 patient, and the subject with the highest HIV RNA increase (10-fold) restarted a new “salvage” regimen after having been off treatment for 8 weeks. Therapy of the third patient in group 3 was changed at week 8.
Vaccine-induced elevation in HIV RNA was correlated with baseline RNA levels. None of the 11 patients from group 1, but 4 of 8 patients in groups 2 and 3 showed a 0.5 log10increase in HIV RNA at weeks 1 or 2 (P = .004). Seven of 8 patients from groups 2 and 3 and only 3 of 11 patients in group 1 showed any detectable increase in HIV RNA (P = .007). There was a linear relationship between baseline HIV RNA and HIV RNA at weeks 1 or 2 (P = .002) that was independent of baseline CD41count (P = .5).
Proviral DNA. At baseline, patients in group 1 (!50 RNA copies/mL) had the lowest proviral DNA level, with a mean of 145 copies/mg genomic DNA (range, 16–587 copies/mg). The means of groups 2 and 3 were higher: 216 (range, 15–759 copies/ mg) and 197 (range, 84–1414 copies/mg) HIV DNA copies/mg,
respectively. When patients were stratified based on their pat-tern of HIV plasma RNA response to vaccination, no change in proviral DNA levels was observed in the 8 patients who had no measurable plasma viremia over the 8-week study period (figure 3A). The 3 patients who had a low but measurable HIV RNA increase at weeks 1 or 2 after vaccination showed a slight decrease of PBMC-associated proviral DNA at weeks 2 and 4 that returned to baseline levels by week 8. A similar pattern of HIV response was found in patients with a baseline plasma viremia of 50–400 copies/mL. These 8 patients showed a mean decrease from baseline of257 DNA copies/mg genomic DNA (range,2185 to 186 copies/mg) at week 2 and a further re-duction to283 DNA copies/mg genomic DNA (range, 2289 to170 copies/mg) from baseline at week 4 (figure 3B). However, the observed decline in HIV DNA did not reach significance at either week 2 (P = .15) or week 4 (P = .1), when compared with patients from group 1 (figure 3A). Subjects with baseline plasma viremia1400 copies/mL displayed the opposite pattern of response, with a mean proviral DNA increase of 84 copies/ mg genomic DNA (range,21 to 1248 copies/mg) at week 2, increasing to 317 copies/mg genomic DNA at week 4 (range, 218.5 to 1977 copies/mg; figure 3C). When the mean change of proviral DNA in this third patient group was compared with that of 8 patients with!400 RNA copies at baseline and an RNA response upon vaccination (figure 3B), borderline sig-nificance between the groups was reached for weeks 2 and 4 (P = .07); however, no significant difference was seen in
com-Figure 2. Change in log10plasma RNA baseline levels for the time of study period. Arrows indicate time points of sampling. Dotted lines represent patients from group 1 (baseline RNA levels !50 copies/mL,n = 11); solid lines patients from group 2 (baseline RNA levels 50–400 copies/mL,n = 5); and dashed lines patients from group 3 (baseline RNA levels1400 copies/mL,n = 3). Asterisks represent time points when antiretroviral therapy was changed in individual patients.
Figure 3. Change in proviral DNA from baseline (copies/mg of genomic DNA). A, Mean proviral DNA changes from baseline in 8 patients from group 1 (!50 human immunodeficiency virus [HIV] RNA copies/mL of plasma at baseline) with no detectable RNA during the entire study. B, Mean proviral DNA changes in patients with!400 RNA copies/mL at baseline but in whom an RNA increase after vaccination was seen (n = 8). C, Mean of proviral DNA change in patients with1400 plasma HIV RNA copies/mL at baseline (n = 3). Error bars represent the standard error of the mean. Baseline DNA levels for panels A–C are given on top of each graph. It should be noticed that the y-axis scale of panel C is 4-fold larger than that in panels A and B.
parison with the patient group that maintained undetectable RNA levels over the study period (figure 3A,P = .13).
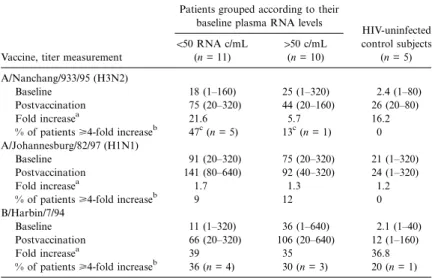
Hemagglutination inhibition antibody response. Titers to all 3 influenza virus antigens increased after vaccination in all groups (table 2). Hemagglutination inhibition antibody (HAI) response of healthy controls was not stronger than that of the HIV-infected patients. The immune response against A/NAN-CHANG/933/95 (H3N2) was stronger in subjects with unde-tectable plasma viremia (!50 copies/mL) at baseline, compared with patients with detectable plasma HIV RNA (P = .06; table
2). The response to A/JOHANNESBURG 82/97 (H1N1) was weak in all the groups; only 2 of the 19 HIV-infected patients and none of the healthy controls had a >4-fold increase in antibody titer. Approximately one-third of HIV-infected sub-jects showed a>4-fold increase against B/HARBIN/7/94 that was distributed evenly among suppressed and unsuppressed patients. At week 1 after vaccination, 6 of 11 patients who developed a>4-fold increase in HAI antibody titer against at least 1 of the 3 antigens tested also showed an increase in plasma viremia, whereas only 2 of 8 patients with a!4-fold increase
Table 2. Hemagglutination antibody (HAI) titers in human immundeficiency virus (HIV)–infected patients at baseline and 4 weeks postvaccination, fold increase in antibody titers, and proportion of individuals with a 4-fold increase in antibody titer after influenza vaccination titer.
Vaccine, titer measurement
Patients grouped according to their baseline plasma RNA levels
HIV-uninfected control subjects (n = 5) !50 RNA c/mL (n = 11) 150 c/mL (n = 10) A/Nanchang/933/95 (H3N2) Baseline 18 (1–160) 25 (1–320) 2.4 (1–80) Postvaccination 75 (20–320) 44 (20–160) 26 (20–80) Fold increasea 21.6 5.7 16.2
% of patients>4-fold increaseb 47c(n = 5) 13c(n = 1) 0 A/Johannesburg/82/97 (H1N1)
Baseline 91 (20–320) 75 (20–320) 21 (1–320)
Postvaccination 141 (80–640) 92 (40–320) 24 (1–320)
Fold increasea 1.7 1.3 1.2
% of patients>4-fold increaseb
9 12 0
B/Harbin/7/94
Baseline 11 (1–320) 36 (1–640) 2.1 (1–40)
Postvaccination 66 (20–320) 106 (20–640) 12 (1–160)
Fold increasea 39 35 36.8
% of patients>4-fold increaseb
36 (n = 4) 30 (n = 3) 20 (n = 1) NOTE. Data are mean (range) unless otherwise indicated.
a
Mean of ratios between individual post/prevaccination titers. If subject’s baseline titer was noninhibiting (!1 : 20) and increased to 1 : 20 after vaccination, the ratio would be 20.
b
Percentage of patients who had at least a 4-fold increase of HAI titer when baseline titer was clearly defined. If a baseline titer of!1 : 20 increased to 1 : 20 after vaccination, such an
increase would not be counted as 4-fold because exact baseline titer was not known
c
, x2
test; hemagglutination inhibition titers are expressed as geometric means. P = .06
in antibody titer showed an increase in viral RNA (P = .06). The mean HIV RNA increase in the 11 patients who had a significant increase in antibody titer was 0.3 log10, compared with only 0.003 log10viral increase in the group of 8 patients who lacked an increase in HAI titer (P = .07).
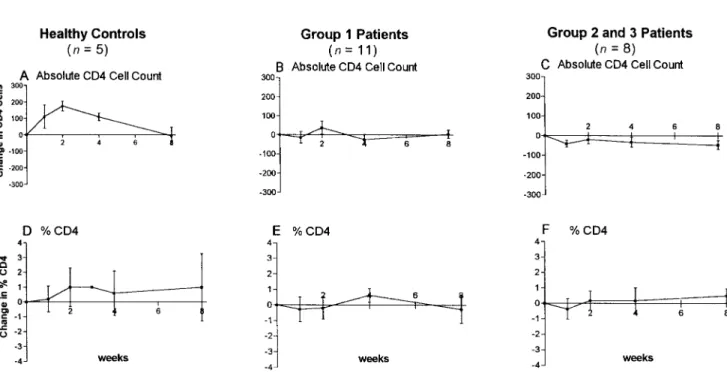
Lymphocyte subsets. In HIV-uninfected subjects (n = 5), the mean increase in absolute CD41cell count peaked 2 weeks after vaccination and returned to baseline values by week 8 (figure 4A). A similar pattern was found for changes in per-centage CD41cells (figure 4B). The CD4 naive phenotype cells (CD45RA1CD62L1) dropped transiently at weeks 1 and 2 and returned to near baseline by weeks 4–8 (figure 4C). In parallel, the mean percentage of activated CD4 memory cells (CD45RO1CD251) increased at weeks 1–2 and returned to near baseline by week 8 (figure 4D).
Changes in peripheral CD41lymphocyte subsets from base-line in the 19 HIV-infected patients were significantly distinct (P!.05) from those in healthy controls at weeks 1, 2, and 4 (figure 4A–H, see asterisks). Total CD41cell percentage and absolute count did not change over time in the HIV-infected patients, nor did the CD45RA162L1naive cell subset of CD41 cells. However, in contrast to the increase in percentage of ac-tivated CD4 memory cells (CD45RO1CD251) seen in the healthy controls at weeks 1–2, a significant decrease in this CD41cell subset occurred in the HIV-infected subjects at weeks 2 and 4 (figure 4H). When peripheral CD41lymphocyte subset response patterns were stratified according to baseline plasma HIV RNA levels, patients with !50 RNA copies at baseline
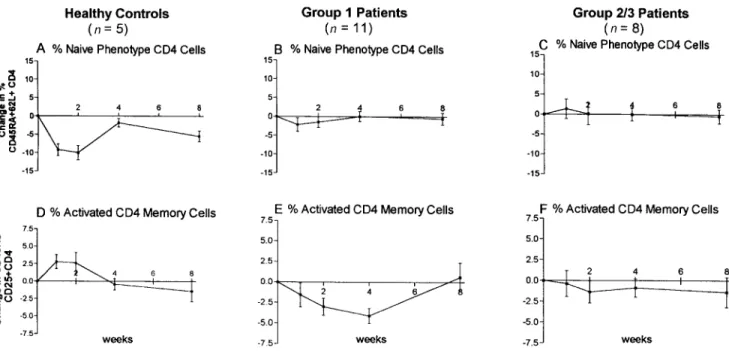
(group 1,n = 11) showed a response more like that observed in the HIV-uninfected controls (figure 5A, B, D, and E and figure 6A, B), rather than that seen in patients with detectable plasma viremia at baseline (group 2 and 3,n = 8, figure 5C, F and figure 6C). Patients from group 1 showed a significant (P!.05) decrease of activated CD4 memory cells at weeks 2 and 4 (figure 6E) compared to healthy controls, in which an increase was seen at weeks 1 and 2 (figure 6D). Patients in group 2 showed a similar decrease, and patients from group 3 had no change. Figure 6F summarizes the mean changes of group 2 and group 3 patients. The observed changes in lym-phocyte subsets between patient groups 1, 2, and 3 were not statistically significant.
Discussion
Previous studies have established that influenza vaccination can increase HIV replication in patients with uncontrolled or partially controlled viral replication [6–10]. However, there are also various published reports in which plasma viremia did not increase after vaccination [16–21]. A detailed analysis of all of these studies by Fuller and colleagues has revealed that such a discrepancy is probably the result of less-frequent sampling and that transient plasma HIV RNA increases, which have been reported to occur mostly during the first or second week after vaccination, were simply missed [21]. We found that the fre-quency and magnitude of viral RNA response to influenza vac-cination was dependent on plasma RNA levels at baseline and,
Figure 4. Mean changes from baseline in CD41lymphocyte subsets. Error bars represent standard error of the mean. Change in healthy controls (n = 5): (A) absolute CD4 count (cells/mm3); (B) % CD4 count; (C) % CD45 RA162L1naive CD4 cells; (D) % CD45RO1CD251memory CD4 cells. Change in all human immunodeficiency virus–infected patients (n = 19): (E) absolute CD4 count (cells/mm3); (F) % CD4 count; (G) % CD45 RA162L1naive CD4 cells; (H) % CD45RO1CD251memory CD4 cells. Asterisks represent time points when mean changes significantly differed between healthy controls and HIV-infected patients (P!.05).
furthermore, was positively correlated with the ability to induce a humoral immune response (>4-fold increase in HAI antibody titers,P = .06). In theory, potent antiretroviral therapy should protect cells from a new infection; however, it will not stop RNA transcription or production of virions from cells infected before initiation of therapy. Therefore, increases in HIV plasma RNA after vaccination, seen in subjects with undetectable vi-remia at baseline, would be caused by either the upregulation
of viral production from low levels of transcription in chron-ically infected cells or by the activation of latent HIV-1 from resting CD4 memory cells.
The greatest increase of plasma HIV RNA after vaccination was detected in patients from group 3 who had poorly con-trolled, or unconcon-trolled, viremia at baseline (figures 1 and 2). In addition, these subjects showed an increase in mean levels of proviral DNA up to 4 weeks after vaccination (figure 3C).
Figure 5. Comparison of absolute and percentage CD41cell response patterns between healthy controls, patients with undetectable plasma RNA levels at baseline (group 1,n = 11), and patients with150 RNA copies/mL at baseline (groups 2 and 3,n = 8). CD41absolute cell counts in: (A) healthy controls; (B) group 1 patients; and (C) group 2 and group 3 patients. % CD4 cells in: (D) healthy controls; (E) group 1 patients; and (F) group 2 and group 3 patients.
Such findings are consistent with an increase in activated lym-phocytes after influenza vaccination and subsequent infection of these new target cells. The other end of the spectrum is represented by the 8 subjects from group 1 who had no de-tectable plasma HIV RNA and no change in proviral DNA during the study period. In these subjects, the level of viral replication and the number of chronically infected cells before vaccination were very low or nonexistent, rendering detectable upregulation of RNA expression unlikely. In these subjects, potent antiretroviral therapy presumably blocked new infec-tions by virus produced from activated, latently infected lym-phocytes. Of note are the 3 patients from group 1 with a tran-sient RNA increase and the 5 patients from group 2 who were relatively suppressed at baseline but showed RNA increases after vaccination in 4 of 5 subjects. In these combined 8 subjects, a decrease of proviral DNA at weeks 2 and 4 was detected (figure 3B) and was accompanied by a decrease in CD45RO1 CD4 memory cells.
Such observed drops in proviral DNA and numbers of ac-tivated CD4 memory cells, in association with induction of increased plasma viremia after vaccination, might have several explanations. First, latently infected, resting CD4 memory cells (CD45RO1) could have been lost after activation by influenza vaccination, resulting in reduced levels of PBMC-associated proviral DNA. In patients with low levels of ongoing viral replication (!400 copies/mL at baseline), plasma RNA increases probably resulted from upregulation of viral production from chronically infected cells or from activation of latently infected
cells. Antiretroviral therapy was then largely successful in pre-venting new infections of CD41cells; and the destruction rate of chronically infected and activated latent cells by the immune system exceeded the rate of new infection. In agreement with such an interpretation is a recent report by Chun et al., de-scribing a reduced frequency of latently infected, quiescent CD4RO1memory cells in patients enrolled in a cross-sectional study treated with IL-2 and potent antiretroviral therapy when compared with patients treated with potent antiretroviral ther-apy alone [22]. However, it has to be kept in mind that the 2 studies differed in design and methods and therefore are only partially comparable
Alternatively, observed drops in cell-associated viral DNA might represent a dilutional phenomenon in which the fre-quency of PBMC-harboring HIV was reduced because of the expansion of uninfected T cell subsets or the preferential re-distribution of HIV-infected cells. The fact that HIV proviral DNA, as well as CD41memory cells, returned to baseline levels by week 8 could also be explained by ongoing low-level viral replication [23–24] within a different compartment outside the peripheral circulation and later redistribution events or by sim-ple redistribution of transiently sequestered, latently infected CD4 memory cells.
In uninfected control subjects a distinct response pattern of T cell phenotype changes was observed after influenza vacci-nation (figure 4A–D). It consisted of a transient increase in the absolute number and percentage CD41lymphocytes and in the proportion of activated memory CD4 cells (CD45RO1
Figure 6. Comparison of % CD45RA162L1CD4 naive and % CD45RO1CD251CD4 memory phenotype response patterns between healthy controls, patients with undetectable plasma RNA levels at baseline (group 1,n = 11), and patients with150 RNA copies/mL at baseline (groups 2 and 3,n = 8). % CD45RA162L1CD4 naive cells in: (A) healthy controls; (B) group 1; and (C) groups 2 and 3. % CD45RO1CD251CD4 memory cells in: (D) healthy controls; (E) group 1; and (F) groups 2 and 3.
CD251), along with a transient decrease in the proportion of naive CD41cells (CD45RA162L1).
The response pattern seen in HIV-infected patients differed considerably (figure 4E–H) and seemed to be dependent on the level of suppression of viral replication at baseline. In patients with the most complete suppression of viral replication (group 1), changes in absolute CD41cell numbers and in proportions of CD4-naive cells resembled those seen in the HIV-uninfected subjects (figure 5A, B, D, E and figure 6A, B), whereas the T cell subset patterns of patients with 150 RNA copies/mL at baseline looked distinct (figure 5C, F and figure 6C). Of par-ticular interest was the observation that the proportion of mem-ory CD4 cells transiently declined in all HIV-infected patients, contrary to the increases seen in the HIV-uninfected controls. In subjects with chronic HIV infection, CD4 memory cell loss and dysfunction is common; therefore, specific influenza recall antigen activation and clonal expansion are less likely to occur. In addition, if such antigen-specific memory cells harbored la-tent HIV infection, they might be lost on activation and virus production because of direct cytopathology by HIV or lysis by cytotoxic effector T cells. Such a mechanism would also explain the parallel decrease observed in HIV proviral DNA. In con-trast, redistribution of lymphocyte subsets could also account for these observations. In HIV-infected patients, memory CD4 cells trafficking to regional lymph nodes could become infected with HIV during response to influenza antigen stimulation and die within the tissue microenvironment without exiting into the peripheral circulation, or responding CD41cells could become
“trapped” for extended time periods because of inappropriate expression of adhesion molecules in HIV-infected nodes.
It has been shown that humoral immune responses in HIV-infected patients are weaker than those in healthy controls [7, 25] and are proportional to the levels of CD41cells in peripheral blood. The patients in our study showed an HAI response to influenza virus antigens in the range of those previously re-ported by others [7, 16, 17, 21, 25]. However, we found that patients with undetectable plasma viremia at baseline showed a stronger humoral immune response (P = .06) against 1 HA antigen [A/Nanchang/933/95 (H3N2)] than did patients who where not virologically suppressed (table 2). The better anti-body response of patients without viremia was independent of their CD4 cell count. A recently published study found similar results [21]. This finding, together with our observation that the response pattern of peripheral lymphocyte subsets of pa-tients with undetectable baseline RNA levels resembled those of uninfected subjects, suggests that control of viral replication alone can significantly improve humoral, and maybe cellular, immune function in HIV-infected patients before any significant increases in peripheral CD41cell numbers. In our HIV-unin-fected control group, HAI antibody response was poor, even though prevaccination influenza antibody status was compa-rable (80% of HIV-infected and healthy controls) and the same vaccine was used.
The transient increases in plasma RNA, after vaccination, returned to baseline in group 1, but not in group 2 and group 3, subjects. Whether persistence of increased viremia in some
patients was the direct result of influenza vaccination or because of chance therapeutic failure cannot be answered, because ther-apy is less likely to succeed in patients with ongoing low-level plasma viremia (50–400 copies/mL) [26–28]. However, a pre-vious study of patients receiving influenza vaccination showed a significant increase in HIV plasma RNA 1 month after vac-cination and decreased CD41cell counts after 3 months, com-pared with nonvaccinated, HIV-infected subjects [10]. Small sample size and the short duration of follow up in our cohort does not permit us to address the question of benefit versus risk of influenza vaccine in different patient groups.
In summary, our study showed that influenza vaccination increased plasma HIV RNA levels in patients on potent anti-retroviral therapy who had!400 RNA copies/mL at baseline. The frequency and magnitude of HIV RNA induction was dependent on baseline viral load and was more likely to occur in patients who were capable of mounting a humoral immune response to vaccination. In conjunction, the humoral immune response to influenza vaccination was substantially improved by suppression of viremia, independent of CD41cell levels. Furthermore, the transient drop of PBMC-associated proviral DNA with a parallel decrease in CD45RO1CD4 memory cells, in patients with a low baseline viral load (!400 copies/mL) and an RNA increase upon vaccination, suggested that this phe-nomenon either represented the activation and killing of la-tently infected, quiescent CD4 memory cells, the killing of chronically infected cells, or the redistribution of CD41cells harboring proviral DNA. In formulating better therapeutic strategies, establishing the potential for activation and mobi-lization of the latent reservoir is of major conceptual impor-tance. The results of this study support the feasibility of such an approach.
Acknowledgments
We thank the nursing staff, especially Sylvia Zellous and John Ford, and the physicians of the Special Infectious Disease Clinic of the San Diego VA Health Care System for their support, Jerry Wopschall, Nancy Keating, Sara Albanil, Neil Sekiya, and Eileen Bessent for ex-cellent laboratory support, J. Guatelli and N. Riggs for technical ad-vice, the patients for their commitment and reliable participation, and S. Wilcox, D. Smith, and M. Biedermann for administrative assistance.
References
1. Finzi D, Hermankova M, Pierson T, et al. Identification of a reservoir for HIV-1 in patients on highly active antiretroviral therapy. Science 1997; 278:1295–300.
2. Wong JK, Hezareh M, Gu¨nthard H, et al. Recovery of replication-competent HIV despite prolonged suppression of plasma viremia. Science 1997; 78: 1291–4.
3. Chun TW, Stuyver L, Mizell SB, et al. Presence of an inducible HIV latent reservoir during highly active antiretroviral therapy. Proc Natl Acad Sci USA 1997; 94:13193–7.
4. Finzi D, Blankson J, Siliciano JD, et al. Latent infection of CD41T cells
provides a mechanism for lifelong persistence of HIV-1, even in patients on effective combination therapy. Nat Med 1999; 5:512–7.
5. Finzi D, Siliciano RF. Viral dynamics in HIV-1 infection. Cell 1998; 93: 665–71.
6. Vigano ABDTD, Salvaggio A, Ruzzante S, et al. Immunization with both T cell–dependent and T cell–independent vaccines augments HIV viral load secondarily to stimulation of tumor necrosis factor a. AIDS Res 1998; 14:727–34.
7. Staprans SI, Hamilton BL, Follansbee SE, et al. Activation of virus repli-cation after vaccination of HIV-1–infected individuals. J Exp Med 1995; 182:1727–37.
8. O’Brien WA, Grovit-Ferbas K, Namazi A, et al. Human immunodeficiency virus–type 1 replication can be increased in peripheral blood of seropos-itive patients after influenza vaccination. Blood 1995; 86:1082–9. 9. Rosok B, Voltersvik P, Bjerknes R, Axelsson M, Haaheim R, Asjo B.
Dy-namics of HIV-1 replication following influenza vaccination of HIV1 individuals. Clin Exp Immunol 1996; 104:203–7.
10. Tasker SA, O’Brien WA, Treanor JJ, et al. Effects of influenza vaccination in HIV-infected adults: a double-blind, placebo-controlled trial. Vaccine 1998; 16:1039–42.
11. Stanley SK, Ostrowski MA, Justement JS, et al. Effect of immunization with a common recall antigen on viral expression in patients infected with human immunodeficiency virus type 1. N Engl J Med 1996; 334:1222–30. 12. McElhaney JE, Pinkoski MJ, Meneilly GS. Changes in CD45 isoform ex-pression vary according to the duration of T-cell memory after vaccina-tion. Clin Diagn Lab Immunol 1995; 2:73–81.
13. Mulder J, McKinney N, Christopherson C, Sninsky J, Greenfield L, Kwok S. Rapid and simple PCR assay for quantitation of human immunode-ficiency virus type 1 RNA in plasma: application to acute retroviral in-fection. J Clin Microbiol 1994; 32:292–300.
14. Christopherson C, Lu S, Kwok S. Laboratory markers of antiviral activity. Antiviral Ther 1998; 3:247–50.
15. Lennette EH, Schmidt NJ, eds. Diagnostic procedures for viral, rickettsial and chlamydial infections. 5th ed. Washington, DC: American Public Health Association, Inc., 1979:603–9.
16. Fowke KR, D’Amico R, Chernoff DN, et al. Immunologic and virologic evaluation after influenza vaccination of HIV-1–infected patients. AIDS 1997; 11:1013–21.
17. Glesby MJ, Hoover DR, Farzadegan H, Margolick J, Saah AJ. The effect of influenza vaccination on human immunodeficiency virus type 1 load: a randomized, double-blind, placebo-controlled study. J Infect Dis 1996; 174:1332–6.
18. Nelson KE, Clements ML, Miotti P, Cohn S, Polk BF. The influence of human immunodeficiency virus (HIV) infection on antibody responses to influenza vaccines. Ann Intern Med 1988; 109:383–8.
19. Yerly S, Wunderli W, Wyler CA, et al. Influenza immunization of HIV-1 infected patients does not increase HIV-1 viral load. AIDS 1994; 8:1503–4. 20. Donovan R.M., Moore E, Bush C.E., Markowitz N.P., Saravolatz L.D. Changes in plasma HIV RNA levels and CD4 cell counts after vaccination of pediatric patients. AIDS 1999; 11:1054–6.
21. Fuller J.D., Craven DE, Steger K.A., Cox N, Heeren T.C., Chernoff D. Influenza vaccination of human immunodeficiency virus (HIV)–infected adults: impact on plasma levels of HIV type 1 RNA and determinants of antibody response. Clin Infect Dis 1999; 28:541–7.
22. Chun T-W, Engel D, Mizell SB, et al. Effect of interleukin-2 on the pool of latently infected, resting CD41cells in HIV-1–infected patients receiving highly active anti-retroviral therapy. Nat Med 1999; 5:651–5.
23. Zhang L, Ramratnam B, Tenner-Racz K, et al. Quantifying residual HIV-1 replication in patients receiving combination antiretroviral therapy. N Engl J Med 1999; 340:1605–13.
24. Furtado M, Callaway CS, Phair J, et al. Persistence of HIV-1 transcription in peripheral-blood mononuclear cells in patients receiving potent anti-retroviral therapy. N Engl J Med 1999; 340:1614–22.
25. Kroon FP, Rimmelzwaan GF, Roos MTL, et al. Restored humoral immune response to influenza vaccination in HIV-infected adults treated with highly active antiretroviral therapy. AIDS 1998; 12:F217–F223 26. Gu¨nthard HF, Wong JK, Ignacio CC, et al. Human immunodeficiency virus
replication and genotypic resistance in blood and lymph nodes after a year of potent antiretroviral therapy. J Virol 1998; 72:2422–8. 27. Montaner JSG, Reiss P, Cooper D, et al. A randomized, double-blind trial
comparing combinations of nevirapine, didanosine, and zidovudine for HIV-infected patients: the INCAS trial. JAMA 1998; 279:930–7. 28. Fiscus SA, Hughes MD, Lathey J, et al. Changes in virologic markers as
predictors of CD4 cell decline and progression of disease in human im-munodeficiency virus type 1–infected adults treated with nucleosides. AIDS Clinical Trials Group Protocol 175 Team. J Infect Dis 1998; 177: 625–33.
![Figure 3. Change in proviral DNA from baseline (copies/mg of genomic DNA). A, Mean proviral DNA changes from baseline in 8 patients from group 1 ( ! 50 human immunodeficiency virus [HIV] RNA copies/mL of plasma at baseline) with no detectable RNA during th](https://thumb-eu.123doks.com/thumbv2/123doknet/14893784.650460/4.918.106.824.837.997/proviral-baseline-proviral-baseline-patients-immunodeficiency-baseline-detectable.webp)