ENVIRONMENTAL MICROBIOLOGY
Is There a Size Limit for Cosmopolitan Distribution
in Free-Living Microorganisms? A Biogeographical
Analysis of Testate Amoebae from Polar Areas
Jun Yang&Humphrey G. Smith&Thomas N. Sherratt&
David M. Wilkinson
Received: 18 August 2009 / Accepted: 1 November 2009 / Published online: 4 December 2009 # Springer Science+Business Media, LLC 2009
Abstract A long-standing debate in microbial ecology is the extent to which free-living microorganisms exhibit cosmopolitan distributions. We use a comparison of testate amoebae communities in cold “polar” locations (Arctic, Antarctic, and Tibet) to investigate how a microorganism’s size affects its probability of having a cosmopolitan distribution. We show that the probability a given taxa being reported in all three locations increases as testate size decreases. Likewise, excluding those testates found only in Tibet, very small testates (<20μm) are more likely to occur in both the Arctic and Antarctic than in either of these poles alone. Attempting to correct for phylogeny reduces the number of statistically significant relationships—both be-cause of decreased sample size and potentially real phylogenetic patterns, although some size-dependent
effects were still apparent. In particular, taxa found in both the Arctic and Antarctic poles were significantly smaller than congeneric taxa found only in Tibet. This pattern may in part be due to habitat effects, with the Tibetan samples being more likely to have come from aquatic sites which may be more suitable for larger taxa. Overall, our analysis suggests that, at least within testate amoebae, a cosmopol-itan distribution becomes increasingly common as median taxon size decreases.
Introduction
On the 7th of April, 1864, Louis Pasteur gave a famous public lecture on spontaneous generation at the Sorbonne.
Electronic supplementary material The online version of this article (doi:10.1007/s00248-009-9615-8) contains supplementary material, which is available to authorized users.
J. Yang
Key Laboratory of Urban Environment and Health,
Institute of Urban Environment, Chinese Academy of Sciences, 1799 Jimei Dadao,
Xiamen 361021, People’s Republic of China
H. G. Smith
Environmental Sciences, James Starley Building, Coventry University,
Coventry, UK
T. N. Sherratt
Department of Biology, Carleton University, 1125 Colonel By Drive,
Ottawa K1S 5B6 ON, Canada
D. M. Wilkinson (*)
School of Natural Science and Psychology, Liverpool John Moores University, Byrom Street,
Liverpool L3 3AF, UK
e-mail: [email protected] D. M. Wilkinson
Ecosystems Boundaries Research Group, WSL Swiss Federal Institute for Forest, Snow and Landscape Research,
Site Lausanne, Station 2, CH-1015 Lausanne, Switzerland D. M. Wilkinson
Laboratory of Ecological Systems—ECOS, Ecole Polytechnique Fédérale de Lausanne (EPFL), Station 2,
CH-1015 Lausanne, Switzerland DOI 10.1007/s00248-009-9615-8
In this talk, he summarized—for both his professional colleagues and the wider Parisian intelligentsia—the case against spontaneous generation [36]. As Maureen O’Malley [56] has pointed out, Pasteur’s ideas depended on “the airborne ubiquity of microorganisms being brought out of latency by appropriate nutritional material”—these ideas subsequently influenced the world view of the early microbial ecologists. During the late nineteenth and early twentieth centuries, the developing field of microbial ecology came to see microbial diversity as structured in a very different way from the patterns seen in larger organisms. Global exploration during the eighteenth and nineteenth century had shown that these more familiar macroscopic organisms exhibited distinctive biogeographi-cal patterns—such that similar habitats in different parts of the world were home to different species [10]. For example, the deserts of the Americas contain over 1,000 species of cacti while in Africa this role is taken by very similar looking species from a different family of plants—the Euphorbiaceae [46].
The early microbial ecologists came to suspect that the ease of dispersal of small microbes, coupled with their ability to come out of latency when conditions were suitable, lead to species always being present at all locations with suitable habitats [23,56]. The macroorgan-ism equivalent of this view would be to expect to find the same species of cacti anywhere in the world with the correct desert conditions. In 1934, Lourens Baas Becking encapsulated this idea of cosmopolitan microbial distribu-tions in his famous maxim“Everything is everywhere, but, the environment selects” [15]. That is, all microbe species can reach all locations, but the environmental conditions select which species are ecologically active and so present in numbers which allow them to be recorded by a microbial ecologist. Reviewing what was known of soil protozoa in the 1920s, Sandon ([63], p 68) concurred with this view, writing that“All the soil protozoa appear to be world-wide in their distribution, the same species occurring in arctic, temperate, and tropical soils”.
This classic cosmopolitan view of microbial biogeogra-phy was challenged during the second half of the twentieth century. For example, by the early 1980s, Stuart Bamforth reviewed what was then known and suggested in his postpresidential address to the Society of Protozoologists that“many free-living protozoa appear to be cosmopolitan, but mating types and isoenzyme studies suggest that speciation with its geographical connotations may be more widespread than previously appreciated” [3]. Later in the same decade, two of us suggested that the testate amoebae genus Nebela contained some species which were restricted to land masses that had formally comprised the supercon-tinent of Gondwana [73]—although recent molecular work casts some doubt on the details of this model, especially the
dates of various speciation events [44]. Summarizing the position for protozoa in a review article in the early 1990s, Cowling [13] wrote that “evidence is emerging that soil protozoa may not be as widespread as formally believed”.
At about the same time that Cowling [13] was writing, the earlier cosmopolitan view of microbes was being revived in a series of technical papers and more general articles by Tom Fenchel, Bland Finlay, Genoveva Esteban, and colleagues (e.g., [24,25,26,28,30]). This work, which was mainly based on data on ciliate protozoa, was well received in several late 1990s commentary articles in ecological journals (e.g., [45, 90])—albeit with some reservations about possible restricted distributions in some of the largest microbial protists [90]. Indeed by the start of this century, Esteban and Finlay [23] felt able to write that it was “now commonly (if not unanimously) believed, [that] protozoan species are ubiquitously distributed”—however, some other workers on protist ecology certainly disagreed (e.g., [31, 32,33, 38,41, 48, 97]). Although these recent attempts to reinvigorate the “everything is everywhere” paradigm have been based primarily on ciliate data, there are implications for the ecology of all free-living micro-organisms. Since ciliates are large by the standards of most microorganisms, the implication is that if they are small enough to easily disperse globally then this must also be the case for the much smaller prokaryotes [29]. This conclusion seems to run counter to many recent molecular studies of prokaryotes, which suggest noncosmopolitan distributions and high species richness, indicating conditions suitable for allopatric speciation [43, 58]. However, there are excep-tions which appear consistent with the idea of cosmopolitan distributions—with habitat requirements determining what is found at any given site [27].
In the context of these debates during the 1990s, one of us [91] made a preliminary attempt in 2001 to ask a more refined question, namely“What is the upper limit for cosmopolitan distribution in free-living microorganisms?” This paper used data on testate amoebae communities in the Arctic and Antarctic to make an initial attempt to answer this question. The logic behind the approach was to compare two areas of similar habitat a maximum distance apart. Wilkinson [91] concluded that many of the testate amoebae morphospecies in his data set were found in both polar areas—however, there was a tendency for larger taxa (>150 μm) to be restricted to only one of the polar areas.
In this paper, we greatly extend Wilkinson’s [91] initial analysis, using a substantially more detailed version of the same approach, to investigate roles of dispersal, size, and habitat in the biogeography and biodiversity of testate amoebae. These are a polyphyletic, but ecologically similar, functional grouping of protists in which the single cell is enclosed within a shell usually referred to as a test—with a
size range of 5–300+ μm. They are especially common in habitats with high organic matter content, such as organic rich soils, peats, mosses as well as freshwater habitats [57,72,92]: although they can also be found in lower numbers in arid habitats low in organic matter [4, 93]. Testate amoebae are good model organisms for such a study as they are relatively well known (with a reasonable consensus on the identification of many of the morpho-species) and because of their tests (shells) can be ascribed a relatively unambiguous size [91]. This latter point can be contrasted with the situation in ciliates which often form cysts (resting stages) much smaller than the trophozoites (the ecologically active forms) [32, 63]. However, there are some limited suggestions in the older literature that tests may sometimes break up potentially releasing smaller cysts [12]. Here, we build on Wilkinson’s [91] original idea of comparing testate amoebae in similar (“polar”) habitats a maximum distance apart but add data from Tibet into these analyses.
Tibet is an extensive area of cold, high-altitude habitats with some similarities to the polar regions—indeed, it has been repeatedly referred to as the“the third pole” since the term was first coined by the British mountaineer Edward Whymper in the late nineteenth century, a reference to both its climate and interest to western adventurers [47]. High-latitude polar climates tend to be dominated by cold and dry air masses [1]. Tibetan sites are somewhat more diverse and include cold arid alpine habitats (mean annual temperature in the warmest month 4–6°C), cool semiarid alpine habitats (6–10°C), warm arid alpine habitats (10–12°C), warm semiarid alpine habitats (6–15°C), warm semihumid alpine habitats (10–18°C), and limited lower altitude semitropical humid habitats (18–25°C) [96]. Clearly the“light climate” of Tibet differs from the true poles—which have extreme seasonal variation of day length. Tibet is important in the context of attempting to understand the global distribution of cold tolerant testate amoebae, as it is approximately half way between the two poles but still has extensive“polar” type habitats.
In addition to adding data from a third “pole” into the analysis, the current work greatly extends Wilkinson’s [91] study by increasing the amount of data from both true polar areas—especially from recent detailed work on the sub-Antarctic islands of Île de la Possession and South Georgia (e.g., [82–87]). This greatly extends the number of taxa in our data set, with 303 in this study compared to 127 in Wilkinson’s original paper. In addition, Wilkinson’s [91] initial analysis accepted all published records at face value. In the present study, we have attempted to correct these data for synonymies and remove obvious misprints and errors in both occurrence and size data from the data set (see “Methods” section). Our analyses attempt to investigate the extent to which testate amoebae morphospecies are
cosmopolitan and relate these findings to their size and ecology. The much enlarged data set has allowed a more sophisticated statistical analysis than that used by Wilkinson [91], including phylogenetically controlled comparisons which attempt to control for a potential lack of independence in data arising from common ancestry.
Methods
Compilation of the Data Set
Species lists (note all our taxa are morphospecies) for the three “poles” were compiled from the published literature. Papers which contributed one or more record to the data set are listed in Table 1. Many other publications were checked, but they did not add any additional records. Data on testate sizes were mainly taken from major compendi-ums and taxonomic revisions such as [17–21,35,57,65]. Following Wilkinson [91], when a range of sizes were given in the literature, the midpoint of the range was used as that taxons “size” in our calculations. The quality of these size data were variable, and in some cases, no sample size was given, while in other cases, the size data were based on very small sample sizes. In many cases, the sources used just cited a size range for a given taxon. However, in other cases, extensive size data were available from multiple studies—for example, Smith and Wilkinson [74] were able to describe the size of Nebela (Apodera) vas on the basis of 130 measurements from 22 different publications.
While Wilkinson [91] took all published data at face value, in this study, we have attempted to produce a more reliable data set and to correct the species lists and size data for synonymies and obvious misprints. With the exception of one synonymy (which was not identified until later), all changes of this kind were agreed and carried out before any statistical analysis of these data—to avoid the temptation to find reasons for removing data points which our analysis had identified as anomalous. The most important of our modifications to these data was the record of Nebela martialis from the Arctic by Beyens et al. [6]. This appeared odd as it is the only record from the Arctic, and inquiries suggested that a misprint in the paper was possible (L. Beyens, personal communication) and the death of the author responsible for the identifica-tion (D. Chardez) made it impossible to check. Therefore, this record was discounted. No other records were removed from the data set, and all other changes were for synonymies (e.g., Zivkovicia compressa for Pontigu-lasia bigibbosa) or raising a few older subspecies to full species to be consistent with current taxonomic opinion (e.g., Difflugia brevicolla for Difflugia oblonga
brevi-colla). A very small number of what appeared to be obvious typographical errors in size data (giving sizes substantially greater or smaller than all other records for that taxon) were also excluded from our data, all prior to any data analysis.
Statistical Analyses
All analyses were conducted using SPSS version 17. In the first instance, we fitted a simple general linear model (GLM) with the median size of each morphospecies as the Table 1 Summary of the data set; giving site locations, number of taxa, and references used in compiling these data
Region Site Approximate latitude and longitude References Number of taxa
Arctic East Greenland 66–72° N; 24–36° W [5,22,75] 49
Jan Mayen 71° N; 8° W [5] 16 Spitsbergen 78° N; 18° E [2,5,8,42,62] 94 Edgeøya 77° N; 22° E [5] 90 Barentsøya 78° N; 21° E [5] 34 Hopen 76° N; 26° E [5] 22 Bear Island 74° N; 19° E [5] 31 Devon Island 75° N; 88° W [5] 64 West Greenland 67° N; 50–51° W [5,50] 108 Victoria Island 71° N; 110° W [5] 79
Alaska (Barrow and Brooks Range) 68–72° N; 149–160° W [5,52] 55
Alaska (Nome) 64° N; 165° W [5] 53
NE Greenland 74° N; 20° W [79,81] 81
Nar-Yan-Mar, Russia 68° N; 53° E [6] 25
Dickson Island, Russia 73° N; 81° E [6] 17
Severnaya and Zemlya Islands, Russia 79° N; 97° E [6] 25
Franz Joseph’s Land, Russia 80–82° N; 47–57° E [6] 15
Antarctic Macquarie 54° S; 159° E [16,59] 21
Kerguelen 49° S; 70° E [9] 50
Île de la Possession 46° S; 52° E [82–85] 77
Marion Island 47° S; 38° E [39] 44
South Georgia 54–55° S; 36–38° W [7,64,68,87] 75
South Orkney Islands 60–61° S; 44–46° W [67] 16
South Shetland Islands 61–63° S; 55–60° W [37,67,70] 40
Antarctic Peninsula, north 63–67° S; 47–70° W [60,61,67] 12
Antarctic Peninsula, south 67–90° S; 67–70° W [67,69] 12
Antarctic continent (Ross) 150° W; 135° E [11,16,17,54,59,71] 18
Antarctic continent (Weddell) 0–50° W [40,49,71,76] 14
Tibet Kunlun Mountains 34–36° N; 80–90° E [65] 1
Qiangtang Plateau 30–34° N; 81–92° E [65] 21
Ngari Plateau 30–34° N; 78–84° E [65] 38
Upper Brahmaputra Basin 28–31° N; 82–89° E [65] 29
Qomolangma Mountain (north) 28° N; 87° E [65,88] 45
Qomolangma Mountain (south) 28° N; 86° E [65,88] 49
Middle Brahmaputra Basin 27–31° N; 89–93° E [65,89] 91
Eastern Tibet 28–33° N; 92–99° E [65,89] 90
Southeastern Tibet 27–30° N; 92–99° E [65,89] 78
Northwestern Yunnan 25–29° N; 98–101° E [94,95] 158
A wide range of habitats were sampled by the studies we used to compile these data. For the Arctic and Antarctic, these included all major habitats, namely soils (including litter layers), mosses (both terrestrial and aquatic), open water (from small ponds to larger water bodies, including both lotic and lentic habitats), aquatic sediments, and vegetation. For Tibet, a similar range of habitats were sampled—although fewer of the samples came from soils compared with the two“true” poles
continuous dependent variable and its specific distribution class (found in (1) Arctic alone, (2) Antarctic alone, (3) Tibet alone, (4) Arctic and Antarctic, (5) Arctic and Tibet, (6) Antarctic and Tibet, and (7) all three locations) as the categorical fixed factor (this coding is summarized in Fig 1). Prior to drawing inferences, the distribution of residuals was checked for approximate normality and homogeneity of variance [38].
Following this, we fitted a series of binary logistic regression models (generalized linear models), testing whether membership of any given binary species distribu-tional category—such as whether the species occurs on both poles (combined categories 4 and 7) or just one pole (combined categories 1, 2, 5, and 6) could be predicted by its median size. Next, to elucidate how these relationships might shape species co-occurrence patterns, we limited ourselves to those amoeba taxa found in Tibet and tested (using standard χ2 tests of association) whether the presence or absence of such taxa in the Arctic was associated with its presence or absence in the Antarctic. A parallel test focusing on northern–southern polar associa-tions among taxa absent from Tibet was not conducted because the data set included no taxa that were absent from all three locations (the frequency of absence from both poles would necessarily be 0).
Finally, we note that the above tests rest on the assumption of independence, yet a tendency to disperse
and body size may in theory be jointly inherited in closely related “sister” species following speciation. This is an important issue because closely related species sharing the same size and distribution pattern through common descent might properly be considered as one data point rather than two, with shared traits arising through phylogeny rather than independent assortment. Given that the phylogenetic relationships of testate amoebae taxa in our data set are not well known, we attempted to overcome the potential lack of independence by conducting congeneric paired species comparisons [51,53,55,66]. To conduct this analysis, we systematically selected pairs of congeneric species that differed in particular distributional characteristics (such as species found on both poles (4 and 7) and congener species found only in Tibet (3)) and compared their median sizes. When two or more pairs of species with the given contrasting distributions could be selected from the same genus, then we selected species in the strict (alphabetical) order they were listed in the dataset. To compare the median sizes of congeners with these contrasting distribu-tional characteristics, we conducted Wilcoxon signed rank tests (the nonparametric equivalent of matched pairs t tests). Nonparametric tests were necessary because the distribution of differences in median size between congeners was in general not normal.
Results
The taxon richness at each location within our three poles is given in Table1. All our comparisons were made between these three “polar” regions. More fine-scale comparisons between individual “locations” within each “pole” would be more susceptible to problems with unequal sampling effort than are our large-scale comparisons presented here. Full “species lists” for each pole are given in the supplementary Microsoft® Excel spreadsheet. In total, we identified 214 species from the Arctic, 134 species from the Antarctic, and 165 species from Tibet, although a number of species were found in two or more locations and not all species could be ascribed a median size (Fig. 1). The overall average median sizes of species (in micrometers, with 95% confidence limits) reported from the Arctic, Antarctic, and Tibet were 87.32 (79.74–94.89), 79.04 (71.81–86.26), and 97.16 (88.88–105.43), suggesting that larger species were more likely to be found in Tibet (see below). Most of the genera and many of the species can be found in both wet terrestrial and aquatic habitats. An exception is Pontigulasia spp. (which are only aquatic); in addition, most of the very largest testate taxa (300+μm) are aquatic only.
Overall, the fitted GLM indicated that the average median size of taxa differed significantly between taxa Figure 1 Frequency distribution of the sizes of testate amoebae
morphospecies according to seven mutually exclusive distributional categories (1 Arctic alone, 2 Antarctic alone, 3 Tibet alone, 4 Arctic and Antarctic, 5 Arctic and Tibet, 6 Antarctic and Tibet, and 7 all three locations); these are described using the code numbers 1–7 in the text
with different recorded distributions (F6, 292=3.147, P=
0.005; Figs. 1 and 2). The primary driver of this overall significant difference was the large size of taxa found only in Tibet compared to those found at all three locations (Bonferroni post hoc test: difference 32.67μm, P=0.028) and, to a lesser extent, those found only at both poles (Bonferroni post hoc test: difference 36.85μm, P=0.083).
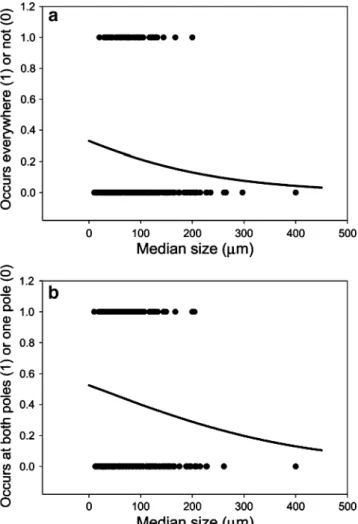
If smaller-sized taxa were more cosmopolitan in distri-bution, then one would expect smaller testate amoeba taxa to be more likely to be recorded at all three locations (Arctic, Antarctic, Tibet) compared to larger species. Logistic regression confirms that the likelihood of a taxon being distributed everywhere (i.e., all three locations) does indeed depend significantly on its size (Wald=4.104, df=1, P=0.043; Fig.3a), with smaller taxa more likely to have a wide distribution. Likewise, excluding those taxa found only in Tibet, we can ask whether those taxa found on both (northern and southern) poles are more likely to be small compared to those taxa found on just one pole. Logistic regression confirms this hypothesis in that size is a significant predictor of whether a taxon is found on just one or both poles (Wald=4.358, df=1, P=0.037; Fig.3b). Based on these sample data, for example, although there is an overall tendency for taxa to be distributed at one compared to both poles, any individual taxon is more likely to arise in both poles (predicted probability of group membership ≥0.5) if its median size is less than 19.8 μm (the solution to the fitted logistic model for probability of membership equal to 0.5, see Fig. 3b). Taking each pole separately, smaller taxa were more likely to be found in the Arctic and Antarctic than in the Arctic alone (Wald=5.258,
df=1, P=0.022). However, we note that taxon size had no influence on whether a given taxon found in the Antarctic was also found in the Arctic (Wald=0.316, df=1, P= 0.574). This asymmetry may well be mediated by the underlying size distributions of testates found at the two poles. For example, no taxon found only in the Antarctic exceeded 200 μm, and only 21.9% of taxa found in Antarctica were unique to Antarctica. By contrast, the Arctic samples included a number of large taxa, and 43.2% of taxa found in the Arctic were unique to the Arctic. Finally, we note that for those testate amoebae taxa found in Tibet, the presence of a species in the Arctic and the presence of the same taxon Antarctic are not independent (frequency in both poles 70, neither pole 55, Antarctic only five, Arctic only 35) in that there is an overall tendency to be present or absent in both locations rather than one or another (χ2
=52.40, df=1, P<0.0001). This implies that Figure 3 a, b The relationship between median size and distribu-tional range across testate taxa. Logistic models were fitted, with median morphospecies size as the covariate, and a binary response variable a occurs in all three locations (1) or not (0) and b occurs in both northern and southern poles (1) or only one of these poles (0). In both cases, the presence/absence data are displayed as dots while the continuous line represents the fitted logistic model
Figure 2 The average median size of testate amoebae with different (mutually exclusive) distributional ranges (±1 standard error). Sample sizes (number of species) for distributional categories from left to right were 76, 28, 55, 30, 35, 5, and 70 taxa (three additional Arctic and one additional Antarctic taxa were of unknown size)
species that occur in Tibet and one pole also tend to have the capacity to reach the other pole; conversely, those species found in Tibet but not Arctic do not tend to reach the Antarctic (or vice versa).
The sister-species comparisons are necessarily more conservative, involving considerably reduced sample size, and a number of key tests did not allow us to reject the null hypothesis of no difference in size between the groups. For example, when we compared the median sizes of taxa that were distributed in all three areas with congeneric taxa that were not distributed in all three areas, there was no significant difference in their median size distribution (Wilcoxon Z=−1.282, P=0.20). Likewise, when we com-pared the median sizes of taxa that were distributed in both poles with congeneric taxa that were limited to one of those poles, there was no significant difference in median size (Wilcoxon Z =−1.220, P=0.223). Nevertheless, certain trends were apparent. In particular, collections of taxa found on both poles only (distribution group 4) were significantly smaller (mean 92.95 vs 147.89 μm) than congeneric taxa found in Tibet only (group 3, Z=−2.817, P=0.005). Likewise, collections of taxa found at all three locations (group 7) were significantly smaller (mean 94.68 vs 131.29 μm) than congeneric taxa found in Tibet only (group 3, Z=−2.004, P=0.045). Finally, collections of taxa found only in the Antarctic (group 2) were significantly smaller (mean 92.18 vs 167.27 μm) than congeneric taxa found only in Tibet (group 3, Z =−1.956, P=0.050). Collectively then, the strongest signal once one conserva-tively controls for the influence of phylogeny is that taxa geographically restricted to Tibet tend to be large compared to closely related (congeneric) taxa found elsewhere.
Discussion
Our analysis identifies some potentially important patterns relating microbial size to distributional range, which are central to ongoing debates about the extent of cosmopolitan distributions in microbial ecology. Cursory examination of Fig.3asuggests that taxa that are found at all three“poles” tend to be smaller than taxa with more restricted distribu-tions, with a pronounced drop off in occurrence in all three areas between 100 and 150μm. Moreover, comparing just the two “true poles” (i.e., excluding Tibet), our logistic model suggests that there is a statistically significant probability of taxa smaller than 20 μm occurring at both poles (many larger taxa also occur at both poles; Fig. 1). The results are broadly compatible with the results of the original analysis by Wilkinson [91] which suggested a decreased probability of cosmopolitan distribution for testates greater than 100–150 μm. Our formal statistical analysis also detects an effect of size on extent of
distribution. The logistic regression confirmed that the probability of a taxon being distributed everywhere (i.e., all three “poles”) depends significantly on its size—with smaller taxa more likely to have a wide distribution. Comparing just the two“true poles” (i.e., excluding Tibet), our logistic model suggests that there is a greater than 0.5 probability of taxa smaller than 20 µm occurring at both poles (many larger taxa also occur at both poles; Fig. 1). Attempting to“correct” for phylogeny necessarily reduces statistical power because of the much reduced sample sizes. When we compared the median sizes of taxa that were distributed in both poles with congeneric taxa that were limited to one of those poles, there was no significant difference in median size. However, some trends still were apparent. Notably, collections of taxa found on both poles only were significantly smaller than congeneric taxa found in Tibet only. In addition, collections of taxa found at all three locations were significantly smaller than congeneric taxa found in Tibet only. So there are some indications of a size effect on distribution even when phylogeny has been statistically controlled for.
Examination of summary statistics (data not shown) for different taxonomic groups of testates suggests that the Hyalospheniidae may show the strongest effect of size on dispersal—however, the small sample sizes produced by splitting the data into different testate families prevents formal statistical analysis. Nevertheless, this does hint that a real phylogenetic effect may contribute to the negative relationship between size and cosmopolitan distribution. One possibility is the understudied potential of testates breaking open to release smaller cysts [12]; if this is more likely in some testate families, then it may explain part of the suggested phylogenetic pattern. For example, our data would lead us to speculate that this mechanism is very uncommon in the Hyalospheniidae.
The strongest relationship in these data is the tendency for Tibet to have more large taxa. This is statistically significant even when phylogeny is corrected for. There are two obvious and not mutually exclusive explanations for this relationship: one based on biogeography and dispersal while the other is based on habitat ecology. Although much of Tibet is “polar” in character, the country has a wider range of habitats and climate than either of the true poles. As such, it is likely that more species were able to survive the last glaciations in situ in Tibet compared to the poles, whose biota may be more dominated by species that were able to recolonize following repeated glaciations. A related explanation for the tendency of Tibet to have more large taxa is that Tibet simply has more habitats suitable for larger taxa and/or that these habitats featured more in our Tibetan data. One reason for this is that a high proportion of the Tibetan samples come from freshwater habitats (ranging from small ponds and ditches to large lakes and rivers) than
is the case for the other two poles. In this context, it is interesting that Dallimore [14] suggested that cold lakes in Arctic Canada had “strains” of unusually large testates, which she speculated may be an adaptation to rapid growth during short periods of warm water during the summer. Although it is clear that the Tibetan data comprise more aquatic samples, we have not subdivided these data into “terrestrial” and “aquatic” samples in our analysis. Al-though the extremes (relatively dry soils and fully aquatic samples) are unambiguous, many samples come from intermediate sites (e.g., very wet moss, marginal lake habitats) which are impossible to unambiguously classify as terrestrial or aquatic. In addition in some of the older literature (especially from the Arctic), habitat data can sometimes be too limited to assign a site with confidence to terrestrial or aquatic. However, we stress that the patterns in our data set are not just driven by the behavior of Tibet. For example, when we examine taxa found on both poles vs one pole, we see still a size effect. Likewise, for those species found in Tibet, presence in the Arctic is associated with presence in the Antarctic.
In summary, our analysis suggests that morphospecies smaller than 20 μm are increasingly likely to be cosmo-politan and that the probability of a taxon being found at multiple “poles” declines as they become larger—with relatively few examples above 150μm. We stress that this is not a sharp cutoff but a slowly increasing likelihood of more restricted distribution as the testate size increases. This suggests a much smaller potential size for cosmopolitan distribution than the widely cited figure of 1 mm argued for by Finlay and colleagues based on their studies of ciliate protozoa [28]. This work has been skeptically received by some other ciliate biologists [34]. Contrasting the results of our current study (and [91]) and its suggestion of a cutoff range of 20–150 µm with Finlay’s [28] suggestion of 1 mm suggests that any taxonomic group that falls between these two figures in its size distribution may be of particular interest in the context of these debates. Water mites (Hydrachnidia) are a group which falls into this category (300μm to 10 mm), and a recent analysis by Valdecasas et al. [80] failed to find any effect of size on global geographical range size in this group—although the model presented by Finlay [28] would predict an effect over this size range. Interestingly, in the light of our results from Tibet, Valdecasas et al. [80] did find a habitat effect, with water mites from lotic habitats tending to be larger than these from lentic habitats. It is, of course, possible that different taxonomic groups show different patterns of distribution in relation to size. As we pointed out in the introduction, the case with ciliates is complicated by the fact that they often form cysts (resting stages) much smaller than the trophozoites (the ecologically active forms). More recently, Yang et al. [97] suggested the geographical
barriers may be more important in structuring assemblage patterns of testate amoebae at the regional level. In this context, testate amoebae appear to be much better model organisms for understanding the relationship between size and distribution in microorganisms.
Our analysis of the relationship between size and biogeography in testate amoebae comes with two important caveats. (1) The fact that we show an increasing probability of cosmopolitan distribution with decreasing size should not be taken as a demonstration that all sub-20 μm free-living microbes are cosmopolitan. Logically, any taxon must have a geographical point of origin, and it is difficult to envisage a species coming into existence with a cosmopolitan distribution. Thus, all microbial taxa are likely to have had limited distributions at least at some point in their evolutionary history. At our current state of knowledge, it is impossible to suggest what proportion of small microbial taxa may have limited distribution. How-ever, our analysis suggests that restricted distributions become less common as size decreases. (2) Our analysis applies to morphospecies; clearly there is a possibility that both classical morphological approaches (e.g., [78]) and molecular methods (e.g., [44]) may find cryptic species that have not been recognized because of limited morphological differences. This may be particularly likely for the smaller testate amoebae, where it is clearly difficult to resolve large amounts of morphological detail under a light microscope. However, our analysis of testate amoebae suggests that cosmopolitan distributions become significantly more com-mon in the size range of 20–150 μm—with microbes smaller than this a good candidate for being“everywhere”. Telford et al. [77] recently categorized the possibilities for global microbial distributions as falling into one of three general patterns: (1) “everything is everywhere”, (2) “nothing is everywhere”, and (3) “not everything is everywhere”. Our data suggest testate amoebae as a group fall into the third category and that size partly determines which distribution a particular taxon is most likely to exhibit.
Acknowledgments We thank Edward Mitchell and our referees for comments. The manuscript was completed while DW was on a sabbatical visit to WSL and EPFL in Switzerland—he thanks both organizations for their hospitality. JY was supported by the Knowledge Innovation Program of the Chinese Academy of Sciences (No. KZCX2-YW-Q02-04 and KZCX2-YW-QN401), the Key Science and Technology Project of Fujian Province, China (No. 2009Y0044), the China International Science and Technology Cooperation Program (No. 2009DFB90120), and the National Natural Science Foundation of China (No. 30800097).
Author contributions The idea for this work was independently conceived by JY and DW/HS. Data compilation was by HGS (Antarctic), DMW (Arctic), and JY (Tibet). Statistical analysis was by TS with collaboration from DW. DW wrote the paper with help from all other authors.
References
1. Archibold OW (1995) Ecology of world vegetation. Chapman and Hall, London
2. Balik V (1994) On the soil testate amoebae fauna (Protozoa: Rhizopoda) of the Spitsbergen Islands (Svalbard). Arch Protistenk 144:365–372
3. Bamforth SS (1981) Protist biogeography. J Protozool 28:2–9 4. Bamforth SS (2008) Protozoa of biological soil crusts of a cool
desert in Utah. J Arid Environ 72:722–729
5. Beyens L, Chardez D (1995) An annotated list of testate amoebae observed in the Arctic between the longitudes 27° E and 168° W. Arch Protistenk 146:219–233
6. Beyens L, Chardez D, Van de Vijver B (2000) Contribution to the protist-diversity in the polar regions: testate amoebae data from the Russian Arctic. In: Ceulemans R, Bogaert J, Deckmyn G, Nijs I (eds) Topics in ecology: structure and function in plants and ecosystems. University of Antwerp, Antwerp, pp 101–110
7. Beyens L, Chardez D, de Baere D, Verbruggen NC (1995) The aquatic testate amoebae fauna of the Stromness Bay area, South Georgia. Antarct Sci 7:3–8
8. Bonnet L (1965) Sur le peuplement thecamoebien de quelques sols du Spitsberg. Bull Soc Hist Nat Toul 100:281–293
9. Bonnet L (1981) Thécamoebiens (Rhizopoda, Testacea). Biologie de sols. CNFRA 48:23–32
10. Bowler PJ (1992) The Fontana history of the environmental sciences. Fontana Press, London
11. Broady P, Given D, Greenfield L, Thompson K (1987) The biota and environment of fumaroles on Mt Melbourne, Northern Victoria Land. Polar Biol 7:97–113
12. Chardez D (1967) Histoire naturelle des protozoaires thecamoe-biens. Les Naturalistes Belges, Bruxelles, pp 1–100
13. Cowling AJ (1994) Protozoan distribution and adaptation. In: Darbyshire JF (ed) Soil protozoa. CAB International, Wallingford, pp 5–42
14. Dallimore A (2004) The characteristics of thecamoebians of Arctic thermokarst lakes, Richards Island, N.W.T. J Foramin Res 34:249–257
15. de Wit R, Bouvier T (2006)‘Everything is everywhere, but, the environment selects’; what did Baas Becking and Beijerink really say? Environ Microbiol 8:755–758
16. Decloitre L (1960) Thécamoebiens de la VIIIème expédition Antarctique Française. Bull Mus Nat d’Hist Nat 2e sér 32:242– 251
17. Decloitre L (1964) Thécamoebiens de la XIIème expédition Antarctique Française en Terre Adélie. Expeditions Polaires Française 259:1–47
18. Decloitre L (1977) Le genre Nebela. Compléments à jour au 31. Décembre 1974 de la monographic du genre parue an 1936. Arch Protistenk 119:325–352
19. Decloitre L (1982) Compléments aux publications précédentes mise à jour au 31.XII.1981 des genres Arcella, Centropyxis, Cyclopyxis, Euglypha, Nebela et Trinema. Arch Protistenk 126:393–407
20. Deflandre G (1928) Le genre Arcella Ehrenburg. Morphologie– Biologie. Essai phylogénétique et systématique. Arch Protistenk 64:152–287
21. Deflandre G (1936) Etude monographique sur le genre Nebela Leidy (Rhizopoda—Testacea). Ann Protistol 5:201–322 22. Dixon A (1939) The protozoa of some East Greenland soils. J
Anim Ecol 8:162–167
23. Esteban GF, Finlay BJ (2002) Historical encounters with a little-known ciliate (Gerda glans Claparede and Lachmaann, 1855) from the‘Jungfernheide’. Protist 153:79–86
24. Esteban GF, Finlay BJ (2008) It’s a small world. Br Wildl 19:316– 320
25. Fenchel T (1993) There are more small than large species? Oikos 68:375–378
26. Fenchel T, Esteban GF, Finlay BJ (1997) Local versus global diversity of microorganisms: cryptic diversity of ciliated protozoa. Oikos 80:220–225
27. Fierer N, Jackson RB (2006) The diversity and biogeography of soil bacterial communities. Proc Natl Acad Sci USA 103:626–631
28. Finlay BJ (2002) Global dispersal of free-living microbial eukaryote species. Science 296:1061–1063
29. Finlay BJ, Clarke KJ (1999) Ubiquitous dispersal of microbial species. Nature 400:828
30. Finlay BJ, Esteban GF, Brown S, Fenchel T, Hoef-Emden K (2006) Multiple cosmopolitan ecotypes within a microbial eukaryote morphospecies. Protist 157:377–390
31. Foissner W (1987) Soil protozoa: fundamental problems, ecological significance, adaptations in ciliates and testaceans, bioindicators, and guide to the literature. Prog Protistol 2:69–212
32. Foissner W (1997) Global soil ciliate (Protozoa: Ciliophora) diversity: a probability-based approach using large sample collections from Africa, Australia and Antarctica. Biodiversity Conserv 6:1627–1638
33. Foissner W (1999) Protist diversity: estimates of the near imponderable. Protist 150:363–368
34. Foissner W (2008) Protist diversity and distribution: some basic considerations. Biodivers Conserv 17:235–242
35. Gauthier-Lièvre L, Thomas R (1958) Les genres Difflugia, Pentagonia, Maghrebia et Hoogenraadia (Rhizopodes testacés) en Afrique. Arch Protistenk 103:241–370
36. Geison GL (1995) The private science of Louis Paster. Princeton University Press, Princeton
37. Golemansky V, Todorov M (2004) Additional data and summa-rized check-list on the rhizopods (Rhizopoda: Amoebida & Testacea) from Livingston Island, South Shetland Islands, the Antarctic. Bulg Antarct Res Life Sci 4:83–93
38. Grafen A, Hails R (2002) Modern statistics for the life sciences. Oxford University Press, Oxford
39. Grospietsch T (1971) Beitrag zür Ökologie der Testaceen Rhizopoden von Marion Island. In: Zindered-Bakker EM, van Winterbottom JM, Dyer RA (eds) Marion and Prince Edward Islands, report on the South African biological and geological expedition 1965–1966. A.A. Balkema, Cape Town, pp 411–419 40. Hada Y (1964) The freshwater protozoa in the region of Showa
Station, Antarctica. Bull Suzuzg Women’s Coll Nat Sci 11:5– 21
41. Hillebrand H, Waterman F, Karez R (2001) Differences in species richness patterns between unicellular and multicellular organisms. Oecologia 126:114–124
42. Hodkinson ID, Coulson SJ, Webb NR (2004) Invertebrate community assembly along proglacial chronosequences in the high Arctic. J Anim Ecol 73:556–568
43. Hughes Martiny JB, Bohannan BJM, Brown JH, Colwell RK, Fuhrman JA, Green JL, Horner-Driver MC, Kane M, Krumins JA, Kuske CR, Morin PJ, Naeem S, Øvreas L, Reysenbach A-L, Smith VH, Staley JT (2006) Microbial biogeography: putting microorganisms on the map. Nat Rev Microbiol 4:102–112 44. Lara E, Heger TJ, Ekelund F, Lamentowicz M, Mitchell EAD
(2008) Ribosomal RNA genes challenge the monophyly of the Hyalospheniidae (Amoebozoa: Arcellinida). Protist 159:165– 176
45. Lawton JH (1998) Small is beautiful, and very strange. Oikos 81:3–5
46. Mabberley DJ (2008) Mabberley’s plant-book, 3rd edn. Cambridge University Press, Cambridge
47. MacFarlane R (2003) Mountains of the mind; a history of a fascination. Granta Books, London
48. Mann DG, Droop SJM (1996) Biodiversity, biogeography and conservation of diatoms. Hydrobiologia 336:19–32
49. Matsuda T (1968) Ecological study of the moss community and microorganisms in the vicinity of Syowa Station, Antarctica. JARE Sci Rep (E) 29:1–58
50. Mattheeussen R, Ledeganck P, Vincke S, Van de Vijver B, Nijs I, Beyens L (2005) Habitat selection of aquatic amoebae communities on Qeqertarsuaq (Disko Island), West Greenland. Acta Protozool 44:253–263
51. Merilaita S, Tullberg BS (2005) Constrained camouflage facili-tates the evolution of conspicuous warning coloration. Evolution 59:38–45
52. Mitchell EAD (2004) Response of testate amoebae (Protozoa) to N and P fertilization in an Arctic wet sedge tundra. Arct Antarct Alp Res 36:77–82
53. Møller AP, Birkhead TR (1992) A pairwise comparative method as illustrated by copulation frequency in birds. Am Nat 139:644– 656
54. Murray J (1910) On microscopic life at Cape Royds. In: Murray J (ed) British Antarctic expedition 1907–1909, reports on the scientific investigations. Biology 1. Heinemann, London, pp 18–22
55. Nunn CL, Barton RA (2001) Comparative methods for studying primate adaptation and allometry. Evol Anthropol 10:77–116 56. O’Malley MA (2007) The nineteenth century roots of ‘everything
is everywhere’. Nat Rev Microbiol 5:647–651
57. Ogden CG, Hedley RH (1980) An atlas of freshwater testate amoebae. British Museum (Natural History), London
58. Pace NR (1997) A molecular view of microbial diversity and the biosphere. Science 276:734–740
59. Penard E (1911) Rhizopodes d’eau douce. In: Murray J (ed) British Antarctic Expedition 1907–1909, reports on the scientific investigations. Biology 1. Heinemann, London, pp 203–263 60. Richters F (1908) Moosbewohner. In: Nordenskjöld OG (ed)
Wissenschaftliche Ergebnisse der Schwedischen Südpolar-Expedition 1901–1903, (Zool II) 6, pp 1–16
61. Richters F (1908) Die Fauna der Moosrasen des Gaussbergs und einiger südlicher Inseln Deutsch Südpolar-Expedition 1901–1903. (Zool I) 9:259–302
62. Sandon H (1924) Some protozoa from the soils and mosses of Spitsbergen. Results of the Oxford University Expedition to Spitsbergen No. 27. Zool J Linn Soc Lond 35:449–475
63. Sandon H (1927) The composition and distribution of the protozoan fauna of the soil. Oliver and Boyd, Edinburgh 64. Sandon H, Cutler DW (1924) Some protozoa from the soils
collected by the QUEST expedition (1921–1922). Zool J Linn Soc Lond 36:1–16
65. Shen YF (1983) Protozoa of the Tibetan Plateau. In: Jiang XZ, Shen YF, Gong XJ (eds) Aquatic invertebrates of the Tibetan Plateau. Science Press, Beijing, pp 48–100
66. Sherratt TN, Wilkinson DM, Bain RS (2005) Explaining dioscorides’ “double difference”; why are some mushrooms poisonous and do they signal their unprofitability? Am Nat 166:767–775
67. Smith HG (1978) The distribution and ecology of terrestrial protozoa of sub-Antarctic and maritime Antarctic islands. Sci Rep Br Antarct Surv 95:1–104
68. Smith HG (1982) The terrestrial protozoan fauna of South Georgia. Polar Biol 1:173–179
69. Smith HG (1986) The testate rhizopod fauna of Drepanocladus moss carpet near Rothera Station, Adelaide Island. Br Antarct Surv Bull 72:77–79
70. Smith HG (1987) A species-poor testate rhizopod fauna on Brabant Island. Br Antarct Surv Bull 77:173–176
71. Smith HG (1992) Distribution and ecology of the testate rhizopod fauna of the continental Antarctic zone. Polar Biol 12:629–634
72. Smith HG, Bobrov A, Lara E (2008) Diversity and biogeography of testate amoebae. Biodiversity Conserv 17:329–343
73. Smith HG, Wilkinson DM (1987) Biogeography of testate rhizopoda in the southern temperate and Antarctic zones. Com Nat Fr Rech Antarct 58:83–96
74. Smith HG, Wilkinson DM (2007) Not all free-living micro-organisms have cosmopolitan distributions—the case of Nebela (Apodera) vas Certes (Protozoa: Amoebozoa: Arcellinida). J Biogeogr 34:1822–1831
75. Stout JD (1970) The bacteria and protozoa of some soil samples from Scoresby Land, East Greenland. Medd Gronl 148:1–22
76. Sudzuki M (1964) On the microfauna of the Antarctic region. 1. Moss-water community at Langhovde. JARE Sci Rep (E) 19:1–41 77. Telford RJ, Vanduck V, Birks HJB (2007) Response to comments on ‘Dispersal limitation matters for microbial morphospecies’. Science 316:1124c
78. Todorov M, Golemansky V, Mitchell EAD, Heger TJ (2009) Morphology, biometry, and taxonomy of freshwater and marine interstitial Cyphoderia (Cercozoa: Euglyphida). J Eukaryot Micro-biol 56:279–289
79. Trappeniers K, van Kerckvoode A, Chardez D, Nijs I, Beyens L (1999) Ecology of testate amoebae communities from aquatic habitats in the Zackenberg area (northeast Greenland). Polar Biol 22:271–278
80. Valdecasas AG, Camacho AI, Peláez ML (2006) Do small animals have a biogeography? Exp Appl Acarol 40:133–144
81. Van Kerckvoorde A, Trappeniers K, Chardez D, Nijs I, Beyens L (2000) Testate amoebae communities from terrestrial moss habitats in the Zackenberg area (north-east Greenland). Acta Protozool 39:27–33
82. Vincke S (2006) Diversity and ecology of the testate amoebae fauna of Île de la Possession (Crozet Archipelago, sub-Antarctica). Ph.D. thesis, Faculteit Wetenschappen, Universiteit Antwerpen, p 260
83. Vincke S, Gremmen N, Beyens L, Van De Vijver B (2004) The moss-dwelling testacean fauna of Île de la Possession. Polar Biol 27:753–766
84. Vincke S, Lederganck P, Beyens L, Van De Vijver B (2004) Soil testate amoebae from sub-Antarctic Îles Crozet. Antarct Sci 16:165–174
85. Vincke S, Van De Vijver B, Matteheusen R, Beyens L (2004) Freshwater testate amoebae communities from Île de la posses-sion, Crozet Archipelago, sub-Antarctica. Arct Antarct Alp Res 36:584–590
86. Vincke S, Van de Vijver B, Beyens L (2006) A synopsis of the testate amoebae fauna of Île de la Possession (Crozet Archipelago, sub-Antarctica). Antwerp University Press, Belgium
87. Vincke S, Van de Vijver B, Gremmen N, Beyens L (2006) The moss dwelling testacean fauna of the Strømness Bay (South Georgia). Acta Protozool 45:65–75
88. Wang CC (1974) Protozoa from Qomolangma Feng (Mount Jolmolungma) Area. In: The scientific reports of the compre-hensive scientific expedition of the Qomolangma Feng Area (1966–1968), biology and alpine physiology. Science Press, Beijing, pp 145–172
89. Wang CC (1977) Protozoa from some districts of Tibetan Plateau. Acta Zool Sin 23:131–160
90. Wilkinson DM (1998) Fragments of an entangled bank: do ecologists study most of ecology? Oikos 82:393–394
91. Wilkinson DM (2001) What is the upper size limit for cosmopolitan distribution in free-living microorganisms? J Biogeogr 28:285–291
92. Wilkinson DM (2008) Testate amoebae and nutrient cycling: peering into the black box of soil ecology. Trend Ecol Evol 23:596–599
93. Wilkinson DM, Smith HG (2006) An initial account of the terrestrial protozoa of Ascension Island. Acta Protozool 45:407– 413
94. Yang J, Zhang WJ, Feng WS, Shen YF (2005) Testate amoebae (Protozoa: Rhizopoda) from northwest Yunnan, China. J Fresh-water Ecol 20:583–590
95. Yang J, Zhang WJ, Feng WS, Shen YF (2005) Freshwater testate amoebae of nine Yunnan Plateau lakes, China. J Freshwater Ecol 20:743–750
96. Yang J, Zhang WJ, Feng WS, Shen YF (2006) Geographical distribution of testate amoebae in Tibet and northwestern Yunnan and their relationships with climate. Hydrobiologica 559:297–304 97. Yang J, Zhang WJ, Shen YF (2009) Relationships between testate amoebae assemblages (Protozoa) and geographic factors in Yunnan Plateau lakes, China. J Freshwater Ecol 24:437–443