Rapid decline of snow and ice in the tropical Andes
– Impacts, uncertainties
and challenges ahead
Mathias Vuille
a,⁎, Mark Carey
b, Christian Huggel
c, Wouter Buytaert
d, Antoine Rabatel
e,
Dean Jacobsen
f, Alvaro Soruco
g, Marcos Villacis
h, Christian Yarleque
a, Oliver Elison Timm
a,
Thomas Condom
e, Nadine Salzmann
c,i, Jean-Emmanuel Sicart
eaDept. of Atmospheric & Environmental Sciences, Univ. at Albany, Albany, NY, USA
bRobert D. Clark Honors College, University of Oregon, Eugene, OR, USA
cDept. of Geography, Univ. of Zurich, Switzerland
dDept. of Civil and Environmental Engineering, Imperial College London, London, UK
eUniv. Grenoble Alpes, CNRS, IRD, Institut des Géosciences de l'Environnement (IGE), Grenoble, France
fFreshwater Biological Laboratory, Dept. of Biology, University of Copenhagen, Copenhagen, Denmark
gInstituto de Investigaciones Geológicas y del Medio Ambiente, Universidad Mayor de San Andres, La Paz, Bolivia
hDepto. de Ingenieria Civil y Ambiental, Escuela Politecnica Nacional, Quito, Ecuador
iDept. of Geosciences, Univ. of Fribourg, Switzerland
Glaciers in the tropical Andes have been retreating for the past several decades, leading to a temporary increase in dry season water supply downstream. Projected future glacier shrinkage, however, will lead to a long-term reduction in dry season river discharge from glacierized catchments. This glacier retreat is closely related to the observed increase in high-elevation, surface air temperature in the region. Future projections using a simple freezing level height- equilibrium-line altitude scaling approach suggest that glaciers in the inner tropics, such as Antizana in Ecuador, may be most vulnerable to future warming while glaciers in the more arid outer tropics, such as Zongo in Bolivia, may persist, albeit in a smaller size, throughout the 21st century regardless of emission scenario. Nonetheless many uncertainties persist, most notably problems with accurate snowfall measurements in the glacier accumulation zone, uncertainties in establishing accurate thickness measurements on glaciers, unknown future changes associated with local-scale circulation and cloud cover affecting glacier energy balance, the role of aerosols and in particular black carbon deposition on Andean glaciers, and the role of groundwater and aquifers interacting with glacier meltwater.
The reduction in water supply for export-oriented agriculture, mining, hydropower production and human consumption are the most commonly discussed concerns associated with glacier retreat, but many other aspects including glacial hazards, tourism and recreation, and ecosystem integrity are also affected by glacier retreat. Social and political problems surrounding water allocation for subsistence farming have led to conflicts due to lack of adequate water governance. Local water management practices in many regions reflect cultural belief systems, perceptions and spiritual values and glacier retreat in some places is seen as a threat to these local livelihoods.
Comprehensive adaptation strategies, if they are to be successful, therefore need to consider science, policy, culture and practice, and involve local populations. Planning needs to be based not only on future scenarios derived from physically-based numerical models, but must also consider societal needs, economic agendas, political conflicts, socioeconomic inequality and cultural values. This review elaborates on the need for adap-tation as well as the challenges and constraints many adapadap-tation projects are faced with, and lays out future directions where opportunities exist to develop successful, culturally acceptable and sustainable adaptation strategies.
⁎Corresponding author at: Department of Atmospheric and Environmental Sciences, University at Albany, SUNY, 1400 Washington Ave., Albany, NY 12222, USA.
E-mail address:[email protected](M. Vuille).
http://doc.rero.ch
Published in "Earth-Science Reviews 176 (): 195–213, 2018"
which should be cited to refer to this work.
1. Introduction
Glaciers in the tropical Andes have been retreating rapidly during the past decades, thereby temporarily increasing water supply in dry regions downstream. Yet this increase is not sustainable, as glaciers continue to shrink. Hence glacier retreat poses a significant challenge for adaptation of a variety of natural and human systems throughout the region. Almost all (> 99%,Kaser, 1999) of the remaining glaciers in the tropics are located in the Andes; hence the situation in this region is of particular relevance. Glaciers are also very helpful visual indicators of our rapidly changing environment and can serve as sentinels of rapid climate change. This is especially the case for tropical glaciers, which
are considered highly sensitive to changes in climate (Kaser and
Osmaston, 2002).
Glacier retreat in the tropical Andes is of particular concern for a variety of reasons. First, unlike mid- and high-latitude mountain re-gions, there is no seasonal snow cover outside the glacierized areas, which could provide for an additional buffer and contribution to sea-sonal river discharge. Because of the high solar radiation all year long, snow falling outside of glacierized areas melts within a matter of a few days (Lejeune et al., 2007; Wagnon et al., 2009). While this snowmelt may contribute to immediate river discharge or potentially to ground-water recharge, it prevents the build-up of a seasonal snowpack that can provide water at the beginning of the dry season. Secondly, the southern tropical Andes (central and southern Peru and Bolivia) ex-perience a long and sustained dry season that lasts betweenfive and six months from April until September (Garreaud et al., 2003). During this period rainfall is virtually absent and the glacier meltwater contribution is fundamentally important for socioeconomic activities and environ-mental services, especially those that take place in close proximity to the glacierized catchments (Barnett et al., 2005; Bradley et al., 2006; Kaser et al., 2010). This is why glacier retreat is much more of a concern in the semiarid southern tropical Andes, at least from a water supply perspective.
The northern tropical Andes (Colombia, Venezuela and Ecuador) experience a much more humid climate with shorter dry periods and some rainfall throughout the year. In addition, glaciers are generally smaller in this region, and wetland ecosystems called páramos, can provide for additional water storage, as their soils have a very high water retention capacity (Buytaert et al., 2006, 2011). Nonetheless, even in Ecuador glacier melt can temporarily provide for a significant
baseflow that can become relevant during extreme drought periods
(Sicart et al., 2015).
The spatial extent and pace of Andean glacier retreat have been documented in numerous studies, including two fairly recent in-depth reviews (Vuille et al., 2008a; Rabatel et al., 2013). Similarly, the large-scale drivers of this retreat, such as increasing temperature (Vuille and Bradley, 2000; Bradley et al., 2009; Schauwecker et al., 2014; Vuille et al., 2015) or potential changes in the spatiotemporal characteristics of snowfall (Vuille and Ammann, 1997; Mernild et al., 2016; Saavedra et al., 2016), thereby altering the glacier's energy and mass balance, have been widely studied and discussed. Hence the goal of this paper is not to provide yet another detailed review of these observed changes, but rather to look ahead as to what impacts the region will face over the coming decades as glaciers continue to retreat and some eventually disappear.
While much emphasis in recent years has been put on better un-derstanding the supply side of water resources through glacio-hydro-logic modeling under a variety of future scenarios, there is an in-creasing recognition that much of the future water scarcity and struggles over allocation and access to clean water may be driven pri-marily by the demand side (Carey et al., 2017). Indeed in wide regions of the tropical Andes water scarcity will increase regardless of climate change scenario, speed and magnitude of glacier retreat (Buytaert and de Bievre, 2012). It is therefore indispensable to include socioeconomic, cultural, legal and political aspects of water use and regulations at all
stages of future socio-hydrologic modeling attempts (e.g.Carey et al., 2014). In addition glacier retreat increases the potential for natural hazards, affects ecosystem composition in rivers downstream and may impact economic sectors such as tourism or mining. Social values, local perceptions and cultural beliefs are also closely intertwined with water use and the existence of glaciers in the region. The major aim of this review is thus to identify how glacier retreat affects Andean natural and human systems today and to identify major gaps and roadblocks for current adaptation efforts. A special emphasis will be put on the chal-lenges that loom going forward, as Andean nations start implementing adaption measures to address these impacts, in the light of large un-certainties associated with future climate projections. Thereby we hope to contribute to the discussion surrounding the major challenges but also potential opportunities for climate change adaptation in the region today.
2. Current state of glaciers and climate change in the tropical Andes
Two recent comprehensive reviews on the current state of Andean glaciers and their response to climate change were published byVuille et al. (2008a)andRabatel et al. (2013). Both studies picture a situation characterized by a rapidly shrinking surface area, length and volume of glaciers due to an almost continuously negative mass balance, parti-cularly since the late 1970s. Superimposed on the negative trends are variations on interannual and decadal time scales, that primarily reflect the state of tropical Pacific sea surface temperatures (SST), with often (but not always) significant mass loss during warm episodes associated with El Niño events, while cold phases (La Niña) tend to lead to less negative or in some cases even balanced or slightly positive mass bal-ance (e.g.,Francou et al., 2003, 2004; Vuille et al., 2008b; Favier et al., 2004; Lopez-Moreno et al., 2014; Veettil et al., 2014).Wagnon et al. (2001)and more recently Maussion et al. (2015)examined the role played by the El Niño - Southern Oscillation (ENSO) phenomenon in more detail and quantified the various energy fluxes that contribute to ENSO-related mass balance anomalies on glaciers in the Cordillera Real, Bolivia, and Cordillera Blanca, Peru (see Fig. 1), respectively. They confirmed that the influence of El Niño is transmitted primarily through reduced and delayed snow accumulation and increased air temperature, causing an elevated rasnow line, lowered albedo and therefore in-creased absorption of short-wave radiation. The higher temperature also leads to an increased sensible heatflux, while the precipitation deficit during most El Niño events contributes directly to a more
ne-gative mass balance (reduced snow accumulation and albedo effect
(Wagnon et al., 2001; Sicart et al., 2011)).
While ENSO events lead to significant interannual variability of Andean glaciers' energy and mass balance, the long-term negative trend cannot be pinned on tropical Pacific SST's (Vuille et al., 2015). In fact paleoclimatic studies show that throughout the Andes, glaciers have been retreating for a long period of time. They reached a relative maximum extent sometime during the Little Ice Age (LIA) between the middle of the 17th and the beginning of the 18th century, likely asso-ciated with cooler and wetter conditions. The exact timing of this ad-vance however, varies somewhat depending on the mountain range considered (Rabatel et al., 2006, 2008; Solomina et al., 2007; Jomelli et al., 2009). But in most locations glaciers have been receding ever since, except for a few intermittent periods of glacier stabilization or even mass gain, such as occurred for example in the mid 1960s to early 1970s in the Cordillera Real. According toRabatel et al. (2013), the retreat has accelerated over the past three decades, with an average mass loss in the tropical Andes estimated at−0.76 m water equivalent (w.e.) over the period 1976–2010. This suggests that glaciers in the tropical Andes are characterized by a more negative mass balance than the average glacier monitored in the rest of the world (see Fig. 7 in
Rabatel et al., 2013). Glaciers located entirely below 5400 m above sea level (a.s.l.) are generally small (< 1 km2) compared to high-altitude
glaciers and experience an even more negative mass balance and more rapid decline. Indeed these glaciers in their majority appear to be very
unbalanced (negative mass balance of −1.2 m w.e. over the past 3
decades, compared to −0.6 m w.e. for glaciers that extend above
5400 m a.s.l.), with many of them likely to disappear in the coming decades (Rabatel et al., 2013). It is noteworthy that these glaciers re-present the majority of all glaciers in the tropical Andes (e.g. 80% in the Bolivian Cordillera Real in 1975), corresponding to half of the gla-cierized surface area (Soruco et al., 2009). Overall the current rate of glacier loss appears to be unprecedented for the period over which reasonably accurate reconstructions exist (since the early 18th century).
Since the publication ofRabatel et al. (2013) a few new studies
focusing on specific mountain ranges have been published, which all
essentially confirm the results described above. Braun and Bezada
(2013)for example have documented in great detail the rapid shrinkage and looming disappearance of tropical glaciers from the Andes in
Ve-nezuela. Hanshaw and Bookhagen (2014) and Lopez-Moreno et al.
(2014), based on a long series of satellite images, highlighted the rapid shrinkage of glaciers in the Cordillera Vilcanota and Huaytapallana, respectively. Both studies identified significant and fast glacier retreat with a > 50% surface area loss in the Cordillera Huaytapallana be-tween 1984 and 2011 and a roughly 25% area loss in the Cordillera Vilcanota between 1962 and 2009.
These observed changes in glacier extent in the tropical Andes are consistent with observations of temperature and precipitation changes in the Andes during this same time period. A number of studies have presented evidence for a rapidly changing climate in the tropical Andes.
Vuille and Bradley (2000)first documented a clear warming trend over
the Andes in the 20th century (based on a large number of in-situ sta-tion data), covering the tropical Andes from Ecuador to northern Chile. They also identified, for the first time, that the observed warming ap-peared to be dependent on elevation and slope. Follow-up studies by
Vuille et al. (2003, 2008a)documented a warming of roughly 0.1 °C per decade since the 1950s, when averaged over the entire tropical Andes south of the equator. These results are consistent with more regional
temperature trend analyses performed later by Racoviteanu et al.
(2008),Poveda and Pineda (2009),Bradley et al. (2009),Gilbert et al. (2010),Lavado Casimiro et al. (2013),Salzmann et al. (2013),Seiler et al. (2013a)andLopez-Moreno et al. (2014, 2016)in various locations of the Andes. More recentlySchauwecker et al. (2014)andVuille et al. (2015)analyzed the apparent slowdown of the warming, which may have been linked with the cooling observed over the eastern tropical Pacific and the cool phase of the Pacific Decadal Oscillation (PDO) since
the early 2000s. According to these studies, however, the Pacific
cooling affected primarily low-level coastal locations along the Pacific shore, while the highest elevations in the tropical Andes have continued to warm during this‘hiatus’ period. In fact, as documented byVuille et al. (2015), the warming at higher elevation in the tropical Andes now appears to have emerged outside the range of natural variability, ef-fectively decoupling Andean temperature from the SST forcing in the Pacific, which in previous decades served as a strong predictor for cold or warm periods in the Andes.
Precipitation trends on the other hand are much more subtle and difficult to identify, partly due to the paucity of long, high-quality ob-servational records and partly due to the strong modulation of pre-cipitation by topography, introducing significant east-west gradients
between the arid Pacific coast and the humid Amazon basin, thereby
rendering precipitation trends inherently more heterogeneous.Vuille
et al. (2003)initially suggested a tendency toward slightly increased precipitation in the inner tropics (north of 11°S) and a decrease in the outer tropical Andes further south, although they emphasized that trends at individual stations were mostly insignificant. These results
were later confirmed in a follow-up study byHaylock et al. (2006),
identifying the same north-south contrast in precipitation trends. More
recently Salzmann et al. (2013) and Lavado Casimiro et al. (2013)
analyzed rainfall trends in the southern Peruvian Andes with newer and denser data sets and were unable tofind significant trends over the past 40 years. Instead most of the variability in the data appears to be as-sociated with interannual variability driven by the ENSO phenomenon (Rau et al., 2016).
In summary all these studies strongly link the observed glacier re-treat to an increase in temperature— as the diverging and mostly in-significant trends in precipitation seem inconsistent with the coherent and strong glacier retreat observed throughout the tropical Andes re-gion. We wish to stress, however, that estimating snowfall totals in the accumulation zone of Andean glaciers is associated with large un-certainties (seeSection 4.1) and that past changes in snow accumula-tion in the highest reaches of the tropical Andes are virtually unknown, except for a few point-estimates based on ice-core studies (see review in
Vimeux et al., 2009). In addition, tropical glacier energy balance of course strongly depends on the seasonal distribution of precipitation. This distribution can change without being reflected in annual snowfall
totals and may also affect seasonal temperature trends, for example
through a delay of the wet season and reduced cloud cover.
3. Challenges for future projections– where are we headed?
3.1. Climate projections
Studies invoking future temperature projections in the Andes are quite limited and have focused primarily on free-tropospheric tem-perature.Bradley et al. (2004, 2006)were thefirst to consider future changes in free-tropospheric temperature along the Andes Cordillera by employing a multi-model ensemble from the Coupled Model Inter-comparison Project Phase 2 + (CMIP2 +) and 3 (CMIP3) under a
2 × CO2and the Intergovernmental Panel on Climate Change (IPCC)
Special Report on Emission Scenarios (SRES) A2 scenario, respectively. According to their results, by the end of the 21st century the peak
elevations of the tropical Andes might warm by up to 4°–5 °C when
compared to the base period (1990–1999) under a high emission sce-nario. The authors in these studies also pointed out that the models
consistently simulated an amplified warming at higher elevations,
Fig. 1. Map of the tropical Andes, with locations of glaciers and mountain ranges dis-cussed in the text. White box (2°N–18°S/65°–82°W) indicates area over which CMIP 5 models were averaged to derive simulated historical and projected temperature change over the Andes.
although they did not diagnose or quantify the feedbacks involved in
this elevation-dependent warming. Urrutia and Vuille (2009)
subse-quently employed a regional climate model to simulate both near-sur-face and free-tropospheric temperature change by the end of the 21st
century, compared to the 1961–90 average, based on the SRES B2 and
A2 scenarios. Their results also indicated that the warming would be amplified at higher elevations going forward, reaching up to 5–6 °C at the highest elevations in the A2 scenario and about half that amount in
the lower emissions scenario B2.Urrutia and Vuille (2009) further
pointed out that not only will temperature increase, but the interannual variability will also be considerably enhanced, especially in the A2 scenario, leading to a higher probability of extremely warm years. Their study, however, was based on only one climate model, which, as shown byBuytaert et al. (2010), can lead to large uncertainties in the inter-pretation, as ideally an ensemble of regional climate models should be
used for such numerical downscaling applications. Thibeault et al.
(2010)took a different approach by focusing on future projections of
temperature extremes, such as heat waves, warm nights or frost days on the Bolivian Altiplano as simulated by an ensemble of CMIP3 models in the SRES B1, A1B and A2 scenarios. According to their results, frost days are projected to decrease by 2–4 standard deviations in all sce-narios by the end of the 21st century when compared to the reference year 2000, while warm nights and heat waves will become more
fre-quent by 3–7 standard deviations (warm nights) and 1–4 standard
de-viations (heat waves) respectively, by the year 2100. More recently
Seiler et al. (2013b)analyzed both CMIP3 and CMIP5 models over Bolivia to estimate future temperature changes under a range of emis-sion scenarios. According to their results, temperature in Bolivia will increase anywhere from 2.5 °C to 6 °C by the end of the century com-pared to the 1961–90 period, depending on model and emission sce-nario considered.
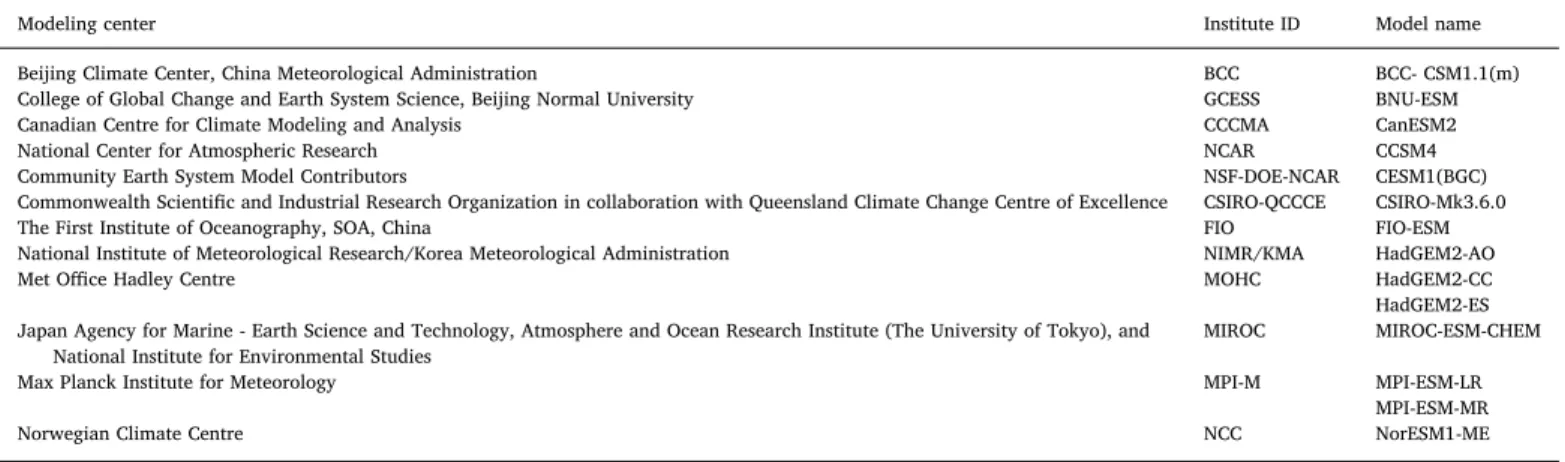
Here we use seven CMIP5 models (HadGEM2-AO, HadGEM2-CC, HadGEM2-ES, MIROC-ESM-CHEM, MPI-ESM-LR, MPI-ESM-MR and
NorESM1-ME, seeTable 1) to analyze how surface temperature might
evolve throughout the 21st century in the tropical Andes. We calculate anomalies with respect to the 1961–1990 reference period and analyze results from a moderate (Representative Concentration Pathway, RCP 4.5) and a high-emission (RCP 8.5) scenario to probe future outcomes. In order to compare future projections with past temperature trends we average the model data over a box (2°N-18°S/65°-82°W, seeFig. 1) that approximates the station coverage used for the recent Andean
tem-perature re-assessment in Vuille et al. (2015) and we also analyze
temperature trends in historical CMIP5 simulations of the same seven models since 1950. For each simulation we select one ensemble member per model.
Results of our analyses are shown in Fig. 2. They suggest that
temperature in the tropical Andes might continue to increase by 1°–5 °C
(mean values of 2°–3.5 °C) beyond the 1961–90 values. This warming is less than what was reported previously in some of the studies discussed above, but it should be kept in mind that these are surface and not free-tropospheric trends and that they represent a large-scale average over a model topography that is significantly lower than reality. Hence surface warming is likely to be larger than these values reported here at high elevations where glaciers are located (seeVuille et al., 2015). Tem-perature trends associated with rising freezing levels and implications for the rise of the equilibrium-line altitude (ELA) of tropical Andean glaciers are analyzed separately inSection 3.2. It is noteworthy that the trend in the simulated warming over the historical period (1950–2005) is consistent with the observed warming byVuille et al. (2015). But of course averaging over multiple models tends to reduce the interannual variability when compared with the observational record, as inter-annual signals related to internal variability (e.g. ENSO) are not in phase between models.
Several studies have tried to constrain future precipitation
Table 1
CMIP5 Models used in analysis of surface temperature and/or freezing level height.
Modeling center Institute ID Model name
Beijing Climate Center, China Meteorological Administration BCC BCC- CSM1.1(m)
College of Global Change and Earth System Science, Beijing Normal University GCESS BNU-ESM
Canadian Centre for Climate Modeling and Analysis CCCMA CanESM2
National Center for Atmospheric Research NCAR CCSM4
Community Earth System Model Contributors NSF-DOE-NCAR CESM1(BGC)
Commonwealth Scientific and Industrial Research Organization in collaboration with Queensland Climate Change Centre of Excellence CSIRO-QCCCE CSIRO-Mk3.6.0
The First Institute of Oceanography, SOA, China FIO FIO-ESM
National Institute of Meteorological Research/Korea Meteorological Administration NIMR/KMA HadGEM2-AO
Met Office Hadley Centre MOHC HadGEM2-CC
HadGEM2-ES Japan Agency for Marine - Earth Science and Technology, Atmosphere and Ocean Research Institute (The University of Tokyo), and
National Institute for Environmental Studies
MIROC MIROC-ESM-CHEM
Max Planck Institute for Meteorology MPI-M MPI-ESM-LR
MPI-ESM-MR
Norwegian Climate Centre NCC NorESM1-ME
-2.0 -1.0 0.0 1.0 2.0 3.0 4.0 5.0 1950 1970 1990 2010 2030 2050 2070 2090
Year
Sur
fac
e air temperatur
e anomla
y (°C
)
observations historical RCP 4.5 RCP 8.5Fig. 2. Simulated and observed annual mean air temperature anomalies in the tropical
Andes (departures from 1961 to 1990 mean) derived from station data (Vuille et al.,
2015, green, 1950–2010), historical CMIP5 (gray, 1950–2005), and future CMIP5
sce-narios (RCP 4.5 in light blue and RCP 8.5 in red, 2006–2100). CMIP5 data averaged over
box 2°N-18°S, 65–82°W to match distribution of station data inVuille et al. (2015).
Shading indicates ± 1.64 std. dev. (5–95% range across models). (For interpretation of
the references to colour in thisfigure legend, the reader is referred to the web version of
this article.)
projections for the Andes, using a variety of different approaches. Most
recentlyNeukom et al. (2015)were able to show that precipitation
during the austral summer wet season (DJF) might drop below the range of natural variability in the central Andes of Bolivia and southern Peru within a matter of a few decades. Their analysis was based on a combination of proxy evidence from tree rings and ice cores since the year 1000 CE with historical model runs and future Coupled Model Intercomparison Project Phase 5 (CMIP5)-based projections out to the
year 2100 CE. These results are consistent with earlier findings by
Urrutia and Vuille (2009), Minvielle and Garreaud (2011) and
Thibeault et al. (2010, 2012) who used dynamical and statistical downscaling techniques, respectively, to determine future changes in precipitation, based on the older IPCC-SRES scenarios. While these projections of a roughly 10–30% decrease in precipitation by the end of the century appear to be quite robust, given that they have been re-produced by multiple studies employing different methodologies, the uncertainty regarding future precipitation changes is much larger in the
more humid inner tropics.Buytaert et al. (2010) and more recently
Zulkafli et al. (2016), for example, showed that in the Andes of Ecuador, models have difficulties in even agreeing on the sign of future changes in precipitation. Nevertheless, some studies suggest that the
moistureflux from the Amazon basin to the Andes may weaken under a
future warming-scenario (e.g.Marengo and Espinoza, 2016).
3.2. Glaciologic projections
For longer-term projections of future watershed hydrology a quan-titative prediction as to how the glacier area and volume will change over time is essential (e.g.Frans et al., 2015). Ideally this requires a realistic simulation of dynamic glacierflow, which is still a challenge in hydro-glaciologic modeling. In addition the coupling between large-scale climatic information, derived from historical simulations or future projections of climate change, and glaciologic and hydrologic models requires downscaling of the climate information to the catchment scale to bridge this scale mismatch. Some studies have circumvented this problem by general approximations of temperature focusing on the close coupling between the ELA of tropical glaciers and the 0 °C iso-therm (the freezing level) (Condom et al., 2007; Rabatel et al., 2012; Sagredo et al., 2014), while others have exploited the relationship
be-tween freezing level height (FLH) and glacier extent (Schauwecker
et al., 2017). As shown inFig. 3, there is indeed a close relationship between FLH and glacier ELA in the tropical Andes on interannual time
scales, consistent with previous reports (Vuille et al., 2008a; Bradley et al., 2009; Rabatel et al., 2013). In our analysis we focus on glaciers Antizana (0°29′S, 78°09′W, 4780–5760 m, Ecuador), Artesonraju (8°57′S, 77°27′W, 4685–5979 m, Peru) and Zongo (16°15′S, 68°10′W,
4900–6000 m, Bolivia), which have the longest mass balance time
series available, and which allow us to probe a set of glaciers re-presentative of inner and outer tropical sites (Fig. 1). The ELA data are
based on measurementsfirst published (and subsequently updated) in
Rabatel et al. (2012),Loarte et al. (2015)andBasantes-Serrano et al. (2016).
Both ELA and FLH values were calculated based on averages over the hydrologic year. The Antizana mass balance value from 2003 was omitted from the analyses, as it was a large outlier, inconsistent with the relationship shown inFig. 3. Indeed glacier mass balance estimates
on Antizana are known to suffer from significant uncertainties due to
difficulties in obtaining accurate measurements from the accumulation zone (Basantes-Serrano et al., 2016).
Schauwecker et al. (2014)have shown that significant differences exist between reanalysis products, when assessing free tropospheric temperature trends over the Andes, with NCEP/NCAR showing stronger warming at mid-tropospheric levels than ERA-Interim. Here we there-fore probe these same two products in assessing trends in FLH and its relationships with the ELA in different mountain regions. The FLH was calculated by linearly interpolating temperature and geopotential height between 500 and 600 hPa and then extracting geopotential height at the interpolated level where temperature equals 0 °C. This was done separately for both reanalysis products and each location (grid cell covering glacier site).
Fig. 3shows that the ELA is significantly correlated (p < 0.05) with
FLH at all sites. Depending on reanalysis product, changes in FLH ex-plain between roughly half and two thirds of the total variance in the ELA on Zongo, Artesonraju and Antizana, respectively. The slope of the relationship tends to be steeper in the inner tropics (Antizana) and
becomeflatter toward the outer tropics (Zongo), consistent with the
tendency of inner tropical glaciers to be more sensitive to direct tem-perature variations, while outer tropical glaciers, where the ELA is several hundred meters above the FLH, tend to be more strongly tied to changes in hydrologic variables (Favier et al., 2004). ERA slopes are steeper than those derived from NCEP/NCAR, but all slopes are sig-nificantly different from zero (F-test, p < 0.05).
We next employed the relationships examined above to probe future changes in the ELA at these three glacier locations. Wefirst calculated
4700 4800 4900 5000 5100 5200 5300 5400 4700 4800 4900 5000 5100 Antizana (1996-2002 / 2004-2012) r = 0.74 (p<0.005) ELA = 1386.5 + 0.76 FLH Artesonraju (2000-2010) r = 0.81 (p<0.01) ELA = 1656.1 + 0.66 FLH Zongo (1991-2015) r = 0.72 (p<0.005) ELA = 2103.3 + 0.62 FLH
a)
NCEP/NCAR Freezing Level Height [m]
Equilibrium Line Altitude [m]
Z ongo and Ar teson 4900 5000 5100 5200 5300 5400 4700 4800 4900 5000 5100
Equilibrium Line Altitude [m]
Antizana
ERA-Interim Freezing Level Height [m]
Zongo (1991-2015) r = 0.67 (p<0.01) ELA = 1986.5 + 0.64 FLH Artesonraju (2000-2010) r = 0.75 (p<0.05) ELA = 407.1 + 0.92 FLH Antizana (1996-2002 / 2004-2012) r = 0.74 (p<0.005) ELA = 694.4 + 0.90 FLH
b)
Fig. 3. Scatterplot and ordinary least squareslinear regression of hydrologic year ELA vs. FLH on glaciers Zongo (Bolivia), Artesonraju (Peru) and Antizana (Ecuador). FLH is derived
from a) NCEP/NCAR (Kalnay et al., 1996) and
b) ERA-Interim (Dee et al., 2011). ELA data is
fromRabatel et al. (2012),Loarte et al. (2015)
and Basantes Serrano et al. (2016).
the FLH over the glacier sites based on geopotential height and tem-perature at 500 hPa and 600 hPa using one ensemble member each from eight different CMIP5 models (BCC-CSM1.1(m), BNU-ESM, CanESM2, CCSM4, CESM1(BGC), CSIRO-Mk3.6.0, FIO-ESM and
HadGEM2-AO, seeTable 1). We applied this methodology to CMIP5
historical simulations (1950–2005), a medium- and a high-emission scenario (RCP4.5 and RCP 8.5, 2006–2100). Next future changes in the ELA were calculated based on the simulated FLH in the eight models and applying both reanalysis-scaling methods, resulting in a total of 16 ELA trajectories for each scenario and glacier.Fig. 4shows the resulting
future mean ELA trajectory and the 5–95% confidence intervals under
both emission pathways as well as for the historical simulations. We
also include the observed ELA reconstructions from Rabatel et al.
(2012), Loarte et al. (2015) and Basantes-Serrano et al. (2016) for comparison. All model time series are corrected for biases in their calculated ELA, by adjusting their ELA to match observations for the reference year 2005 at the respective glacier sites. The average ELA bias for the period of overlap between observations and historical CMIP5
data is 53.8 m (Antizana), −23.4 m (Artesonraju) and −50.2 m
(Zongo) when applying the NCEP/NCAR scaling and 50.7 m (Antizana), −3.0 m (Artesonraju) and −70.4 m (Zongo) when applying the ERA-Interim scaling.
It is noteworthy that ERA-Interim and NCEP/NCAR show very si-milar trends in FLH (and hence ELA calculations) over the historical period and that the spread in the future model trajectories of the ELA is not caused by differences between ERA and NCEP scaling methods, but
by CMIP5 intra-model differences (not shown). This may seem in
con-tradiction to results bySchauwecker et al. (2014), which showed little warming at 500 hPa in the ERA reanalysis when compared to NCEP/ NCAR. However, changes in FLH depend on changes in geopotential
height as well; a variable, which indeed shows a significant upward
trend at 500 hPa in the ERA data over the Andes. In other words, while temperature at the 500 hPa level may not have increased much, this temperature is being measured at an increasingly higher elevation, re-flecting the overall warming of the tropical mid-troposphere. Hence
interpreting temperature trends at fixed pressure levels can be
mis-leading and should ideally be converted to absolute elevations above sea level.
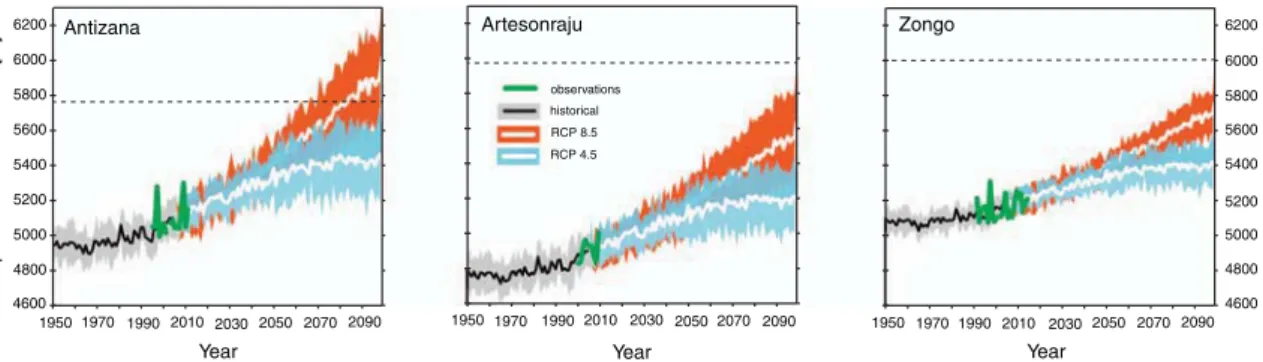
The results inFig. 4suggest that the future rise of the ELA, as a result of an increase in FLH, will affect inner tropical sites such as Antizana the most. Based on our results Antizana glacier will likely be lost under a high emission scenario while a smaller glacier may be able to persist at the highest elevations under the RCP4.5 scenario. These results are consistent with the notion that inner tropical glaciers are more sensitive to changes in temperature, while outer tropical glaciers, such as Zongo, where the ELA is several hundred meters above the FLH,
may be more strongly affected by future changes in the hydrologic
cycle. Indeed our projections of the ELA rise suggest that both Zongo and Artesonraju glaciers may persist as smaller glaciers toward the end
of the 21st century, with the ELA located between ~ 5200 m a.s.l. (RCP4.5) and ~ 5600 m a.s.l. (RCP8.5) on Artesonraju and between ~ 5400 m a.s.l. (RCP4.5) and ~ 5700 m a.s.l. (RCP8.5) on Zongo, re-spectively.
Our analysis is exploratory in nature and we are fully aware that it includes a number of assumptions, uncertainties and simplifications. As shown above, changes in FLH, while fundamentally important, do not explain all the variance in the ELA data. Many other factors also play a role, but were ignored in our analysis. For one, mass balance, and hence the ELA, is also a strong function of accumulation (snowfall). Our analysis implicitly assumes that the role played by snowfall will not change going forward, which may not be the case if seasonality or total snowfall amounts change. Future glacier retreat and hence ELA changes will also depend on the strength of local ice-albedo feedbacks, elevation feedbacks (glacier thinning will expose the glacier surface to higher temperatures at lower elevations regardless of future warming) and edge effects will enhance warm air advection. Given that projections suggest a decrease in future precipitation, at least in the outer tropics (Minvielle and Garreaud, 2011; Neukom et al., 2015) and the fact that all these positive feedbacks were ignored, our estimates likely err on the conservative side.
Regardless of these uncertainties, we consider this analysis a useful first step, as it allows for a fairly straightforward large-scale assessment of the future fate of glaciers in the region. More detailed analyses, which take into account changes in the hydrologic cycle, require fairly complex downscaling procedures. FLH, on the other hand, is a variable that can be derived directly from coarse global models and which is known to be closely related to glacier mass balance in the tropical Andes (Vuille et al., 2008a; Rabatel et al., 2013). Given the large spread between the two emission scenarios and the considerable uncertainty
introduced by CMIP5 model differences, the errors incurred by our
methodology are in all likelihood comparatively small.
There are a few studies that have attempted to make more realistic long-term projections of individual glacier volume and extent using a more sophisticated approach.Réveillet et al. (2015)for example used a 3-dimensional full-Stokes model called Elmer-Ice to simulate the evo-lution of Zongo glacier in the Cordillera Real, Bolivia, for both present-day and future conditions. Implicit in this modeling approach is the assumption that future temperature changes will directly affect the ELA, which is reasonable, given the close relationship between freezing level height and ELA shown above (Fig. 3). Changes in the ELA, on the other hand are directly related to the surface mass balance of the gla-cier. In this approach future glacier volume can be simulated as a de-pendence of future temperature change using CMIP5 model output, assuming that the general vertical mass balance profile remains the same, but will move upslope as a function of a higher ELA. Given that temperature is a more robust variable with much lower uncertainty bounds than for example precipitation, the modeling approach is con-siderably more straightforward. Based on estimates byRéveillet et al.
4800 5000 5200 5400 5600 5800 6000 6200 1950 1970 1990 2010 2030 2050 2070 1950 1970 1990 2010 2030 2050 2070 2090 4600 4800 5000 5200 5400 5600 5800 6000 6200 1950 1970 1990 2010 2030 2050 2070 2090 4600 2090
Antizana Artesonraju Zongo
Equilibr
ium Line Altitude [m]
observations
RCP 8.5 RCP 4.5 historical
Year Year Year
Fig. 4. Past, present and future hydrologic year mean ELA on Antizana, Artesonraju and Zongo glaciers, derived from observations (green), historical CMIP5 (gray), and future CMIP 5
scenarios (RCP 4.5 in light blue and RCP 8.5 in red). Observed ELA data is fromRabatel et al. (2012),Loarte et al. (2015)and Basantes Serrano et al. (2016). CMIP5 ELA's represent
multi-model average, with shading indicating ± 1.64 std. dev. (5–95% range across multi-models). Horizontal dotted black line indicates peak elevation of glacier according toRabatel et al. (2013).
(For interpretation of the references to colour in thisfigure legend, the reader is referred to the web version of this article.)
(2015)Zongo glacier would lose 40%, 69% and 89% of its current ice volume by the end of the 21st century under the three emission sce-narios RCP2.6, RCP6.0 and RCP8.5, respectively. However, this ap-proach neglects any potential future changes in snowfall, which could also affect glacier mass balance. Given the general consensus of a future decrease in precipitation, as portrayed inUrrutia and Vuille (2009),
Minvielle and Garreaud (2011) and more recently confirmed by Neukom et al. (2015), these projections byRéveillet et al. (2015)also have to be considered conservative estimates.
3.3. Hydrologic (water supply-side) projections
The impact of glaciers on the terrestrial water cycle is essentially two-fold: they may alter the catchment water balance, as well as the timing and variability of streamflow. The impact of glaciers on catch-ment runoff is typically considered to be positive because the combined evaporation and sublimation rate of the glacier surface tends to be lower than the evapotranspiration rates of other land-cover types. There is, however, still considerable uncertainty regarding actual sub-limation rates and how they vary regionally, seasonally and along an altitudinal gradient. Average sublimation rates from tropical glaciers
are commonly considered to be on the order of 0.5–1.0 mm d− 1
(Hurley et al., 2016), although sublimation is highly seasonal, with higher values during the dry austral winter, when increased wind speed and the drier boundary layer tend to favor increased sublimation rates.
Wagnon et al. (1999), for example, measured sublimation rates of 0.3 mm d− 1in October and 1.1 mm d− 1in July near the equilibrium line on a glacier in Bolivia. At much higher elevation, at 6340 m a.s.l.,
Wagnon et al. (2003)found values between 0.8 and 1.2 mm d− 1on Nevado Illimani in Bolivia.Winkler et al. (2009)reported significantly
higher sublimation rates in the Andes of Peru, although these results still have to be confirmed at other sites. They performed a detailed study both measuring and modeling sublimation rates on glacier Arte-sonraju and found values as high as 1–5 mm d− 1during the dry season,
although they confirmed that sublimation rates were much lower during the wet season.
Characterizing evapotranspiration from non-glacierized surfaces has equally been a challenge and studies are limited due to lack of me-teorological data.Buytaert et al. (2007) andCórdova et al. (2015), suggested values between 1.8 and 2.0 mm d− 1, but errors are thought to be as high as 30%.Ochoa-Tocachi et al. (2016)calculated reference evapotranspiration in Andean catchments from Ecuador, Peru and Bo-livia based on temperature data and obtained values ranging from 765 and 1374 mm a− 1, significantly more than what is lost through sub-limation from glacierized surfaces.
A reduction of glacier cover will therefore reduce streamflow, be-cause of increased evapotranspiration from newly ice-free areas (Frans et al., 2015). However, this effect tends to reduce quickly with
catch-ment size and distance from the glacier terminus. In contrast the impact of glaciers on water availability through their seasonal buffering ca-pacity of streamflow tends to be much larger and persist much further
downstream (e.g. Mark and Seltzer, 2003; Juen et al., 2007). The
magnitude of this effect is determined by the interaction between sea-sonal variations in precipitation and ablation. As a result, glaciers may provide a large relative contribution to dry seasonflow in regions with strong seasonality in precipitation (Mark and McKenzie, 2007; Soruco et al., 2015).
Accelerated glacier melt may further increase a glacier's
contribu-tion to river flow because of the glacier's negative mass balance
(LaFreniere and Mark, 2014). But this effect is temporary and will de-cline with decreasing glacier size (Pouyaud et al., 2005). Eventually, streamflow seasonality will increase because of the reduced buffering capacity of the glacier. This effect, known as ‘peak water’ (Jansson et al., 2003) has been described byBaraer et al. (2012) for the Cor-dillera Blanca, Peru, where they suggested that glacial retreat initially leads to a water surplus in glacier-fed streams, but once a critical
transition point is reached, dry season meltwater contribution will de-cline and eventually stabilize at a level that is 30% below the initial level (see alsoPouyaud et al., 2005; Chevallier et al., 2011).
However, the impact on river discharge is scale-dependent and declines with downstream distance from the glacier. For instance,
Soruco et al. (2015)did not detect a significant change in river
dis-charge (−0.6% in water production) from the glaciers in the Cordillera Real contributing to water supply of the city of La Paz, neither at annual nor seasonal time scales, despite a loss of approximately 43% of the glacierized area between 1963 and 2006. It is assumed that the in-creased melt rates essentially compensated the reduction in the surface area of the glaciers. Going forward, however, based on estimates by
Soruco et al. (2015), the complete disappearance of these glaciers will lead to reduction in runoff of 12% annually, but 24% during the dry season. Note that the glacier discharge produced during the dry season (4.3 × 10⁶m3a− 1) accounts for half of the water produced during the
wet season (8.4 × 10⁶m3a− 1) (Soruco et al., 2015). Uncertainties regarding future changes in precipitation, however, imply that sub-stantial error bars belie these estimates.
In another study on Zongo glacier, Frans et al. (2015)applied a
distributed glacio-hydrologic model to study the response of river dis-charge to future glacier retreat, with a simplified dynamic model using the shallow ice approximation approach. Their climate forcing data were obtained by downscaling reanalysis and CMIP5 model data using a stochastic weather generator. Their results indicate a decrease in annual and dry season discharge of 25 and 57% respectively by the end of the 21st century, resulting from a loss of 81% of the glacier volume (in scenario RCP4.5, when compared to reference year 1987), which would render future glacier melt contribution negligible. This reduction is significantly more than the volume loss of only 69% in the higher emission scenario RCP6.0 found byRéveillet et al. (2015), highlighting the uncertainty in future projections of glacier loss associated with different methodologies, input parameters and assumptions concerning the different climate scenarios.
A more in-depth discussion and critical review of the various ap-proaches linking climate with glacier and runoff modeling at various spatial and temporal scales in the Andes can be found inFernandez and Mark (2016). A particularly noteworthy point raised in their review is the suggestion to perform glacio-hydrologic intercomparison studies at specific sites with good data coverage. Employing different modeling approaches (e.g. empirical temperature-index vs. physically-based en-ergy balance models) over the same sites with the same data sets (to the extent that different approaches require the same input data) would allow for a much more detailed assessment of results and their specific model-dependence. Such experiments could potentially be integrated into the existing Glacier Modeling Intercomparison Project (GlacierMIP;
http://www.climate-cryosphere.org/activities/targeted/glaciermip). The Zongo glacier in Bolivia or Antisana 15a glacier in Ecuador, which are among the best-equipped and monitored glaciers in the tropical Andes, would provide suitable targets for such an intercomparison study.
3.4. Socio-economic (water demand side) projections
While a considerable body of literature with focus on the water supply side (i.e. glacier retreat and its impact on meltwater availability downstream) has emerged over the past decade, there is an increasing realization that the water demand side may be an equally, if not more, important aspect of this equation (Bury et al., 2011; Drenkhan et al., 2015; Rasmussen, 2016; Carey et al., 2017).Buytaert and de Bievre (2012)for example analyzed future water supply and demand for four large cities in the Andes (Bogota, Quito, Lima, La Paz), of which one (La Paz) receives a significant water supply contribution from glacier melt, under a range of future scenarios. Their results suggest that future in-creases in water demand induced by demographic changes (population growth) will likely outpace any changes in water supply due to climate
change, regardless of uncertainties in future growth scenarios. Hence they argue that population growth rather than a decline in water supply per se is the major driver of future water scarcity. They conclude that a stronger research and adaptation focus should be placed on the demand side, quantifying and regulating future water demand through adequate adaptation strategies, including water conservation, modern infra-structure to reduce water losses and policy instruments.
Indeed the increasing population, export-driven agricultural ex-pansion, growth in water-intensive industries such as mining (Bebbington and Williams, 2008; Bebbington and Bury, 2009) and
rising demand for electricity from hydropower plants (Finer and
Jenkins, 2012) already cause water shortages (e.g.,Boelens, 2014) in Peru, Bolivia, and Ecuador. As a result, trends in increasing water de-mand will continue and water shortages aggravate, regardless of the rate at which glaciers will retreat over the coming decades. To antici-pate these issues and identify hotspots of water shortage and potential conflict, it is essential to understand the spatiotemporal patterns of water demand and how they interact with a changing supply. Within this context, political constellations as well as economic and market-driven aspects will largely determine priorities for water allocation (Drenkhan et al., 2015). Water rights are distributed based on historical practices and trends, but also based on political conditions, economic agendas, institutional capacity, laws and legal structures, and cultural values. In the more rural areas of Peru and Bolivia in particular, access to adequate water systems and sanitation facilities for local populations is still insufficient. Hence improving this infrastructure is projected to further increase water demand close to glacierized headwaters (Carey et al., 2014). The same is true for agriculture that is reliant on irriga-tion. Large irrigation projects for export-oriented agriculture along the Peruvian coastal deserts (Chavimochic and Chinecas, for example) have led to a rapidly increasing water demand from the Rio Santa that drains the Cordillera Blanca (Bury et al., 2013; Carey et al., 2014; Drenkhan et al., 2015). In Peru subsistence farming based on crops such as alfalfa, barely or potatoes is increasingly being replaced by export crops (as-paragus, rice, avocado) grown in these large coastal desert irrigation projects. But even in the more rural areas water demand for irrigation
may increase. As pointed out byHole et al. (2011) the rising
tem-peratures may lead to an upward extension of the arable land, poten-tially further increasing the demand for water to be used in irrigation. In summary, multiple drivers affect current state and future trajectories of water demand. Clearly a much better characterization of current and future water demand will be necessary to complement glacio-hydro-logic modeling of the supply side. Inevitably this will need to consider the socioeconomic, legal, political, ethical and cultural drivers that shape water demand in a watershed.
4. New frontiers in Andean glacier and climate research
While a lot of progress has been made in our understanding of tropical Andean glacier response to climate change in general, the sensitivity of glacier energy and mass balance to a number of specific natural and anthropogenic forcing terms is still poorly documented. Below we discuss some of these aspects in more detail and offer a few thoughts on why we believe these issues deserve special attention from the scientific community in the future.
4.1. Revising in-situ mass balance estimates
Most surface mass balance estimates in the tropical Andes are based on the glaciological method where routine measurements of ablation and accumulation are carried out based on a stake network. While measurements in the ablation zone are made once a month, measure-ments in the accumulation zone are logistically much more difficult and challenging and commonly only carried out once or twice a year. Obtaining reliable measurements in the zone that is representative of the entire upper reaches of glaciers is very challenging, given
inaccessibility of certain areas with steep seracs and hidden crevasses, and the difficulty in determining a clear base of the annual accumula-tion layer, especially in the inner tropics, which lacks a clear dry season. The spatial extrapolation of such point measurements over the entire accumulation zone further enhances the uncertainties in the glacier-wide mass balance, especially since the accumulation area tends to be larger than the ablation zone. On one of the most intensely surveyed glaciers, Antizana 15a, in the Andes of Ecuador, for example, 60% of the surface area is not covered by direct surface measurements. It may therefore not come as a big surprise that a reassessment of the mass balance of glacier Antizana 15a over the period 1995–2012 with geo-detic measurements (mass change computed from digital elevation model differencing), suggests that the mass balance in the accumulation
zone may have been significantly underestimated in previous studies
(e.g. Francou et al., 2004). Based on the geodetic mass balance
ap-proachBasantes-Serrano et al. (2016)demonstrated that the
accumu-lation totals above the ELA are approximately 70% higher than pre-viously estimated with the glaciological method, resulting in a much reduced, less negative, overall mass balance of glacier Antizana 15a during the past two decades. To what extent these results simply reflect the particular precipitation characteristics of Antizana glacier, with a very steep vertical precipitation gradient, or whether they hint at a larger problem of accumulation measurements throughout the tropical Andes, remains an unanswered question.
An additional uncertainty regarding the representativeness of the Andean glacier network stems from the initial choice of glaciers that form part of this network. Because of the logistical challenges discussed above, the network established for long-term monitoring tends to be biased toward smaller glaciers, located at lower elevations, that are easier to access and safer to work on. It is well understood that such
glaciers may be more prone to rapid glacier retreat and the first to
completely disappear (e.g.Ramirez et al., 2001; Francou et al., 2003). Hence questions have been raised about the representativeness of the
selected glacier network as portrayed in Vuille et al. (2008a) and
Rabatel et al. (2013), although as stated above, the majority of glaciers in the tropical Andes fall into this low-elevation category and the two longest existing mass balance time series are actually from large gla-ciers, Antizana and Zongo.
To better assess the representativeness of the monitored glaciers, regional studies need to be promoted, where mass balance changes at the decadal scale are computed for entire mountain ranges. This can be achieved by deriving digital elevation models (DEM) from satellite data such as SRTM, ASTER or SPOT (e.g.Gardelle et al., 2013; Berthier et al., 2016), or aerial photographs. Recent sub-metric resolution satellite
images (e.g., Pléiades) are also very promising (Cusicanqui et al.,
2015), although their acquisition cost remains an obstacle to regional studies. Combining the geodetic method with snowline measurements derived from satellite images during the dry season would allow quantifying annual mass balance data for tens or hundreds of glaciers. However, algorithms still need to be improved to automatize the pro-cessing of satellite images (Rabatel et al., 2016).
4.2. Glacier thickness estimates
One bottleneck for a better quantification of glacier changes and their contribution to hydrological functioning of high-altitude water-sheds is the difficulty in quantifying glacier volume and thickness dis-tribution. As discussed inSections 3.2 and 3.3, the only future glacier change projections including ice dynamics performed in the tropical Andes were done on the highly monitored Zongo glacier, Bolivia (Réveillet et al., 2015; Frans et al., 2015) where ice thickness was measured in-situ. However, even though more in-situ measurements on individual glaciers are needed, it is impossible to directly measure ice thickness on all the individual glaciers, given the cost, logistics, ac-cessibility, etc. Therefore, modeling of glacier thickness is indis-pensable. Several modeling approaches are currently being tested
within the Ice Thickness Models Intercomparison eXperiment (ITMIX,
http://cryosphericsciences.org/wg_glacierIceThickEst.html). The e ffi-ciency of the models largely depends on the required input data
(sur-face DEM, glacier outline, sur(sur-face mass balance, sur(sur-face flow
velo-cities). Preliminary results from this intercomparison initiative (Farinotti et al., 2017) show that the availability of accurate DEMs, surface velocityfields and mass balance data allows improving the ice thickness distribution estimates. In this context, the new generation of sub-metric resolution satellite images (e.g. Pléiades, WorldView) or satellites with high temporal acquisition frequency (e.g., Sentinel-2 with a 5-day revisiting period) open new avenues for obtaining useful input data to accurately estimate glacier thickness.
4.3. Role of clouds and regional circulation changes
On low-latitude glaciers, the main seasonal changes in mass and energy balance are driven by humidity-related variables, and ablation and accumulation processes are closely linked. Seasonal and inter-annual variations in the mass balance therefore depend on cloud and precipitation properties, with net radiation being the main driver of the glacier surface energy balance (Sicart et al., 2005). Shortwave incoming radiation is particularly important during the transition from dry to wet season (October–November in the central-southern tropical Andes), when cloud cover is still low, yet the long dry season has accumulated significant amounts of dust and aerosols at the surface, which together with snow metamorphism and ice exposed due to the increasing snow line results in very low albedo values (and hence high rates of ab-sorption of solar radiation (e.g.Wagnon et al., 2001; Gurgiser et al., 2013). Once the wet season has started and glaciers are blanketed with fresh snow and clouds reduce incoming solar radiation, this effect subsides, and melt rates are somewhat reduced. Still, significant melt rates tend to persist for most of the wet season, driven mainly by high longwave radiation emitted by convective clouds (Sicart et al., 2010, 2011). Hence snowfall (albedo effects) and clouds (radiative properties) are key drivers of the surface energy balance of tropical glaciers as their characteristics (convective vs. stratiform; low vs. high clouds, etc.) change with seasonal changes in atmospheric circulation (Sicart et al.,
2016). Changing cloud properties modulate longwave radiation, but
also lead to seasonal changes in the amount of incoming shortwave radiation. How cloud radiative forcing in the tropical Andes might change under future climate change scenarios is highly uncertain, yet of paramount importance to understand future changes in tropical
gla-ciers' energy balance. Afirst step in addressing this lack of
under-standing was taken bySicart et al. (2016), who were able to link cloud
properties and their impact on the incoming surface energyflux over
tropical glaciers to changes in the atmospheric circulation on seasonal timescales. Given that climate models are better suited to simulate changes in the large-scale circulation, this might open new avenues to statistically infer related changes in cloud properties over the Andes, without having to directly rely on error-prone cloud data from the models themselves.
4.4. Role of aerosols (black carbon) and albedo feedback
Given the importance of albedo changes for surface energy balance during the transition from dry to wet season, when cloud cover is still low, yet solar radiation is high, deposition of solid particles such as dust, black carbon and other aerosols from air pollution, including biomass burning and fossil fuel combustion, on glaciers is of high re-levance. Black carbon in particular is a major concern, given that its efficacy to contribute to snow and ice melt once deposited on a glacier is significantly higher than its radiative forcing would imply (Flanner et al., 2007). Yet this topic has received surprisingly little attention in the Andean region (e.g.Sicart and Arnaud, 2007; Schmitt et al., 2015), unlike for example the Himalaya, where a significant amount of lit-erature on this topic exists (e.g.Ramanathan and Carmichael, 2008; Xu
et al., 2009; Menon et al., 2010; Kaspari et al., 2011; Qiu, 2013; Ginot et al., 2014). Biomass burning in the Amazon basin, upwind of the tropical Andes, is likely a major source of black carbon deposition in the Andes (Pereira et al., 2011), but emission statistics and inventories over the region, as well as adequate emission, transport and deposition
models are largely lacking (Molina et al., 2015). Developing such
models is particularly challenging in this region, given the paucity of observational data and the complex topography leading to highly un-certain transport and mixing processes (Molina et al., 2015). Initial results obtained in the Cordillera Blanca bySchmitt et al. (2015)seem to suggest that deposition levels of black carbon are higher on glaciers that are located closer to population centers, when compared to glaciers that are in more remote locations, indicating that local sources of pol-lutants may outweigh long-distance transport. This result however, has yet to be confirmed at other sites in the Andes. Such local sources for black carbon can include diesel-powered vehicles, residential use of wood, waste, etc. for heating and cooking, as well as local grassland fires, both anthropogenic or natural (Roman-Cuesta et al., 2014). De-position of ash from volcanic eruptions is also locally important (Schotterer et al., 2003), even though it is not a result of climate change and the forcing is time-limited, as the volcanic aerosol concentration drops rather quickly once the eruptions ends. Some studies have also used ice cores to analyze historical air pollution levels dating back to pre-Incan times (e.g.Eichler et al., 2015; Uglietti et al., 2015), but they focused mostly on trace elements such as Pb, that are emitted from metallurgic activities. Given the paucity of data on this topic, its re-levance for glacier energy balance in the Andes is somewhat uncertain. Yet the lessons learned from similar studies in the Himalaya indicate that further research to obtain better data on this topic is warranted. For example only one high-elevation Global Atmospheric Watch (GAW) site measuring atmospheric air pollution exists in all of the tropical Andes, located at the Chacaltaya Observatory in the Cordillera Real, Bolivia (Molina et al., 2015). This network should be extended to in-clude a similar station in the northern humid tropical Andes. This is all the more important as several mid- to large-sized cities exist in the tropical Andes (La Paz, Cuzco, Quito, Bogota), all emitting significant quantities of air pollutants, including black carbon, that could reach nearby glacierized mountain ranges.
4.5. Role of groundwater
One of the major uncertainties related to water storage terms in the tropical Andes relates to groundwater. Very little is still known about how aquifers in the region are recharged and to what extent they could contribute to maintaining a crucial baseflow in rivers during the dry
season. Baraer et al. (2015)and Gordon et al. (2015)analyzed the
contribution of groundwater to river discharge in several glacierized catchments of the Cordillera Blanca, Peru.Baraer et al. (2015)applied a hydrochemical mixing model, including major ions and stable isotopes to determine the extent to which glacier runoff during the dry season may be complemented by a contribution from the underlying aquifer. In all four valleys they surveyed, the groundwater contribution to runoff was above 24% during the dry season, suggesting that groundwater provides a substantial contribution to river discharge from these gla-cierized catchments. Another study in a proglacial catchment of the Cordillera Blanca bySomers et al. (2016)confirms these results. Their
study indicates that river discharge during the dry season experiences a net gain of almost 30% from the underlying aquifer. BothGordon et al. (2015)andSomers et al. (2016)stress, however, that groundwater itself is at least partially recharged through glacier meltwater. Hence it re-mains an unresolved question to what extent the hydrology of the un-derlying aquifer itself will be affected by continued glacier retreat and eventual complete disappearance. An additional challenge stems from the difficulty in correctly describing the regional extent of the different aquifers, given the heterogeneous lithology and complex geology characterizing the upper reaches in many of the glacierized catchments.
Some aquifers may be fractured, as is the case for example in the An-tizana catchment in Ecuador (Favier et al., 2008) or consist of porous
media, as is the case in the Quilcayunca catchment in Peru (Baraer
et al., 2015).
5. Impacts on socio-economic, environmental and cultural systems
5.1. Water use
Water is used for a variety of industrial purposes in the tropical Andes, but the two main industrial sectors that rely on a steady supply of water are hydropower production (see illustrative example inFig. 5) and mining. Hydropower constitutes a major component of the power mix in many Andean countries (Vergara et al., 2007). In Peru, for ex-ample, it accounts for 54% of the energy production (Drenkhan et al., 2015). With the energy demand in Peru currently increasing at a rate of 5.4% per year (Drenkhan et al., 2015), this capacity is projected to grow rapidly (Finer and Jenkins, 2012). Yet glacier retreat might at least in some regions, such as the Cordillera Blanca, Peru, have a negative impact on hydropower production, because of the likely decrease in river discharge during the dry season (Mark et al., 2010; Chevallier et al., 2011; Baraer et al., 2012; Condom et al., 2012;). Because glacier
runoff variability varies across each basin, and because glacier
shrinkage for larger glaciers will generate increased runoff rather than an immediate reduction in discharge, which may be the case for smaller glaciers or particular basins, it is difficult to draw decisive conclusions
about how, when, and where glacier retreat will affect hydropower
generation (Carey et al., 2017). In some cases, glacier shrinkage will increase runoff for decades into the future, while in other locations discharge reduction may already be underway, thereby having negative water use impacts. When glacier runoff declines, it will often be ne-cessary to construct additional storage to maintain the same level of power production. In the past, reservoir building has led to opposition and resistance from local residents (e.g.Carey et al., 2012a; Rasmussen,
2016). While water use for hydropower production is not in itself a
consumptive use in the sense that it would lower the overall availability of water (except for some evaporative loss in reservoirs), it requires strongflow regulation. This may either be beneficial or detrimental to other water uses, depending on the scope for multi-objective
optimization of reservoir operations. Yet, many existing reservoirs in the tropical Andes, including the Cañon del Pato hydropower dam on the Santa River, are already operated as multi-purpose reservoirs. Furthermore, hydropower installations may be faced with increased sediment influx as glacier retreat will increasingly expose bare slopes and lead to increased erosion and discharge of suspended sediments (Finer and Jenkins, 2012; Godon et al., 2013). They also threaten ecological connectivity between high and lowland river species along river systems and pose barriers for migrating species, in particular on the eastern slopes of the Andes, where over 150 new dams were in a
planning phase in different Andean countries in 2011 (Finer and
Jenkins, 2012).
Mining is a major economic sector in many Andean nations and also has a very large water footprint as water is used for leaching,flotation and concentration processes of ore. According toCarey et al. (2014), producing one ounce of gold in the Rio Santa valley, Peru, in 2008
required approximately 25 m3of water.Bebbington and Bury (2009)
report that mining claims in Peru have increased exponentially, with mining concessions in 2008 covering 11% of the entire surface area of the country. Many of them are located in watersheds that are already under significant water pressure, supplying drinking water to large coastal cities, such as Lima. However, most water use in mining is non-consumptive and therefore returned to the river. As a result, mining impacts on downstream water availability tends to be limited, but it may exacerbate local water stress or reinforce the impact of glacier melt. Additionally, the potential impact on contaminants and sediment load can be significant, with glacier loss opening up new high-elevation and fragile lands to mining that release cyanide and other contaminants
into downstream water supplies (Buytaert and Breuer, 2013; Bury,
2015). Quantitative analysis of daily rainfall and discharge variability in the Tablachaca River (3132 km2) and the Santa River (6815 km2)
watersheds by Morera et al. (2013) for example, shows that mining
activity leads to much higher specific suspended-sediment yield (2204 t km− 2yr− 1) in the Tablachaca River, despite a very similar hydrocli-matic setting. Maybe most important, however, is the impact on water quality as ore mining often leads to acid mine drainage leaching heavy metals and other pollutants into nearby rivers. Historically pollution from mining has been a major problem for water quality, as acid mine drainage from mine wastewater, including contaminants such as As, Pb and Cd has repeatedly leaked into streams and rivers (Bebbington and
Fig. 5. Examples of human activities and environ-mental services that may be affected by glacier retreat.
Top left: Hydropower production - Laguna
Sibinacocha in the Cordillera Vilcanota, Peru. The dammed lake reservoir is fed by glacial meltwater and serves electricity production (photo: C. Huggel). Top right: Glacial hazards - An early warning system on Laguna 513, Cordillera Blanca, Peru, a glacier lake that formed as glaciers receded during the past dec-ades. The warning system includes geophones and cameras transmitting pictures of dam and mountain-side in real time (photo: C. González). Bottom left: Alpine tourism - Women on Mt. Illimani, Cordillera Real, Bolivia, serving as porters for alpine climbing expedition (photo M. Vuille). Bottom right: Andean wetlands - Lamas and Alpacas grazing in wetland maintained by glacier meltwater downstream of Quelccaya ice cap, Cordillera Vilcanota, Peru (photo M. Vuille).