HAL Id: hal-01197610
https://hal.archives-ouvertes.fr/hal-01197610
Submitted on 6 Jun 2020HAL is a multi-disciplinary open access archive for the deposit and dissemination of sci-entific research documents, whether they are pub-lished or not. The documents may come from teaching and research institutions in France or abroad, or from public or private research centers.
L’archive ouverte pluridisciplinaire HAL, est destinée au dépôt et à la diffusion de documents scientifiques de niveau recherche, publiés ou non, émanant des établissements d’enseignement et de recherche français ou étrangers, des laboratoires publics ou privés.
Stock assessment and recovery potential assessment for
quillback rockfish (Sebastes maliger) on the pacific coast
of canada
Marie-Pierre Etienne
To cite this version:
Marie-Pierre Etienne. Stock assessment and recovery potential assessment for quillback rockfish (Se-bastes maliger) on the pacific coast of canada. [Technical Report] 2011/072, Canadian Science Advi-sory Secretariat. 2012, 16 p. �hal-01197610�
Pacific Region Science Advisory Report 2011/072
May 2012
STOCK ASSESSMENT AND RECOVERY POTENTIAL
ASSESSMENT FOR QUILLBACK ROCKFISH (SEBASTES
MALIGER) ALONG THE PACIFIC COAST OF CANADA
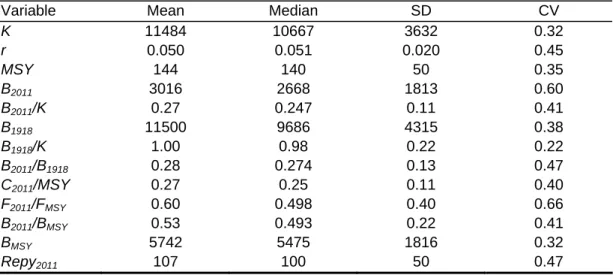
125°W 130°W 135°W 54 °N 52° N 50 °N 48 °N Outside Management Unit Inside Management Unit British Columbia Washington USA Alaska, USA
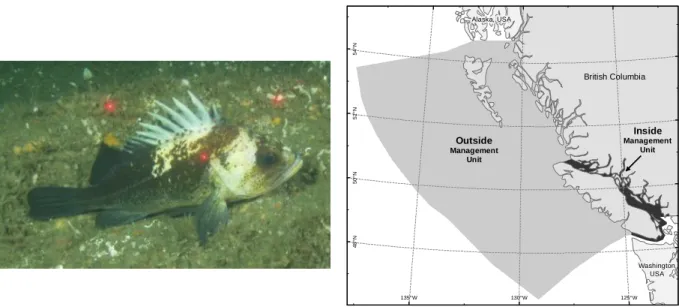
Figure 1: Quillback Rockfish (Sebastes maliger). Credit: K. Lynne Yamanaka.
Figure 2: Map of the two management units; inside (East of Vancouver Island) and outside (remainder of the coast) for Quillback Rockfish in British Columbia.
Context
In 2009, Quillback Rockfish along the Pacific coast of Canada was designated as Threatened by the Committee on the Status of Endangered Wildlife in Canada (COSEWIC), with fishing identified as the primary threat to the population. This document provides summary information from a coastwide stock assessment and recovery potential assessment of Quillback Rockfish intended to support the
development of listing recommendations and subsequent recovery actions. Although COSEWIC recognizes only one coastwide designatable unit for Quillback Rockfish, this assessment is divided into two management units: inside and outside.
This Science Advisory Report has resulted from a Fisheries and Oceans Canada, Canadian Science Advisory Secretariat, Pacific Regional Advisory Process meeting held on May 31, 2011, on Stock Assessment and Recovery Potential Assessment for Quillback Rockfish (Sebastes maliger) Along the Pacific Coast of Canada. Additional publications from this process will be posted as they become available on the DFO Science Advisory Schedule at http://www.dfo-mpo.gc.ca/csas-sccs/index-eng.htm.
SUMMARY
In November 2009, Quillback Rockfish in British Columbia (B.C.) were designated as
Threatened by the Committee on the Status of Endangered Wildlife in Canada (COSEWIC). COSEWIC recognizes one coastwide Quillback Rockfish designatable unit. For this
assessment, Quillback Rockfish are divided into two management units; inside (East of Vancouver Island) and outside (remainder of the coast).
This document provides a summary of the stock status and projections as a requirement of the recovery potential assessment for Quillback Rockfish in B.C. Status and projections are presented relative to reference points consistent with DFO’s decision making framework policy which incorporates the Precautionary Approach.
Quillback Rockfish range from the Gulf of Alaska to Southern California and are common throughout B.C. marine waters. They have been caught in commercial fisheries from
approximately 14 to 143 metres in depth over rock habitats. Estimates of habitat area in B.C. for this species ranges from 27,000 to 56,000 square kilometres.
Stock status is assessed using a Bayesian state space surplus production (BSP) model where fishing is the only source of mortality for the stock. Future stock outcomes from a reference case BSP model are used to assess the recovery potential of the Quillback Rockfish stock under various fixed total fishery mortality harvest policies.
In 2011, median biomass (B2011) for the outside management unit is 6,480 tonnes (coefficient
of variation [CV] 1.21) and for the inside management unit is 2,668 tonnes (CV 0.60). The median Biomass (B) at Maximum Sustainable Yield (MSY) or Bmsy is 9,307 tonnes (CV
0.60) for the outside management unit and 5,475 tonnes (CV 0.32) for the inside management unit.
Median B2011/Bmsy for the outside management unit is 0.736 (CV 0.57) and for the inside
management unit is 0.493 (CV 0.41).
The median biomass in 2011 is 37.7% (CV 0.65) of the biomass in 1918 (B1918) for the
outside management unit and 27.4% (CV 0.47) for the inside management unit.
Generation times for the outside and inside management units for Quillback Rockfish are estimated at 32.0 and 28.5 years, respectively.
For the outside management unit, given the reference case, a 95% probability of the
population >0.4 Bmsy is expected to be achieved in 15 years at a fixed total fishery mortality of
about 30 tonnes, and in 90 years at a fixed total fishery mortality of about 90 t. For the inside management unit, given the reference case, a 95% probability of the
population >0.4 Bmsy is expected to be achieved in 90 years at a fixed total fishery mortality of
approximately 25 tonnes.
Given the reference case, a 95% probability of the population >0.8 Bmsy is expected to be
achieved for the outside management unit in 90 years at a fixed total fishery mortality of about 60 tonnes, and for the inside management unit this is not expected to be achieved in 90 years with a harvest.
In 2010, for the outside management unit, the total mortality from all fisheries is 158.6 tonnes, of which 116.5 t was taken by the commercial groundfish fishery, 41.8 t by the recreational fishery, and 0.3 t by the salmon troll fishery. For the inside management unit, the total mortality from all fisheries is 33.9 tonnes, of which 24.8 t was taken by the
commercial groundfish fishery, 9.0 t by the recreational fishery, and 0.1 t by the salmon troll fishery.
Management of a species specific Total Allowable Catch (TAC) for Quillback Rockfish in commercial and recreational fisheries may be considered and would mitigate the possibility of over harvesting this species within the current species aggregate quotas.
In addition to the Rockfish Conservation Strategy mitigation measures already implemented, additional reductions to fishery harvests may be considered.
BACKGROUND
Rationale for Assessment
Quillback Rockfish (Sebastes maliger) was designated as Threatened in November 2009 by the Committee on the Status of Endangered Wildlife in Canada (COSEWIC) (Figure 1). The
reasons given for the designation are the inherent low productivity of the species with longevity to 95 years, late maturation (50% at 11 years of age), slow growth, and episodic recruitment that is dependent on oceans conditions, accessibility and vulnerability to fisheries and the 50 to 75% decline in some survey indices since the mid-1980’s.
(http://www.sararegistry.gc.ca/species/speciesDetails_e.cfm?sid=1062).
This document provides a summary of the stock status and stock projections as a requirement of the recovery potential assessment for Quillback Rockfish in B.C. Status and projections are presented relative to reference points consistent with DFO’s decision making framework policy which incorporates the Precautionary Approach.
Species Biology and Habitat
Quillback Rockfish range from Kodiak Island in the Gulf of Alaska to Anacapa Passage in Southern California and are common from Southeast Alaska to Northern California (Mecklenburg et al. 2002, Love and Lea 1997, Love et al. 2002). Quillback rockfish are a common species coastwide in British Columbia, occupying depths between 14 m and 142 m (97.5 percentiles of fisheries catches) over rock habitat.
Quillback Rockfish are associated with rocky marine habitats throughout their distribution and depth range. In B.C., they are observed hovering near to or settled upon high relief rock ridges, reefs, cobbles and broken rock, and occupying crevices, cloud sponges and crinoid
aggregations (Richards 1986, Matthews 1990, Murie et al. 1994, Yamanaka et al. 2011). Quillback Rockfish do not have any known dwelling-place similar to a den or nest during any part of their life-cycle. Therefore, the concept of a residence does not apply for this marine fish. Estimates of habitat area for this species range from 27,000 to 56,000 square kilometres in B.C. (Yamanaka et al. 2006).
ASSESSMENT
Stock Assessment
Stock Monitoring
Stock status is assessed using a Bayesian state space surplus production (BSP) model
(McAllister and Babcock 2006). Fishing is the primary source of mortality identified for Quillback Rockfish in the COSEWIC status report (2009). No other potential source of mortality is
used to assess the recovery potential of the Quillback Rockfish stock under various fixed total fishery mortality harvest policies.
The model requires a time series of annual catch biomass from each of the fisheries and at least one abundance index, Catch Per Unit of Effort (CPUE) with coefficients of variation (CV). Estimated parameters include carrying capacity (K), the intrinsic rate of population growth (r), the biomass in the first modeled year defined as a ratio of K (po), variance parameters for each
CPUE series, and catchability (q) for each CPUE series. Prior probability distributions (priors) are specified for all of the estimated parameters for this Bayesian estimation.
Output statistics computed from the BSP model are marginal posterior distributions for all model parameters (described above) and management quantities below;
MSY – maximum sustainable yield Bcur – biomass in the current year
Bcur/K – ratio of current biomass to carrying capacity
Binit – biomass at the start of the model
Binit/K – ratio of biomass at the start of the model to carrying capacity
Bcur/Binit – ratio of current biomass to biomass at the start of the model
Ccur/MSY – ratio of current catch to maximum sustainable yield
Fcur/Fmsy – ratio of current fishing mortality to that at maximum sustainable yield
Bcur/Bmsy – ratio of current biomass to biomass at maximum sustainable yield
Ccur/Repy – ratio of current catch to replacement yield
Bmsy – biomass at maximum sustainable yield
Repy – replacement yield
Catch/Repy – ratio of catch to replacement yield
P(Bcur > 0.4 Bmsy) – probability that the current biomass is greater than the Limit Reference
Point (LRP – see Fisheries Reference Points below)
P(Bcur > 0.8 Bmsy) – probability that the current biomass is greater than the Upper Stock
Reference (USR – see Fisheries Reference Points below)
Fisheries Reference Points
Fisheries reference points consistent with DFO’s decision making framework that incorporates the Precautionary Approach are presented in this assessment (DFO 2006). Surplus production models commonly define BMSY at 0.5 B0, or half of the unfished biomass. For the BSP
assessment model, B0 is defined as the carrying capacity parameter, K. A reference case BSP
model which uses the most appropriate inputs will be used as a basis for management together with the following reference points:
Limit Reference Point (LRP) = 0.4 BMSY = 0.2 K= 0.2 B0
Upper Stock Reference (USR) = 0.8 BMSY = 0.4 K= 0.4 B0
Target Reference Point (TRP) = B MSY = 0.5 K = 0.5 B0
Stock Structure
One B.C. coastwide designatable unit for Quillback Rockfish is recognized by COSEWIC, but for this assessment, the coastwide designatable unit is divided into two management units; inside (East of Vancouver Island) and outside (remainder of the coast) (Figure 2). Fishery management for these two units has been separate and unique since the inception of the directed commercial fishery for hook and line rockfish in 1986.
Catch History
Quillback Rockfish are caught in all groundfish commercial fisheries (trawl, halibut, sablefish, dogfish, lingcod and rockfish), Pacific Salmon troll fisheries, recreational hook and line fisheries,
as well as Spot Prawn trap and Shrimp trawl fisheries. The catch of Quillback Rockfish is assembled using available data for commercial and recreational fisheries from 1918 to 2010. Aboriginal catch and Shrimp trawl catch were not compiled for this assessment, but are assumed to be small and accounted for within the model sensitivity tests for uncertainty in all catches. Catch represents all mortality from fisheries including landed, discarded and unreported catches.
Life-History Parameters
In the Bayesian surplus production stock assessment model used for Quillback Rockfish, life history parameters are represented through a single growth parameter, “r”, which represents the intrinsic rate of population growth and is estimated using i) von Bertalanffy growth parameters and maturity schedules derived from biological data collected during research surveys, ii) natural mortality rates estimated from maximum ages and iii) an estimated stock-recruit steepness parameter.
Trends in Abundance
All available sources for Quillback Rockfish trend data were reviewed for their use in the stock assessment. All longline fishing and submersible surveys are used in the assessment where possible. Most jig fishing surveys are used, with the exception of surveys where fishing
methods or geographic coverage changed between surveys. Almost all the trawl gear surveys were included in the assessment, with the exception of the West Coast Haida Gwaii and shrimp trawl surveys due to very low to nil sampling rates. Commercial catch records were not
included, as trend data for the stock assessment due to low sampling rates (trawl fisheries) and the influences of fisher behaviour in response to management or market demands (hook and line).
Reference Case
The reference case BSP model runs utilize the best available data inputs from the most scientifically defensible sources and the output provides the basis for formulating advice to managers. The following list summarizes the key model settings for the reference case:
Prior mean r formulated for each management unit using the Beverton-Holt steepness
prior distribution and life history parameter estimates for each management unit All stock trend indices used for each management unit
Schaefer surplus production function (BMSY/K=0.5)
Prior mean B1918/ K = 1 for outside and 0.9 for inside waters
Uninformative priors for q
Lag 1 autocorrelation with the autocorrelation coefficient, , set at 0.5 starts in 2011 CVs for stock trend indices obtained by iterative reweighting, determined by fitting the
BSP model to the data
Sensitivity tests were also conducted to evaluate the effect of stock assessment model assumptions on stock status and projection results.
Stock Status
Present status for the Quillback Rockfish is determined through the Reference Case BSP model runs shown in Table 1 for the outside management unit and Table 2 for the inside management unit, Figure 3 shows stock status relative to DFO’s Precautionary Approach and Fisheries Reference Points.
In 2011, median biomass (B2011) for the outside management unit is 6,480 tonnes (CV 1.21) and
for the inside management unit is 2,668 tonnes (CV 0.60). The median biomass at MSY (Bmsy) is
9,307 tonnes (CV 0.60) for the outside management unit and 5,475 tonnes (CV 0.32) for the inside management unit. The median replacement yield in 2011 (Repy2011) is 241 tonnes (CV
unit. Median B2011/Bmsy for the outside management unit is 0.736 (CV 0.57) and for the inside
management unit is 0.493 (CV 0.41).
Table 1. Posterior mean, median, standard deviation (SD), and coefficient of variation (CV) for
parameters and stock status indicators for B.C. Quillback Rockfish – outside management unit. Posterior medians for C2011/MSY, C2011/Repy2011, and B1918/K were calculated using a lognormal approximation
based on the posterior mean and SD. All other posterior medians were obtained directly from a resample from the importance draws.
Variable Mean Median SD CV
K 23437 18614 14145 0.60 r 0.080 0.069 0.05 0.59 MSY 462 321 539 1.17 B2011 12148 6480 14690 1.21 B2011/K 0.43 0.368 0.25 0.57 B1918 25122 18766 14991 0.60 B1918/K 1.09 1.06 0.24 0.22 B2011/B1918 0.42 0.377 0.28 0.65 C2011/MSY 0.53 0.470 0.30 0.55 F2011/FMSY 1.00 0.779 0.91 0.91 B2011/BMSY 0.86 0.736 0.49 0.57 BMSY 11718 9307 7073 0.60 Repy2011 293 241 229 0.78
Table 2. Posterior mean, median, standard deviation (SD), and coefficient of variation (CV) for
parameters and stock status indicators for B.C. Quillback Rockfish – inside management unit. Posterior medians for C2011/MSY, C2011/Repy2011, and B1918/K were calculated using a lognormal approximation
based on the posterior mean and SD. All other posterior medians were obtained directly from a resample from the importance draws.
Variable Mean Median SD CV
K 11484 10667 3632 0.32 r 0.050 0.051 0.020 0.45 MSY 144 140 50 0.35 B2011 3016 2668 1813 0.60 B2011/K 0.27 0.247 0.11 0.41 B1918 11500 9686 4315 0.38 B1918/K 1.00 0.98 0.22 0.22 B2011/B1918 0.28 0.274 0.13 0.47 C2011/MSY 0.27 0.25 0.11 0.40 F2011/FMSY 0.60 0.498 0.40 0.66 B2011/BMSY 0.53 0.493 0.22 0.41 BMSY 5742 5475 1816 0.32 Repy2011 107 100 50 0.47
Figure 3. Quillback Rockfish stock status for the outside and inside management units in B.C.
Consistent with DFO’s Precautionary Approach and Fisheries Reference Points stock status is presented as the median biomass in 2011 over the biomass at MSY with 90% confidence intervals.
Recent Species Trajectory
Model reconstructions of the Quillback Rockfish biomass from 1918 to 2010 by management unit are shown in Figures 4 and 5, together with catch history and trend indices. The median biomass in 2011 is 37.7% (CV 0.65) of the biomass in 1918 (B1918) for the outside management
unit and 27.4% (CV 0.47) for the inside management unit.
Of interest to COSEWIC for designating species status is the population change over a three generation or 10 year time span, whichever is longer. Table 3 (outside) and Table 4 (inside) show the posterior median estimates of population decline over three generations between 1997 and 2010 given the Reference Case model and under a number of key alternative
scenarios. The outside population in 1997 was 0.41 the population three generations previous. In 2010, the outside population decline is estimated at 0.35. There is a higher level of decline for inside population compared with the outside population. For the Reference Case in 1997 the inside population three generation decline is estimated at 0.28 and in 2010 is at 0.27.
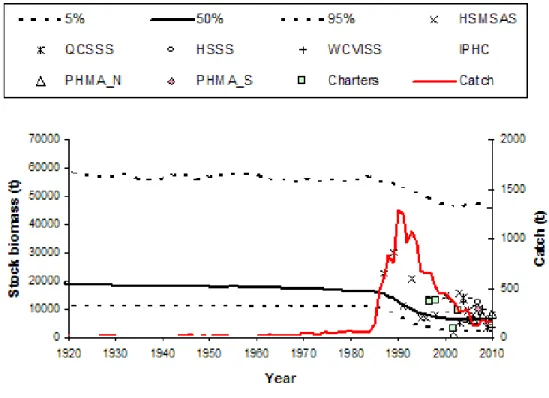
Figure 4. Catch, and posterior median and 90% probability interval for stock biomass (t) of Quillback Rockfish - outside management unit, and the observed stock trend indices divided by their posterior median value for the catchability coefficient for years 1918 to 2010. Results are shown for the reference case. Symbols show survey indices and include the Hecate Strait Multispecies Assemblage Survey (HSMSAS), Queen Charlotte Sound Synoptic Trawl Survey (QCSSS), Hecate Strait Synoptic Trawl Survey (HSSS), West Coast Vancouver Island Synoptic Trawl Survey (WCVISS), International Pacific Halibut commission Standardized Stock Assessment Longline Survey (IPHC), Pacific Halibut
Management Association Longline (PHMA) Survey in Northern B.C. waters (PHMA_N), PHMA Survey in Southern B.C. waters (PHMA_S), and ZN Industry charter longline surveys (Charters).
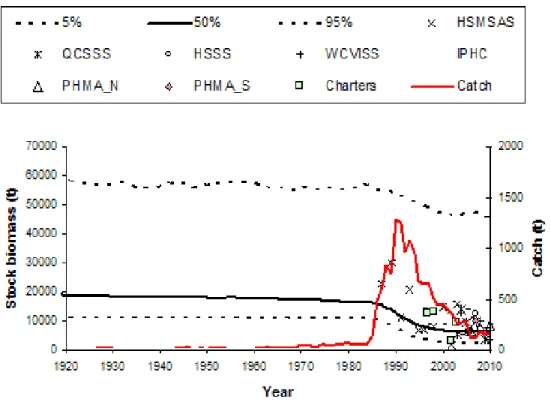
Figure 5. Catch, and posterior median and 90% probability interval for stock biomass (t) of Quillback Rockfish - inside management unit, and the observed stock trend indices divided by their posterior median value for the catchability coefficient for years 1918 to 2010. Results are shown for the reference case. Symbols show survey indices and include the Johnstone Strait Jig Survey (NIjig), Dogfish longline survey (dogfish), Rockfish longline (RLL) survey in PFMA 12 to 16, 18 and 28, submersible survey (sub), and the Strait of Georgia jig survey (SOG,jig).
Table 3. BSP Posterior median estimates of three generations of population decline (Bfin/ Binit) for the
years 1997-2010 for the Reference Case (Ref. 1) and under a number of the key alternative scenarios for the Outside Quillback rockfish populations.
Bayesian Surplus Production model
Year Ref.1 Low r High r B1918/K=0.8 B1918/K=1.2 Low catch High Catch
1997 0.41 0.41 0.43 0.50 0.35 0.37 0.42 1998 0.39 0.39 0.41 0.47 0.34 0.35 0.40 1999 0.38 0.37 0.40 0.45 0.33 0.34 0.38 2000 0.36 0.36 0.39 0.44 0.32 0.33 0.37 2001 0.36 0.35 0.38 0.42 0.32 0.32 0.36 2002 0.34 0.34 0.37 0.41 0.31 0.31 0.35 2003 0.34 0.33 0.36 0.40 0.31 0.31 0.35 2004 0.34 0.33 0.37 0.39 0.31 0.31 0.35 2005 0.34 0.32 0.37 0.39 0.31 0.31 0.35 2006 0.35 0.33 0.37 0.38 0.31 0.31 0.35 2007 0.35 0.33 0.38 0.39 0.32 0.32 0.35 2008 0.34 0.33 0.37 0.39 0.32 0.31 0.35 2009 0.35 0.33 0.37 0.39 0.32 0.31 0.35 2010 0.35 0.33 0.38 0.38 0.32 0.32 0.35
Table 4. BSP Posterior median estimates of three generations of population decline (Bfin/ Binit) for the
years 1997-2010 for the Reference Case (Ref. 1) and under a number of the key alternative scenarios for the Inside Quillback rockfish populations.
Bayesian Surplus Production model
Year Ref.1 Low r High r B1918/K=0.7 B1918/K=1.1 Low catch High Catch
1997 0.28 0.28 0.28 0.34 0.23 0.25 0.28 1998 0.27 0.27 0.27 0.33 0.23 0.24 0.27 1999 0.26 0.26 0.27 0.32 0.23 0.24 0.27 2000 0.26 0.26 0.26 0.31 0.22 0.23 0.26 2001 0.24 0.24 0.25 0.29 0.22 0.22 0.25 2002 0.25 0.24 0.25 0.29 0.22 0.22 0.25 2003 0.25 0.24 0.25 0.29 0.22 0.22 0.25 2004 0.25 0.24 0.25 0.29 0.22 0.22 0.25 2005 0.25 0.24 0.25 0.29 0.22 0.22 0.25 2006 0.25 0.24 0.26 0.29 0.23 0.23 0.26 2007 0.26 0.24 0.27 0.29 0.23 0.23 0.26 2008 0.26 0.25 0.27 0.29 0.24 0.23 0.26 2009 0.27 0.25 0.27 0.30 0.24 0.24 0.27 2010 0.27 0.25 0.28 0.31 0.25 0.24 0.28
Expected Population Trajectories
Generation time for the outside and inside management units for Quillback Rockfish are estimated at 32.0 and 28.5 years, respectively. Future population projections from the model were estimated for 5, 15, 30 and 90 years to cover the 3-generation time frame. Expected population trajectories from the Reference Case model runs projected over three generations for Quillback Rockfish, given various fixed total fishing mortality policies, are shown in Table 5 for the outside management unit, and Table 6 for the inside management unit.
If the recovery target is stated as “95% probability of the population >0.4 Bmsy”, this is expected
to be achieved in about 15 years for the outside management unit at a fixed total fishery mortality of 0 to <30 tonnes, and in 30 years for the inside management unit at 0 tonnes. If the recovery target is stated as “95% probability of the population >0.8 Bmsy”, this is expected
to be achieved in >30 to 90 years for the outside management unit at a fixed total fishery mortality of 0 to <60 tonnes, and at about 90 years for the inside management unit at 0 tonnes.
Table 5. Stock status indicators for Quillback Rockfish - outside management unit after 5, 15, 30 and 90 years. Policies are constant total fishing mortality (TFM) policies (tonnes). BFINAL is the biomass in the
final year of the projection (2016 for 5-year horizon, 2026 for 15-year horizon, 2041 for 30-year horizon, and 2101 for 90-year horizon). Probabilities (P) are presented for 4 stock status indicators: BFINAL will be
above: the Limit Reference Point (40% of BMSY), the Upper Stock Reference (80% of BMSY), the target
biomass of BMSY, and the current 2010 biomass (B2010). Horizon
TFM Policy (tonnes)
BFINAL/BMSY P (BFINAL >
0.4 BMSY) P (BFINAL > 0.8 BMSY) P (BFINAL > BMSY) P (BFINAL > B2010) 5 -year 0 0.86 0.88 0.54 0.41 0.78 30 0.86 0.88 0.54 0.41 0.77 60 0.84 0.87 0.53 0.41 0.73 90 0.83 0.85 0.52 0.40 0.69 120 0.81 0.83 0.51 0.39 0.64 150 0.79 0.82 0.49 0.38 0.59 180 0.78 0.80 0.48 0.37 0.54 210 0.76 0.78 0.48 0.36 0.49 240 0.75 0.77 0.47 0.36 0.44 270 0.73 0.75 0.46 0.35 0.40 15 -year 0 1.19 0.96 0.75 0.62 0.88 30 1.15 0.94 0.72 0.59 0.86 60 1.10 0.92 0.69 0.56 0.83 90 1.04 0.89 0.65 0.53 0.77 120 0.99 0.85 0.61 0.49 0.71 150 0.93 0.81 0.57 0.47 0.64 180 0.88 0.77 0.54 0.44 0.57 210 0.82 0.73 0.51 0.42 0.50 240 0.77 0.69 0.49 0.39 0.44 270 0.71 0.66 0.46 0.37 0.39 30 -year 0 1.55 0.99 0.90 0.82 0.92 30 1.49 0.98 0.86 0.78 0.90 60 1.41 0.95 0.82 0.73 0.87 90 1.33 0.92 0.76 0.68 0.81 120 1.24 0.86 0.71 0.62 0.74 150 1.14 0.81 0.66 0.57 0.66 180 1.03 0.75 0.60 0.51 0.58 210 0.91 0.69 0.55 0.47 0.49 240 0.78 0.63 0.49 0.43 0.42 270 0.65 0.58 0.46 0.40 0.36 90 -year 0 1.88 1.00 0.98 0.96 0.94 30 1.83 0.99 0.97 0.94 0.93 60 1.76 0.97 0.94 0.90 0.90 90 1.68 0.93 0.88 0.85 0.85 120 1.59 0.86 0.81 0.77 0.77 150 1.47 0.78 0.73 0.69 0.67 180 1.31 0.70 0.65 0.61 0.58 210 1.13 0.61 0.57 0.54 0.49 240 0.82 0.54 0.50 0.47 0.41 270 0.00 0.48 0.44 0.41 0.34
Table 6. Stock status indicators for Quillback Rockfish - inside management unit after 5, 15, 30 and 90 years. Policies are constant total fishing mortality (TFM) policies (tonnes). BFINAL is the biomass in the
final year of the projection (2016 for 5-year horizon, 2026 for 15-year horizon, 2041 for 30-year horizon, and 2101 for 90-year horizon). Probabilities (P) are presented for 4 stock status indicators: BFINAL will be
above: the Limit Reference Point (40% of BMSY), the Upper Stock Reference (80% of BMSY), the target
biomass of BMSY, and the current 2010 biomass (B2010). Horizon
TFM Policy (tonnes)
BFINAL/BMSY P (BFINAL>
0.4 BMSY) P (BFINAL> 0.8 BMSY) P (BFINAL > BMSY) P (BFINAL > B2010) 5 -year 0 0.58 0.79 0.23 0.10 0.80 10 0.58 0.79 0.24 0.10 0.80 20 0.57 0.78 0.23 0.10 0.78 30 0.56 0.77 0.22 0.10 0.74 40 0.56 0.75 0.21 0.09 0.70 50 0.55 0.74 0.21 0.09 0.67 60 0.54 0.73 0.20 0.09 0.63 70 0.53 0.71 0.19 0.08 0.60 80 0.52 0.69 0.18 0.08 0.56 90 0.51 0.68 0.18 0.08 0.52 15 -year 0 0.80 0.89 0.50 0.33 0.91 10 0.78 0.88 0.48 0.32 0.89 20 0.75 0.85 0.45 0.29 0.86 30 0.72 0.82 0.42 0.27 0.83 40 0.68 0.80 0.40 0.25 0.78 50 0.65 0.77 0.37 0.23 0.73 60 0.62 0.74 0.35 0.21 0.68 70 0.59 0.70 0.32 0.19 0.62 80 0.56 0.66 0.29 0.18 0.57 90 0.53 0.63 0.27 0.17 0.52 30 -year 0 1.15 0.95 0.73 0.60 0.96 10 1.10 0.93 0.70 0.57 0.94 20 1.04 0.91 0.65 0.53 0.92 30 0.98 0.88 0.61 0.48 0.87 40 0.91 0.84 0.57 0.45 0.83 50 0.84 0.81 0.52 0.41 0.77 60 0.77 0.76 0.48 0.37 0.72 70 0.70 0.70 0.44 0.34 0.65 80 0.63 0.64 0.40 0.31 0.58 90 0.55 0.59 0.37 0.28 0.52 90 -year 0 1.75 0.99 0.95 0.90 0.99 10 1.70 0.98 0.92 0.87 0.98 20 1.63 0.96 0.89 0.83 0.96 30 1.56 0.93 0.85 0.78 0.92 40 1.47 0.88 0.80 0.73 0.88 50 1.37 0.83 0.74 0.67 0.81 60 1.25 0.76 0.66 0.61 0.74 70 1.10 0.68 0.59 0.54 0.66 80 0.91 0.61 0.53 0.47 0.57 90 0.59 0.53 0.46 0.41 0.50
Sources of Mortality
The only source of mortality considered, apart from natural mortality, for Quillback Rockfish in B.C. is from fisheries. The relative contribution of each of these fisheries to the total mortality is estimated from catches by fishery in 2010. For the outside management unit, the total mortality from all fisheries is 158.6 tonnes, of which 116.5 t was taken by the commercial groundfish fishery, 41.8 t by the recreational fishery, and 0.3 t by the salmon troll fishery. For the inside management unit, the total mortality from all fisheries is 33.9 tonnes, of which 24.8 t was taken by the commercial groundfish fishery, 9.0 t by the recreational fishery, and 0.1 t by the salmon troll fishery. An estimate of the total rockfish (all species) coastwide catch (upper 95% CI) in the Spot Prawn fishery ranged from 22,792 rockfish in 2005 to 40,780 rockfish in 2002 (Rutherford et al. 2010). Quillback Rockfish accounted for the greatest proportion (62%) of all rockfish encounters, however, rockfish catch by species, on a coastwide basis could not be estimated due to small sample size and low encounter rates (Rutherford et al. 2010). Aboriginal fisheries and the recreational Spot Prawn trap fishery are likely to account for a small mortality. Mortality in the shrimp trawl fishery has been reported and is mitigated by the implementation of
exclusion devices in the trawls (Olsen et al. 2000). Illegal and unreported catches are unknown across all fisheries.
Measures for Promoting Recovery
Rockfish Conservation Strategy
In the late 1990’s DFO’s conservation concerns over the inshore rockfish stocks resulted in the development of the Rockfish Conservation Strategy (Yamanaka and Logan 2010). This
strategy included 4 components:
1. reductions of 50% and 75% fishing mortality achieved in 2002; 2. improved stock monitoring and assessment achieved in 2003; 3. 100% groundfish catch monitoring achieved in 2006; and, 4. 20 to 30% rockfish habitat closed to fishing achieved in 2007.
The benefits of these measures may take some time to be detected, given the life history and generally low productivity of these inshore rockfish species, including Quillback Rockfish. Together with these management measures, the maintenance of a spawning stock size that does not compromise recruitment is essential for the survival of the stock.
Threats to Quillback Rockfish habitats are not well understood.
The attempts at rockfish aquaculture have not been successful and are impractical at this time for B.C.
Species specific total allowable catches (TACs)
Quillback Rockfish has been managed in the commercial fishery in an aggregate together with Copper (Sebastes maliger), China (S. nebulosus) and Tiger (S. nigrocinctus) Rockfishes
(Aggregate 1&2). One Total allowable catch (TAC) is managed for this species Aggregate 1&2. There is a possibility that Quillback Rockfish (or any of the other species in the aggregate) could be over harvested if the TAC for the Aggregate is set at a higher level than the sustainable catch for Quillback Rockfish (or any one species in the aggregate). Management of a species specific TAC for Quillback Rockfish may be considered, and would mitigate the possibility of over harvesting this species.
The recreational fishery also manages Quillback Rockfish within an inshore rockfish species aggregate which includes all six species of rockfish. Rockfish bag limits and catch caps include all six rockfish species. Similar to the commercial fishery, fishery managers may consider a species specific bag limit and catch caps for Quillback Rockfish.
Reductions to TACs
Fisheries are the only threat to the Quillback Rockfish addressed in this document. In addition to the Rockfish Conservation Strategy mitigation measures already implemented, additional reductions to fishery harvests may be considered.
Sources of Uncertainty
Uncertainties not addressed in sensitivity tests which may affect model outcomes, include possible effects from pinniped predation and trends in recruitment. It is known that pinniped abundance has increased substantially and that rockfish are a component of their diets. For the Yelloweye Rockfish stock assessment for the inside management unit, pinniped consumption was treated like a fishery and included in an exploratory PBSP model. If future research on pinniped diets and consumption rates yield species specific data and show that pinniped mortality is significant for Quillback Rockfish, a PBSP model or other model that could account for this mortality may be considered in a future assessment.
If there are episodic events in recruitment for Quillback Rockfish, this could increase uncertainty in the models used to assess this species. The model accounts for the intrinsic rate of increase of the stock with the r parameter, but large trends (positive or negative) or events in recruitment could have additional effects. Should a time series of appropriate age data become available, an age-structured assessment may be considered in the future for Quillback Rockfish.
CONCLUSION AND ADVICE
This review provides information and advice to both DFO’s Species at Risk and Fisheries Management programs. Stock status, trajectories and projections are presented relative to reference points consistent with DFO’s decision making framework policy which incorporates the Precautionary Approach and COSEWIC criteria.
In 2011, median biomass (B2011) for the outside management unit is 6,480 tonnes (coefficient of
variation [CV] 1.21) and for the inside management unit is 2,668 tonnes (CV 0.60). The median biomass in 2011 is 37.7% (CV 0.65) of the biomass in 1918 (B1918) for the outside management
unit and 27.4% (CV 0.47) for the inside management unit. The outside population in 1997 was 0.41 the population three generations previous. In 2010, the outside population decline is estimated at 0.35. There is a higher level of decline for inside population compared with the outside population. For the Reference Case in 1997 the inside population three generation decline is estimated at 0.28 and in 2010 is at 0.27.
Stock projections are provided for 5, 15, 30 and 90 years into the future given various harvest policies and presents the probability of reaching various reference points (Tables 5 & 6).
SOURCES OF INFORMATION
This Science Advisory Report has resulted from a Fisheries and Oceans Canada, Canadian Science Advisory Secretariat, Pacific Regional Advisory Process meeting held on May 31, 2011, on Stock Assessment and Recovery Potential Assessment for Quillback Rockfish (Sebastes
maliger) Along the Pacific Coast of Canada. Additional publications from this process will be
posted as they become available on the DFO Science Advisory Schedule at
http://www.dfo-mpo.gc.ca/csas-sccs/index-eng.htm.
COSEWIC. 2009. Assessment and Status Report on the Quillback Rockfish (Sebastes
maliger) in Canada. Committee on the Status of Endangered Wildlife in Canada. Ottawa.
vii + 71 pp.
DFO. 2006. A harvest strategy compliant with a precautionary approach. Can. Sci. Advis. Sec. Sci. Adv. Rep. 2006/023.
Love M.S. and Lea, R.N.. 1997. Range Extension of the quillback rockfish, Sebastes maliger, to the southern California Bight. Calif. Fish Game 83(2):78-83.
Love, M.S., Yoklavich, M.M., and Thorsteinson, L. 2002. The Rockfishes of the Northeast Pacific. University of California Press. Berkley and Los Angeles, California. 404p.
Matthews, K. R. 1990. An experimental study of movement patterns and habitat preferences of copper, quillback, and brown rockfishes on three habitat types. Env. Biol. Fish. 29:161-178.
McAllister, M.K. and Babcock, E.A. 2006. Bayesian surplus production model with the Sampling Importance Resampling algorithm (BSP): A user’s guide. Available from:
http://www.sefsc.noaa.gov/library.jsp (January 27, 2010).
Mecklenburg, C., Mecklenburg, T., and Thorsteinson, L.. 2002. Fishes of Alaska. American Fisheries Society. Bethesda, Maryland.
Murie, D.J., Parkyn, D.C. Clapp, B.G. and Krause, G.G.. 1994. Observations on the distribution and activities of rockfish, Sebastes spp., in Saanich Inlet, British Columbia, from the Pisces IV submersible. Fish. Bull. 92:313-323.
Olsen, N., Boutillier, J.A., and Convey, L. 2000. Estimated bycatch in the British Columbia shrimp trawl fishery. Canadian Stock Assessment Secretariat Research Document 2000/168. 54 p
Richards, L.J. 1986. Depth and habitat distributions of three species of rockfish (Sebastes) in British Columbia: observations from the submersible PISCES IV. Envr. Biol. of Fishes 17(1): 13-21.
Rutherford, D.T., Fong, K., and Nguyen, H. 2010. Rockfish bycatch in the British Columbia commercial prawn trap fishery. DFO Can. Sci. Advis. Sec. Res. Doc. 2009/109. iii + 25 p.
Yamanaka, K.L., Lacko, L.C., Miller-Saunders, K., Grandin, C., Lochead, J.K., Martin, J.C., Olsen, N. and Wallace, S.S. 2006. A review of Quillback Rockfish Sebastes maliger along the Pacific coast of Canada: biology, distribution and abundance trends. DFO Can. Sci. Advis. Sec. Res. Doc. 2006/077. 58 p.
Yamanaka, K. L. and Logan, G. 2010. Developing British Columbia's Inshore Rockfish Conservation Strategy. Marine and Coastal Fisheries: Dynamics, Management and Ecosystem Science 2:28–46.
Yamanaka, K.L., Picard, K., Conway, K.W., and Flemming R. 2011. Rock reefs of British Columbia, Canada: Inshore rockfish habitats. p. 509 - 522 In Seafloor Geomorphology as Benthic Habitat: GEOHAB Atlas of Seafloor Geomorphic Features and Benthic Habitats. Eds. P.T. Harris and E.K. Baker. London: Elsevier Insights.
FOR MORE INFORMATION
Contact: K. Lynne Yamanaka
Pacific Biological Station 3190 Hammond Bay Road Nanaimo, BC V9T 6N7 Telephone: Fax: E-Mail: (250) 756-7211 (250) 756-7053 Lynne.Yamanaka@dfo-mpo.gc.ca
This report is available from the: Centre for Science Advice,
Pacific Region
Department of Fisheries and Oceans 3190 Hammond Bay Road
Nanaimo, B.C. Canada V9T 6N7 Phone number: 250-756-7208 e-mail address: CSAP@dfo-mpo.gc.ca Internet address: www.dfo-mpo.gc.ca/csas
ISSN 1919-5079 (Print) ISSN 1919-5087 (Online)
© Her Majesty the Queen in Right of Canada, 2012
La version française est disponible à l’adresse ci-dessus.
CORRECT CITATION FOR THIS PUBLICATION
DFO. 2012. Stock Assessment And Recovery Potential Assessment For Quillback Rockfish (Sebastes Maliger) Along The Pacific Coast Of Canada. DFO Can. Sci. Advis. Sec. Sci. Advis. Rep. 2011/072.