Chemical and Physical Phenomena
Determining Carbon Gasification Reactivityby
Robert Howard Hurt
B.S., Chemical Engineering Michigan Technological University(1982)
Submitted to the Department of Chemical Engineering in Partial Fulfillment of the Requirements of the Degree of
Doctor of Philosophy at the
Massachusetts Institute of Technology August 1987
C Massachusettts Institute of Technology 1987
Signature of Author Department
4 ,,A
/
of Chemical Engineering August 21, 1987 Certified by Adel F. Sarofim of Chemical Engineering Thesis Supervisor Certified by7
V Accepted bySEP 2 5 1987
LIBRAIES
S"
John P. Longwell
Professor of Chemical Engineering Thesis Supervisor
J Robert C. Armstrong
Chairman, Committee on Graduate Students
CHEMICAL AND PHYSICAL PHENOMENA
DETERMINING CARBON GASIFICATION REACTIVITY
by
ROBERT HOWARD HURT
Submitted to the Department of Chemical Engineering on August 21, 1987 in partial fulfillment of the requirements for the Degree of Doctor of Philosophy
in Chemical Engineering
Abstract. It was undertaken in this thesis to investigate the role of coal type, or maceral composition, of microporous surface area, and of reaction-induced carbon densification in carbon gasification. To accomplish this, low temperature gasification rates in oxygen and carbon dioxide were measured in a thermogravimetric analyzer for two synthetic carbons, various coal chars, and chars from several individual coal lithotypes. In addition, the carbons and chars at various stages of gasification conversion were microscopically examined and their pore structures characterized by vapor adsorption techniques. It was found that microporous surface area participates in the gasification of pure carbons. Further, reactant penetration into microporous regions was complete for Spherocarb, a highly macroporous synthetic carbon with correspondingly small microporous regions. The accessible total surface area for Spherocarb is, then, the 636 m2/gm measured by carbon dioxide adsorption, and the intrinsic rate of
oxidation of this carbon in .21 atm. 02 is given by: Rate (gm/sec-m2) - 3.0.103e-3 6/RT
with R in kcal/gmol OK. There is some evidence, on the other hand, that restricted diffusion prevents complete reactant penetration into the microporous regions of a sucrose carbon which has limited macroporosity and thus large microporous regions.
It was also found that the rate of catalyzed gasification of impure carbons can bear no apparent relationship to measured surface area, depending instead on properties of the catalyst. The normalization of the rate of catalyzed gasification by microporous surface area is, in such a case, inappropriate, and the process of catalyzed gasification can not be treated as a total surface area evolution problem with an altered or adjustable intrinsic surface reactivity. Since chars from many naturally-occurring organic parent materials are rich in potentially catalytic inorganic matter, the use of surface area to normalize the gasification rates of many coal chars may be inappropriate.
Chars from individual macerals from a sub-bituminous coal had very different gasification reactivities, due to catalysis by differing amounts of naturally occurring, ion-exchanged inorganic matter. This effect is expected to be most important for low-rank coals with their high oxygen contents and correspondingly high ion-exchange capacities.
Finally, it was shown that kinetically-limited carbon gasification does not take place at constant particle diameter as heretofore widely assumed, but is accompanied by reaction-induced atomic rearrangements, which lead to densification and particle shrinkage.
Shrinkage has a major effect on pore structure evolution
during Spherocarb gasification, and measured surface areas are in pronounced disagreement with the predictions of existing models which do not account for particle shrinkage. Models have been developed of gasification with concurrent densification which can account for much or all of the discrepency between data and constant volume models. Thesis Supervisors: Dr. Adel F. Sarofim
Acknowledgements
I would like to thank Exxon Research and Enginineering Corporation and the National Science Foundation for support of this research and my graduate studies. There are many people in various capacities who have made technical contributions to this thesis. Foremost among them are my advisors Professors Adel Sarofim and Jack Longwell. Their insights were always valuable and their patience often remarkable. I would also like to acknowledge the technical contributions of and to thank the members of my committee, Professors Jack Howard and James Wei,. my UROP students Larry Polleti, Andy Gengos, and Farzan Riza, and many others including Joe Floess, Ziyou Du, Dave Dudek, Tony Modestino, Matteo D'Amore, Tom Hastings, Lenny Sudenfield, Mim Rich, Chuck Mims, and Jenny Devaud.
Many other people, primarily fellow students, offered technical consultation, various other forms of assistance, and/or their friendship. Among this group I would like to thank John Nenniger for his generous help in the summer of '82; my office mates past and present, especially Andreas Kridiotis for his lack of furious activity, Mike Snow, Judy (Tex) Wornat for her southern congeniality, Karl Graham for his lessons on cattle nomenclature, and Joe Helbe for his untiring defense of the "Land of Fun"; Bob Didinato the German Italian American, and the Goethe Institute; the crew in the basement including Craig Vaughn, Tom and Daniel McKinnon, Fred and his wife; Larry, Kevin, Robert, Dennis, and Danny; and Andy Bommarius fur seine Ratschlage.
I would like to thank my father and my parents-in-law for their encouragement and support, and my wife for her love, patience, and income.
Finally, I would like to dedicate this thesis to my mother, who thought that I should be an engineer before I knew what one was, but who was unable to see the completion of my studies.
TABLE OF CONTENTS
List of Figures and Tables 8
Thesis Digest 11
D1. Introduction and Background 12 D2. Materials and Experimental Procedures 17 D3. The Role of Microporous Surface Area in
Carbon Gasification 19
D4. The Phenomenon of Gasification-Induced Carbon Densification and its Influence on
Surface Area Evolution 42 D5. The Effect of Coal Type or Petrographic
Composition on Char Gasification Reactivity 60
D6. Conclusions 64 Digest References 69 Chapter 1. Introduction 71 1.1 Introduction 71 1.2 Problem statement 73 1.3 Literature review 74 1.4 Thesis objectives 89 Chapter 2. Materials and Experimental Procedures 91 2.1 Carbon preparation 91 2.2 Gasification rate measurements 95
2.3 Microscopy 96
2.4 Adsorption isotherms and adsorption
equilibration times 99 Chapter 3. The Role of Microporous Surface Area
in Carbon Gasification 103
3.1 Approach 103
3.2 Results 105
3.21 Microscopy 105
3.22 Gasification rates 112 3.23 Surface areas and adsorption
equilibration times 122
3.3 Discussion 131
3.31 Data summary 131 3.32 Microporous diffusion limitations 135
3.33 Catalysis 137
3.34 Evidence of gasification within the
micropores of pure carbons 137 3.35 Estimation of n for sucrose carbon 141 3.36 Estimation of n for Spherocarb carbon 148
3.37 Summary of sucrose and
Spherocarb analyses 154 3.38 The role of microporous surface area
in the gasification of a
sub-bituminous coal char 158 3.39 Possible nature of catalytic action
during the gasification of
the coal chars 162
3.4 Summary 164
Chapter 4. The Phenomenon of Gasification-Induced Densification
and its Influence on Surface Area Evolution 167
4.1 Results 167 4.2 Discussion 179 4.21 Homogeneous shrinkage 179 4.22 Gasification-induced densification 181 4.23 Densification kinetics 185 4.24 Implications 186 4.3 Modeling of gasification with
concurrent densification 187 4.31 The Gavalas random pore model 189 4.32 Modeling approach 191 4.33 Shrinkage at constant mass 192 4.34 Simple model 196 4.35 Exact numerical treatment 201 4.36 The Simons pore tree model 209 4.37 Modeling summary 214
Glossary of Terms 217
Chapter 5. The Effect of Coal Type or Petrographic Composition
on Coal Char Gasification Reactivity 218 Chapter 6. Conclusions and Recomendations 225
6.1 Conclusions 225
6.2 Recommendations 231
Appendices
A. Spherocarb Diffusion Analysis 235 B. Additional Information Pertaining to Modeling 238
List of Figures
(excluding digest and appendices)
pg 1.1 Amorphous carbon structure 76 3.1 Photographs and S.E.M. micrographs (see also 4.1) 106 3.2 Effect of particle size on Spherocarb carbon
oxidation reactivity 114
3.3 Comparison of the oxidation reactivity of untreated
and demineralzed Spherocarb carbon 115 3.4 Compilation of Spherocarb oxidation rates
at various temperatures 116
3.5 Effect of particle size on sucrose char reactivity
in carbon dioxide 117
3.6 Additional tests of the effect of particle size
on sucrose char reactivity 119 3.7 Carbon dioxide gasification reactivities of coal chars 120 3.8 Gasification reactivity of high temperature coal char 121 3.9 Sucrose char surface area evolution: <38 ym diameter particles 123 3.10 Sucrose char surface area evolution: 180 pm diameter particles 124 3.11 Effect of conversion on the Dubinin Gradient 125 3.12 Rate of carbon dioxide uptake into sucrose carbons 126 3.13 Rate of carbon dioxide uptake into Spherocarb carbons 128 3.14 Sub-bituminous coal char surface area evolution 129 3.15 Rate of carbon dioxide uptake into coal chars 130
3.16 Gasification reactivity and surface area evolution of
high-temperature coal char 132 3.17 Effect of particle size on sucrose char gasification
reactivity: measurements and predictions of
microporous grain model 144
3.18 Analysis of microporous diffusion during
3.19 Second analysis of microporous diffusion during
Spherocarb oxidation 155
4.2 Diameter reduction during Spherocarb oxidation 168 4.1 Photographs and S.E.M. micrographs (see also 3.1) 170 4.3 Behaviour of surface features during Spherocarb oxidation:
comparison with behavior expected during homogeneous
shrinkage and with behavior expected in the presence of an
external reaction component 178 4.4 The Jenkins model of glassy carbon structure 183 4.5 Spherocarb area evolution: comparison of data and
prediction of the Gavalas random pore model 188 4.6 Shrinkage at constant mass: Effect on total porosity 193 4.7 Shrinkage at constant mass: Effect on small-pore porosity 195 4.8 Shrinkage at constant mass: Area reduction during
pore narrowing 197
4.9 Shrinkage at constant mass: Area reduction during
pore elimination 198
4.10 Spherocarb pore structure evolution 200 4.11 Spherocarb surface area evolution: Simple model of
gasification with densification based on the Gavalas
formulation, along with original Gavalas prediction and data 202 4.12 Gasification with concurrent densification: numerical scheme 204 4.13 Spherocarb surface area evolution: Effect of step size on
numerical solution 206
4.14 Spherocarb surface area evolution: Results of numerical solution along with data, simple model result, and original
Gavalas prediction 207
4.15 Spherocarb surface area evolution: Results of numerical
solutions with and without pore coalescence, along with data, and original Gavalas prediction 210 4.16 Spherocarb surface area evolution: Comparison of original
Gavalas prediction, original Simons prediction and data 212 4.17 Spherocarb surface area evolution: Gasification/densification
model based on Simons random pore model, along with data
4.18 Spherocarb surface area evolution: Simons gasification/densi-fication model with a combination of pore narrowing and
pore elimination, along with data and original Simons
prediction 215
5.1 Carbon dioxide gasification reactivities of chars from
sub-bituminous lithotypes and whole coal 219 5.2 Carbon dioxide gasification of chars from sub-bituminous
lithotypes and whole coal: reactivity plotted as time
required to reach as given conversion 220
List of Tables
1.1 Carbon conversions in industrial gasification processes 72 2.1 Elemental analyses of PSOC 156 whole coal and lithodtypes 92 2.2 Ash content of various coals and chars 92 2.3 Particle size distributions of sucrose char samples 94 3.1 Effect of particle size on sucrose char surface area 127 3.2 Calculated effectiveness factors for sucrose carbon
gasification in the absence of restricted diffusion 133 3.3 Microporous grain model:.Optimum parameters 143 3.4 A comparison of the carbon dioxide gasification rates
of various chars 160
4.1 Extent of diameter reduction during gasification of
various carbons and chars 169
4.2 Spherocarb surface areas measured in a conventional
volumetric adsorption apparatus 177
4.3 Porosity in pores participating in coalescence 209 5.1 Comparison of carbon dioxide gasification reactivities
DOCTORAL THESIS DIGEST CHEMICAL AND PHYSICAL PHENOMENA DETERMINING CARBON GASIFICATION REACTIVITY
by
ROBERT HOWARD HURT
THESIS SUPERVISORS: A.F. SAROFIM J.P. LONGWELL
Doctoral Thesis Submitted to the Department of Chemical Engineering, Massachusetts Institute of Technology, Cambridge, MA 02139
Dl. Introduction and Background
Carbon, as the term will often be used in this thesis, refers not to an entry in the periodic table, but to a class of solid materials containing primarily carbon, made by heating an organic substance in the absence of air.
Carbons participate in high temperature reactions with a variety of gaseous species, in which the solid carbon is consumed and new gaseous species are produced. These are the so-called gas reactions of carbon, and the set of gaseous reactants includes oxygen, carbon dioxide, hydrogen, and water vapor.
The gas reactions of carbon are fundamental to many commercial endeavors, including coal gasification and combustion, the production of activated carbon, and those applications in which carbon is used as an engineering material. The gasification reactivity of carbons is especially important in many gasification -processes, determining equipment size and/or carbon conversion efficiency(Dl). Under most conditions, the total time required for the gasification of a coal particle is dominated by the burn-out of the residual char remaining after devolatilization. The design of many gasifiers is thus carbon reactivity limited and, in fact, many gasifiers operate with significantly less than 100% carbon conversion despite strong economic incentives to use coal efficiently.
Because of its importance a large body of research on coal char gasification kinetics has accumulated, whose goal is to predict the effect of reactant gas composition, pressure, temperature, coal type,
char preparation and prior gasification history on the gasification rate and the product distribution.
D1.1 Problem statement.
This thesis concerns itself with several aspects of the relationship between carbon properties and carbon gasification reactivity. Reactivity in the carbon-oxygen system per unit internal surface area, corrected for external and pore diffusion limitations, has been shown to vary by as much as four orders of magnitude at a
given temperature and oxygen partial pressure(D2). There is, at present, an inadequate understanding of the phenomena that determine
the rate at which a given carbon will gasify.
Identification and fundamental understanding of the important phenomena could guide the design of gasification processes to enhance char reactivity, and thus improve performance. The fundamental approach should best start with phenomena determining the accessible surface area for gasification, from which a meaningful intrinsic rate can be calculated. This intrinsic rate would be a true property of the carbon surface, and could potentially be fundamentally related to (or at least correlated with) other properties of the carbon surface.
D1.2 The appropriate total surface area for gasification.
There is, at present, much uncertainty about the effective total surface area for gasification. It is well known that carbon surface areas measured by vapor adsorption techniques are often a strong function of the size of the adsorbate molecule. For example, large
discrepancies between areas measured by carbon dioxide and nitrogen are quite common, and Nandi et al.(D3) have presented good evidence that they are associated with the occurrence of restricted diffusion in carbon micropores.
Restricted diffusion occurs when the size of the pore approximates the size of the diffusing molecules. The diffusing molecules, then, are at all times under the influence of the potential energy field associated with the adjacent pore walls, and the rate of diffusion is slow, activated, and very sensitive to the size of the pores and the size and shape of the diffusing species(D4). Restricted diffusion is commonly observed for a variety of gases including nitrogen and carbon dioxide in both zeolites and coals or carbons(D4).
Because most of the surface area in high-area carbons lies in the micropores, the identification of the appropriate total surface area for gasification is equivalent to understanding the role of the microporous surface area. There is much confusion in the literature surrounding this topic, as well as a lack of experimental information.
Johnson(D5), for example, has cited evidence for micropore widening during gasification of coal chars, while Rist et al.(D6) observed a characteristic micropore diameter of 20 A, independent of conversion. Dutta observed that the rates of gasification of his chars were proportional to the surface area lying in pores with diameters
larger than 30 A(D7), while there was evidence for micropore widening and thus microporous reaction during the gasification of an anthracite char(D8).
D1.3 The phenomenon of gasification induced carbon particle shrinkage.
Dudek(D9), in a parallel study at M.I.T., during single particle gasification experiments in an electrodynamic balance, has observed significant diameter reduction during air-oxidation of Spherocarb carbon particles under conditions where no preferential gasification on the external
surface is expected. The origin of this phenomenon was unknown at the outset, as were its implications to gasification behavior.
D1.4 The effect of coal type or maceral composition.
Another variable which may have an important influence on gasification reactivity is petrographic composition, or coal type. Type refers to the classification of a coal according to its vegetable matter composition at the start of coalification, in contrast to rank, which is a measure of the extent of coalification, or geologic age. All coals are composed of microscopic, optically homogeneous materials that have been called macerals (in an analogy to inorganic minerals). In addition, characteristic groupings of macerals occur, called lithotypes, which give coals their more or less pronounced macroscopic banding. It is the relative proportion and spatial arrangement of the different macerals and minerals which distinguishes coals by
type(DlO).
Whereas a correlation between coal rank and char gasification reactivity has been noted(Dll), relatively little is known about the relationship between maceral composition (coal type) and reactivity.
DI.5 Thesis objectives.
This thesis addresses several aspects of the relationship between carbon reactivity and carbon properties. The first, which is summarized in section 3, is the identification of the accessible total surface area for carbon gasification. This is an endeavor which is important in the successful development of correlations of carbon reactivity, and in the development of gasification or pore structure models. The lack of knowledge of the appropriate area is, in addition, a major stumbling block to the measurement of meaningful intrinsic reactivities and thus the attainment of a more fundamental understanding of the factors determining carbon gasification reactivity. We hoped to identify the effective surface area for the gasification of several carbons, and, further, to understand the factors that determine the effective area for carbons in general.
Secondly, as summarized.in section 4, it was undertaken in this thesis to investigate the phenomenon of gasification-induced carbon densification/shrinkage observed in this lab by Dudek(D9). The first goal was to find an explanation for the observed diameter reduction during gasification of Spherocarb carbon, the second to measure diameter reduction during the gasification of other chars, and the third to understand the influence of the phenomenon on surface areas, and to develop models of surface area evolution during gasification with concurrent shrinkage.
Finally, in section 5, we look at an important topic which has thus far received insufficient attention: the effect of coal type on coal char gasification reactivity. Our goal was to measure the
reactivities of chars from maceral concentrates separated from one coal to directly assess the importance of type to its gasification behavior, and hopefully to gain some insight into the role of coal type for other coals.
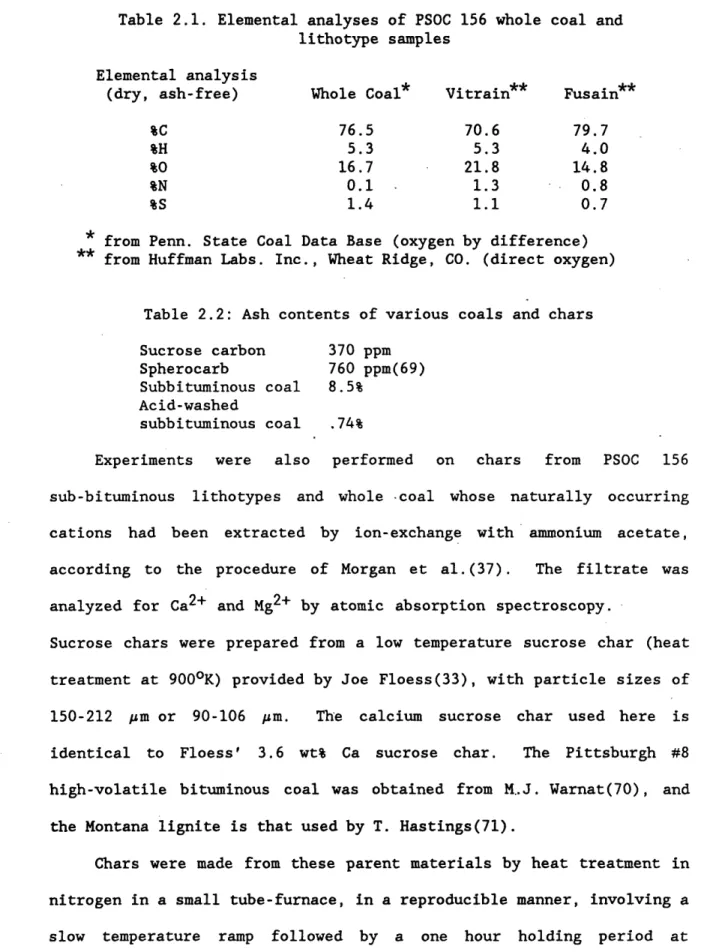
D2. Materials and Experimental Procedures
This thesis presents experimental results obtained for Spherocarb carbon and chars from a Utah sub-bituminous coal, Pittsburgh #8 high-volatile bituminous. coal, a Montana lignite, reagent grade sucrose, and a sucrose and carbon black composite. Chars were made from the various organic parent materials by heat treatment in nitrogen in a small tube-furnace, at 1000 oC for one hour. Chars at various stages of gasification conversion were produced by reaction in a thermo-gravimetric analyzer or, for larger samples, in a small-tube furnace.
Many carbon particles at various stages of conversion were examined in this study by S.E.M. and by optical microscopy. A technique was developed, whereby an S.E.M. micrograph could be obtained of the fine features on the external surface of a given particle in a given orientation at several stages of conversion. This required that the particle be mounted in a holder that is stable and inert under gasification conditions, is preferably electrically conductive to improve the S.E.M. image, and can be mounted on an S.E.M. stub; and that the S.E.M. preparation does not destroy or contaminate the particle.
graphite, covered with platinum foil, with conical pits indented in the surface with a sharp instrument, into which the carbon particles of interest were lightly pressed. The graphite was observed to undergo little gasification in the T.G.A. under the conditions used, and the mounting produced a good S.E.M. image with relatively little charging. At least a complete hemisphere was visible for most particles, and enough (about 80%) of the particles maintained their original orientation upon handling to make the technique useful.
Nitrogen and carbon dioxide adsorption isotherms and adsorption equilibration times were measured for many of the carbons in a volumetric adsorption apparatus. The apparatus and procedures are similar to those described by Floess(D12). Adsorption isotherms of carbon dioxide were measured at 0 OC in an ice bath, and those of nitrogen at 77 OK in a liquid nitrogen bath. Surface areas were calculated from the carbon dioxide isotherms using the Dubinin-Polanyi equation, and from the nitrogen isotherms using the B.E.T. equation.
The rate of carbon dioxide uptake into initially evacuated carbon samples at an initial carbon dioxide pressure of approximately 5 torr was measured for several carbons.
Gasification rates were measured with a Cahn thermogravimetric analyzer (T.G.A.) by a procedure similar to that described by Floess(D12). The reaction rate was maintained below .2 mg/min to avoid the effects of external or intra-bed mass and heat transfer limitations(D12). Gasification reactivities were, in fact, found to be independent of bed size under several conditions tested here (each with a gasification rate <.2 mg/min).
3. The Role of Microporous Surface Area in Carbon Gasification
In this section we are concerned with identifying the accessible total surface area for gasification, which, as discussed in the introduction, is a logical starting point in the quest for an improved fundamental understanding of the factors that determine carbon gasification reactivity.
D3.1 Approach.
In this study, we attempted to understand the role of microporous surface area during the gasification of Spherocarb carbon, sucrose carbon, and -various chars of the P.S.O.C. sub-bituminous coal. A number of experimental and analytical techniques were. applied in this study which are capable of providing information on the role of microporosity in gasification.
A change in micropore dimensions is one indication of gasification
within micropores and was detected here using information from vapor adsorption methods. A gasification mode in which reaction were
confined to the surface of large pores, would result in macropore growth, which would potentially be visible upon examination of particle surface features before and after gasification. Individual fine features on the surfaces of carbon particles were therefore examined as a function of gasification conversion by the captive-particle
S.E.M. technique.
The quantitative determination of the accessible surface area for gasification is equivalent to finding the reaction effectiveness factor
was measured, to provide information on the extent of reactant penetration and thus the reaction effectiveness factor. Finally, r
was estimated from an analysis based on measured carbon dioxide diffusion times during vapor adsorption experiments.
D3.2 Results and Discussion.
D3.21 Data summary. In order to understand the role the microporous surface area in the gasification of the various carbons in this study, we consider the following distinguishing features of the experimental results.
1) The gasification rate of sucrose carbon in figure 3.5 is a function
of particle size, under conditions for which a classical calculation of the effectiveness factor for Knudsen diffusion in
12.5 A diameter pores (average pore size for a measured surface
area of 800 m2/gm, a measured porosity of .25, and a particle density of 1.0 gm/cc) with an assumed tortuosity factor of 5, and a measured porosity of .25 predicts essentially complete reactant penetration and thus no particle-size effect. The experimental determination of the effect of particle size on reactivity is a classical test for the extent of reactant penetration, and the results in figure 3.5 suggest that only a portion of the total surface area is available, and that carbon dioxide diffusion in sucrose micropores is significantly slower than Knudsen diffusion with a tortuosity factor of 5. The gasification rate of Spherocarb carbon was, on the other hand, essentially independent of particle
V.',' (0 (t
lo
25
r-(0 -p--43S20
C
----r-II
15
E%o
10
cc
5
x o0
10
20
30
40
50
60
70
80
90
100
% Conversion
Figure 3.5
Gasification Reactivity of
I It930 C,. i atm. CO,
Mean particle diameter:
o
5
p
o 20 p a 50 I A 1BO pS0
-
-,,, I.... I I ! II Io
Sucrose Carbon
size in air, as shown in figure 3.2, and in a carbon dioxide/carbon monoxide mixture.
2) The gasification reactivity of the 1200 OC char from the acid-washed subbituminous coal bears no apparent relation to the char's total surface area, as seen in figure 3.16.
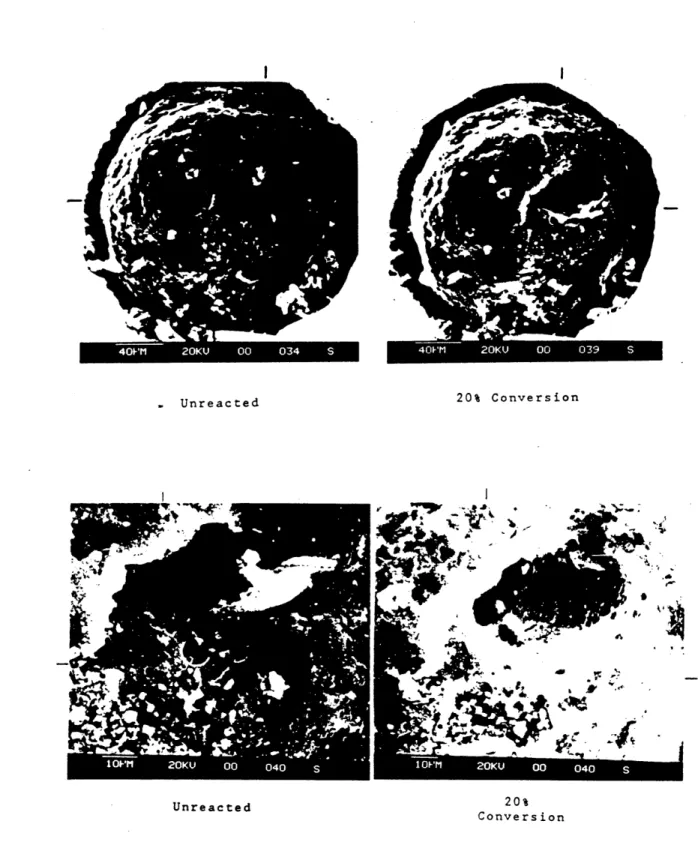
3) All features > 100 nm on the surfaces of sucrose and Spherocarb carbon particles are preserved during gasification, as seen in several sample photograhs in figure 3.1 taken using the captive-particle S.E.M. technique. There is evidence of uneven gasification of the external surface of the acid-washed sub-bituminous coal char, on the other hand, apparently in the form of'production of approximately circular pits, as also seen in figure 3.1.
4) The Dubinin gradients in figure 3.11, which are qualitative indicators of micropore size, increase with conversion for the sucrose carbon, but are constant throughout conversion for the sub-bituminous coal chars.
5) The molecular sieve nature of sucrose carbon, as evidenced by the large difference between its nitrogen and carbon dioxide surface areas, is destroyed rapidly by gasification, as seen in figure 3.9. The sub-bituminous coal chars also exhibit a molecular sieve nature, which, however, is only gradually destroyed throughout conversion, as shown in figure 3.14.
6) The carbon dioxide adsorption equilibration time is much longer for unreacted sucrose carbon than for unreacted or partially reacted Spherocarb or for partially reacted sucrose carbon.
A l!~ -' 13 5
A 50
c E E J, E cl X10
cr '-I0
10
20
30
40
50
60
70
80
90
100
% Conversion
Figure
3.2
Reactivity of Spherbcarb
I A A t A A 0 'g88 OgEEB~a
a
2
02
600
OC
in .21 atm. oxygen
, t i 1 , i Y v495 OC
in .21 atm.
oxygen
-1 A L I I r I I r , -- -- i i I i l i ,Oxidation
I-'
-300
0
10
20
30
40
50
60
70
80
90
100
% Conversion
Figure
3.16
Area Evolution of High Temp.
I T c-aC .0 C, (. C -r--E E O( oM C-)
200
100
a)
C
o
X5
rt (D4
I-.33
2
Uo
a0S-3
025
Unreacted 20% Conversion
Unreacted 20%
Conversion
Spherocarb in .21 atm. 02, 495 OC
Set of micrographs at increasing magnification
Figure 3.1 Photographs and S.E.M. Micrographs .
20% Unreacted Conversion
40 0 02
Unreacted 20% Conversion
Spherocarb in .21 atm. 02. 495 OC Set of micrographs at increasing magnification, continued
0% conversion 29% conversion
41% conversion 77% conversion
Acid-washed sub-bituminous coal char in 1 atm. CO2 at 860 OC
*
1Gasification
in
atm. CO2
-
Gasification in I atm. Ct)2
A 180 pI sucrose carbon
a <38 p sucrose carbon (B)
o subbituminous coal char
o char from acid-washed sub. coal
0.18
0.17
0.
16
0.15
0.141
0.13
0.12
0.11
0.10
U
O
O20
30
40
50
60
70
80
90
0
10
% Conversion
Figure 3.11
Efffect
of Conversion on the Dubinin Gradient
/E
09
08
n
07
100
______ _ _· - -__~- ___-i
d-' f~ f~ f~ ' jUU 0 L
0
2500
cn
C
*riC
2000
EC-E
1500
0) E1000
a)w
500
O C.0
10
20
30
40
50
60
70
80
90
100
% Conversion
Figure 3.9
I
20
30
40
50
60
70
80
% Conversion
Figure 3.14
Coal Char Surface Area Development
800
600
400
200
C .0 t0 Co E-I E 0( U-(-T-L1 O010
90
100
In the following sections, we attempt to understand the role of microporous surface area for sucrose and Spherocarb carbons by considering possible diffusion limitations within microporous grains lying between larger pores. The coal chars, on the other hand, behave much differently from the two pure carbons, and the hypothesis is developed in the following sections that mineral matter catalysis determines the coal char behavior, including the role of the microporous surface area. In light of this, the coal chars and the pure carbons are discussed separately, after the following general discussion of the role of microporous diffusion limitations in gasificationr
D3.22 Microporous diffusion limitations. Since diffusion of gasification reagents in carbon micropores may be in the restricted diffusion range and thus very much slower than molecular or Knudsen diffusion, there exists the possibility of diffusion limitations within microporous regions or "grains" lying between larger pores, under conditions where there are no diffusion limitations in the larger pores themselves. The severity of microporous diffusion limitations scales as L2/D, where D is the local microporous diffusivity, a parameter which depends upon micropore size, and L is the characteristic size of the microporous regions, a parameter determined by the extent of carbon macroporosity.
Microporous diffusion limitations will give rise to an effect of particle size on reactivity, whose magnitude will depend upon the relative sizes of the microporous grains and the carbon particle. In the limit of very small microporous grains there will be no effect of
particle size, as fracture of the particle may be expected to occur without significant fracture of the small microporous grains in which the diffusion limitations actually lie. The particle size effect will be larger, however, for systems with less macroporosity, and thus with a larger characteristic grain radius.. In the presence of severe microporous diffusion limitations, reactant penetration into microporous regions would be very limited, and the reaction front would be essentially confined to the surfaces of larger pores. Gasification in this mode would be accompanied by macropore growth, which would be potentially observable by microscopy. Gasification of highly
microporous chars occuring within micropores, in contrast, would not be accompanied by observable macropore growth or by any other observable changes in the external particle surface. This is true because the extent of surface recession is of the same order as the characteristic distance between micropores, which can be shown to be of order 30
A.
D3.23 The role of micropores in the gasification of the pure carbons.
The preservation of even the finest surface features visible by
S.E.M. during gasification of both Spherocarb and sucrose carbonindicates that the reaction is not confined to large-pore surfaces but occurs instead uniformly throughout the structure at this resolution, in pores invisible to S.E.M. Evidence for micropore widening during gasification, and thus additional evidence for reaction in micropores comes from the measurement of carbon dioxide and nitrogen surface areas for a set of sucrose carbons at various stages of gasification conversion. The rapid rise in nitrogen surface area (at almost constant carbon dioxide area) during gasification indicates that the
micropores are widening to become accessible to nitrogen at the temperatures of nitrogen adsorption experiments (77 OK), at which temperature restricted diffusion can be very slow. A second indication of micropore widening is the increase, during conversion, of the Dubinin gradient, a qualitative measure of micropore size derivable from carbon dioxide adsorption isotherms.
Another interesting feature of the sucrose char surface area evolution are the extrordinarily high nitrogen areas at high conversions, aprroximating the theoretical maximum surface area for isolated graphite planes, and in disagreement with the carbon dioxide areas. Nitrogen areas of this magnitude are thought not to be
reliable, but, rather to indicate the presence of pore volume filling(D13).
We consider next whether reactant penetration is complete, and the gasification strictly kinetically limited, or if there are some finite microporous diffusion limitations.
D3.24 Estimation of t7 for sucrose carbon. An interesting feature of the sucrose reactivity data in figure 3.5 is that the effect of particle size is rather small between particle diameters of 180 and 50 pm, but increases substantially with further diameter reduction. This behavior is characteristic of the gasification of a carbon in which there are diffusion limitations within microporous grains that are significantly smaller than the particle itself.
We undertook to formulate the simplest possible model that incorporates the feature of diffusion limited microporous grains, in order to illustrate and quantify this concept. A sucrose carbon
particle is modeled as a collection of accessible but internally diffusion limited microporous grains which are spherical and have a monodisperse distribution of radii. Access to the microporous grains is provided by larger pores, which, in the case of sucrose carbon, may be the relatively few macropores(D12) and/or some fraction of the wider micro- and mesoporosity.
The observed gasification rate Robs of such a particle of radius Rp is a function of the intrinsic reaction rate Ri, the effective microporous diffusivity Dm, and the grain radius Rg, which comprise the three parameters in this model. The observed rate is given by Robs = tRi, where Y is calculated from Ri, Rg, and Dm according to the classical formulation. The model was completed by deriving an approximate expression for the effect of particle size reduction by grinding on grain size.
Figure 3.17 is a plot of the gasification reactivity at 20% conversion taken from Figure 3.5 for the four particle sizes, along with the predictions of the model generated using the optimum values of the parameters determined by nonlinear least-squares regression. The
particle size effect is quite consistent with the model of accessible
but internally diffusion limited microporous grains with a of radius of
27 pm.
The diffusivity from the model is between two and three orders of magnitude lower than the effective Knudsen diffusivity in 12.5 A pores with a tortuosity factor of 5, and a porosity of 0.25, and is therefore in the restricted diffusion range.
0.3
0.4
0.5
1/Radius Pm
Figure 3.17
Effect of Particle Size on Sucrose
Char Reactivity
U0
25
20
10
C c-oC-M
E Co *1-1 c E CE m-cO0
0.0
0.1
0.2
increased reactivity of smaller particles, especially for the 5 pm fraction, which was intensively ground. The model parameters should therefore be regarded as setting an upper limit on the severity of diffusion limitations during sucrose gasification.
Carbon monoxide was found to inhibit the rate of carbon gasification in carbon dioxide, but the effect of particle size was the same in a carbon dioxide and carbon monoxide mixture as in pure carbon dioxide, indicating that the effect of particle size in pure carbon dioxide is not associated with carbon monoxide (reaction product)
inhibition during otherwise kinetically limited gasification.
D3.25 Determination of r for Spherocarb carbon. The reactivity of Spherocarb carbon, unlike that of sucrose carbon, is essentially independent of particle size. This is a necessary but not sufficient condition for intrinsic gasification, due to the possibility of incomplete reactant penetration into microporous grains that are much smaller than the particle itself. Since the severity of diffusion limitations scales as L2/D, however, it is unlikely that the gasification of a solid with very small microporous grains would be microporous-diffusion limited. It is, in fact, unlikely in the particular case of Spherocarb, in which the microporous grains must be small enough to ensure no particle size effect, and in which the local microporous diffusivity is expected to be as large or larger than that in sucrose carbon. (Spherocarb's initially high nitrogen area suggests wider micropores.) Nevertheless, the extent of reactant penetration into microporous regions in Spherocarb needs to be established, and in order to do so, we turn to measurements of diffusion times during vapor
adsorption experiments.
The adsorption of carbon dioxide in Spherocarb at 45% conversion was 87% complete after .95 seconds, yielding a characteristic diffusion time of 5.9 sec. This characteristic diffusion time was used in an analysis of microporous diffusion limitations for the Spherocarb oxygen reactions whose rates are plotted on the Arrhenius plot of figure 3.19. There is some uncertainty associated with the extrapolation of restricted diffusion coefficients to other conditions, and thus some uncertainty associated with this analysis, due to an incomplete understanding of the phenomenon of restricted diffusion(D14). We believe it -to be a valuable analysis nevertheless, especially in connection with other analyses and experiments. Results of the analysis suggest that the Spherocarb-oxygen reaction is intrinsic and occurs fully within the micropores within the temperature range investigated here, up to at least 600 OC.
Another useful analysis uses the diffusivity obtained from application of the microporous grain model to sucrose reactivity data in order to assess the severity of diffusion limitations for Spherocarb. To do this, one needs to know the length scale for microporous diffusion in Spherocarb carbon. An estimate of this length scale is the characteristic radius of microporous grains, defined here as those regions containing no pores larger than 100 A in diameter, and calculable from the measured surface area lying in pores with diameters greater than 100 A. Microporous grains according to this definition have an external area of .092 m2/gm and a radius of 24 ym for sucrose carbon, and an external area of 15 m2/gm and a radius of .15 pm for
F
-7
·tni
c0i
. C m 100 *1 t C E10
00
10-~
cc o•, r-i - --•r---1
If
I
4
x4D
10-
4L
7
9
11
13
15
10
4
x 1/T OK
Figure 3.19
Spherocarb-Air Reaction
1
I
I | ISpherocarb. The large difference reflects the limited macroporosity of sucrose carbon in contrast to the extensive macroporosity of Spherocarb. Effectiveness factors for Spherocarb oxidation, calculated using this length scale and the microporous diffusivity from the sucrose model, are unity for each of the measured reaction rates in figure 3.19 between 400 and 600 OC. The diffusion limited solution at higher temperatures can be generated by extrapolating the existing (kinetic) data and using, again, the estimated length scale and the sucrose diffusivity. This solution is shown in Figure 3.19, and suggests that microporous diffusion limitations may start to become important for Spherocarb at temperatures higher than those examined here.
These analyses strongly suggest that the measured Spherocarb oxidation rates are intrinsic, and that the accessible total surface area for Spherocarb is expected, then, to be the 636 m2/gm measured by carbon dioxide adsorption, and the measured activation energy of 36 kcal/mol to be the intrinsic activation energy for oxidation of this carbon. This is a typical activation energy for a low temperature char or carbon, but is substantially lower than activation energies measured for oxidation of some graphites(D2), the difference presumably arising from the different degrees of purity and crystallinity(D15). This level of understanding of diffusional processes is necessary for the fundamental treatment of many aspects of carbon gasification, including, in fact, the pore structure modeling effort summarized in section D4.
study is therefore thought to be related to a difference in the characteristic size of microporous grains in the two carbons. The severity of microporous diffusion limitations for most chars should lie between that for the highly macroporous Spherocarb and that for the essentially non-macroporous sucrose carbon. The carbon dioxide surface area should therefore be the appropriate total surface area for the gasification of many pure carbons, although restricted diffusion limitations may be important during low temperature gasification for chars with little macroporosity.
D3.26 The role of microporous surface area in the gasification of a subbituminous coal char. Chars from untreated and acid-washed P.S.O.G. 156 subbituminous coal behaved very differently during gasification than did the synthetic chars of the previous section. In contrast to the sucrose char, carbon dioxide gasification of the low temperature coal chars was accompanied by a relatively slow burnout of the char's molecular sieve properties as seen in figure 3.14. In addition, gasification was not accompanied by measurable micropore widening, as indicated by the constant Dubinin gradient in figure 3.11. These two results suggest that the contribution of microporous surface area to the gasification rate is small.
In order to further investigate the role of the micropores in the gasification of the subbituminous coal chars, the char from the acid washed coal, heat treated previously at 1000 OC for one hour, was subjected to an additional heat treatment at 1200 oC for one hour, in hopes of eliminating the microporous surface area and observing the subsequent effect on gasification behavior. The surface area, measured
by carbon dioxide adsorption did drop from 510 to 4 m2/gm, while the initial gasification rate decreased by only about a factor of 4. Further, as shown in figure 3.16, the gasification rate of the higher temperature coal char was near its maximum at 0% conversion, and thereafter decreased monotonically, while the carbon dioxide surface area increased strikingly, from 4 to over 200 m2/gm. The gasification rate of this char bears no apparent relation to its total surface area. A possible interpretation is that inaccessibility of or slow reaction within the micropores confines the reaction front to the surfaces of larger pores. This interpretation can be ruled out however, because each of the coal chars has a higher reactivity at a given temperature than either sucrose or Spherocarb carbons, which have been shown to undergo gasification within their micropores.
We seek, therefore an alternative explanation. Marsh(D16) has microscopically observed pitting, channeling, and/or uneven gasification of the surface of many carbons doped with various inorganic impurities. Rarely, if ever, did gasification in the presence of catalytic agents take place uniformly over the carbon surface, in contrast to the gasification of his pure carbons.
In light of the high gasification reactivity, the apparent independence of reactivity on surface area, and uneven surface gasification, we offer the interpretation that catalysis by inorganic impurities is important to the gasification of the subbituminous coal chars. The significance of the result in figure 3.16 is, then, that the rate of catalyzed gasification can be apparently unrelated to microporous surface area, presumably depending instead on properties of
the catalyst. Since many chars from naturally occurring organic material may be expected to contain catalytically active inorganic
impurities, it is not surprising that previous studies have found
an inadequate correlation between gasification reactivity and internal surface area(D2,7,15,17).
D4. The Phenomenon of Gasification-Induced Carbon Particle
Shrinkage and Its Influence on Pore Structure Evolution
Dave Dudek, in a parallel study at M.I.T., has observed significant diameter reduction during kinetically controlled air-oxidation of single electrostatically levitated Spherocarb carbon particles(D9), as seen in figure 4.2. Spherocarb particles did not shrink upon heating in nitrogen under otherwise identical conditions. Possible explanations for the diameter reduction phenomenon are perimeter fragmentation, the presence of a significant reaction component on the external surface of the particle, and reaction induced homogeneous particle shrinkage. It was undertaken in this study to investigate the diameter reduction phenomenon and its implications, especially those relating to carbon gasification reactivity.
D4.1 Results.
A technique was developed with which individual features on the external surface of individual particles can be observed by S.E.M. as a function of gasification conversion, in order to distinguish between the possible interpretations of the diameter reduction phenomenon.
In table 4.1 are presented particle diameters (d/do) for various chars at different stages of conversion, measured from photographs
)
o
0.9
a
0.8
E0.7
o
0.6
r
0.5
O -r-i 4-0.4
LCL
0.3
a)
"-
0.2
nc
0
10
20
30
40
50
60
70
80
90
100
%
Conversion in Air
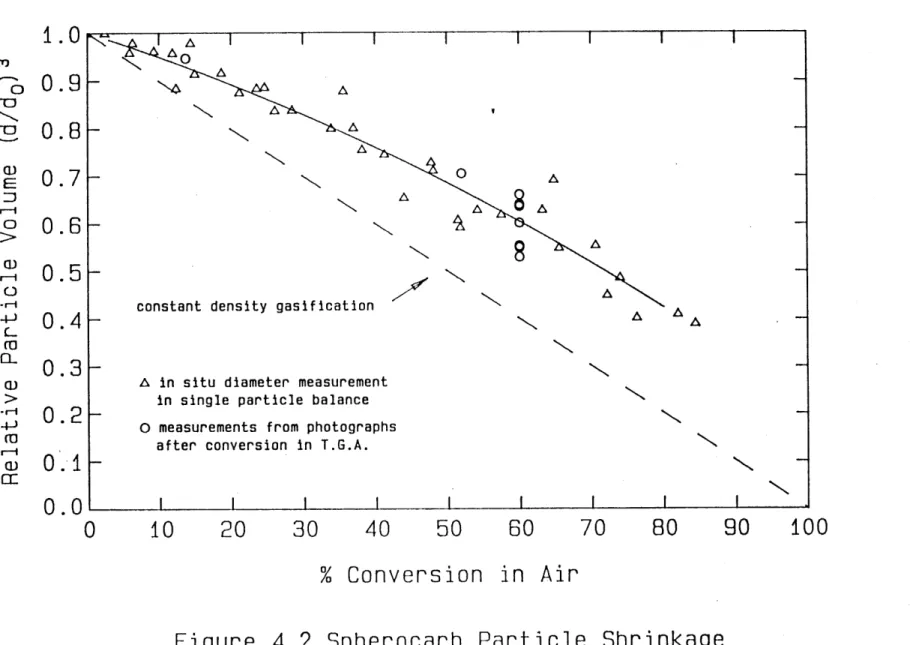
Figure 4.2 Spherocarb Particle Shrinkage
A-N
A in situ diameter measurement
in single particle balance
-O measurements from photographs
after conversion in T.G.A.
-,,
n rr I -rt I
---`~ y
using either the captive-particle S.E.M. technique or optical microscopy on single particles partially gasified in a T.G.A..
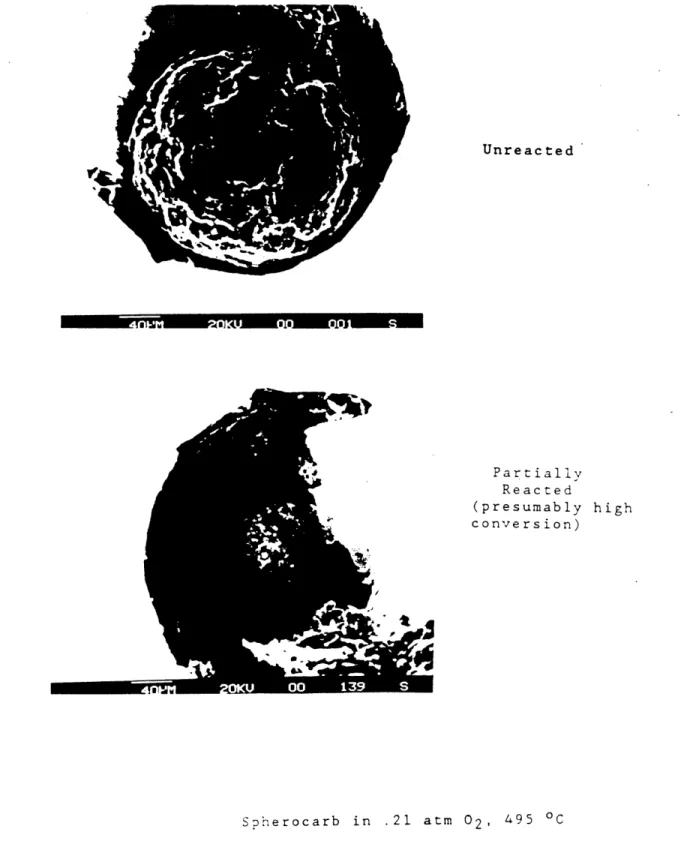
Several sample photographs showing particle shrinkage are given in figure 4.1, while the preservation of even the finest visible surface features during gasification is apparent from the S.E.M. micrographs in figure 3.1.
Table 4.1
Extent of diameter reduction during gasification of various carbons and chars
Carbon Reaction Conditions Conversion d/do Spherocarb .21 atm. 02, 495 OC (163 min) . 60% .821
.871 .809 .844 52% .890 13.7% .982 .21 atm. 02, 450 OC . . ... 60% .860 .21 atm. 02, 600 OC . ... . . . 60% .862 .819 .5 atm. CO/.5 atm. C02, 990 oC . 60% .862 1 atm. N2, 4950C, 163 min . 0% 1.0 latm. N2, 960 OC, 60 min . .... 0% .983 Sucrose char .21 atm. 02, 495 OC .... . . . 60% .882 .863 .921 20% .990 Sucrose with carbon black . . . . . . . . . . . . . . . . ..51.5% .989
71.2%
.886
Pitt. #8 char . . . . . ..61% 1.0.98
.94 Calcium-doped sucrose .21 atm. 02, 370 oC . ... 70% 1.0 Montana lignite char . ... . 44% 1.0.971
85%
.575
.646Most but not all of the carbons exhibited significant shrinkage, with Spherocarb carbon exhibiting the most pronounced shrinkage. Char
Unreacted
V4
Partially Reacted (presumably conversion) high SDherocarb in .21 atm 02, 495 OCFigure 4.1 Photographs and S.E.M. Micrographs
Unreacted 60% Conversion
d = 198 p d - 167 p
Unreacted 60% Conversion
Spherocarb in .21 atm. 02, 495 OC
Set of optical photographs at increasing magnification
Unreacted 44% Conversion 85% Conversion Montana lignite char in air 370 OC
from a Montana lignite coal shrank very little if at all up to 44% conversion, but markedly at 85%.
Figure 4.2 is a compilation of d/do vs. conversion measurements for Spherocarb carbon from table 4.1 and from Dudek's single particle electrodynamic balance technique(D9). Diameter reduction becomes quite pronounced at high conversions, although always lying above the curve representing constant density gasification.
Measurements of the dimensions of various surface features of Spherocarb particles, which were, after 52% or 60% conversion, clearly identified as surface features originally photographed at 0%, were made from various photographs and S.E.M. micrographs. All surface features, both pores and solid regions, shrank, and in the same proportion as the particle diameter. These data form the basis for the information plotted in figure 4.3.
D4.2 Discussion.
D4.21 Homogeneous shrinkage. During the kinetically controlled gasification of high surface area carbons, an insignificant fraction of the gasification can be expected to occur on the external surface proper of the particle. This fact is illustrated for 200 pm diameter Spherocarb carbon particles by comparing the numerical values of the external, macropore (diameter > 200A), and total surface areas:
External area, 4xR2particle: .03 m2/gm Macropore area(D18): 5 m2/gm
Total carbon dioxide surface area: 636 m2/gm
Solid region behavior . Iý: - 1
-1.2
1.0
0.8
0.6
0.4
0.2
0.0
CoC
C-c( 4-J (J E o -r-1 4J C-U) C: aU -CZ Cf) (growth)0.0
0.1
0.2 0.3
0.4
0.5
0.6
0.7 0.8
0.9
1.0
Initial Feature Dimension/Initial Particle Diameter
Figure 4.3
of Spherocarb Surface
Homogeneous shrinkage behavior
External surface reaction behavior Measured surface feature dimensions
o Pores n Solid regions
-0.2
-0.4
-0.6
-0.8
-1.0
Pore behaviorI
·
·
_ ~·
·
_
_
_
-- oShrinkage
Features
function of particle size, which is a classical indication of complete reactant penetration and the absence of a significant reaction component on the particle's external surface. Further evidence that Spherocarb gasification at temperatures below 600 oC in air is, in fact, kineticaly controlled, and even occurs fully within the micropores is summarized in section 3. Indeed, the photographs and
S.E.M. micrographs provide direct evidence that no significant gasification occurs on the external surface, but rather that surface features are preserved and undergo a homogeneous shrinkage during gasification.
The homogeneous shrinkage of topographic features is illustrated in figure 4.3, where measured surface feature dimensions are compared to the behavior expected during homogeneous shrinkage and to the behavior expected in the presence of a reaction component on the
external surface proper.
D4.22 Gasification-induced carbon densification. The observation of pronounced particle diameter reduction during gasification in the
intrinsic kinetic regime, with preservation yet homogeneous shrinkage
of topographical features, indicates the presence of a gasification-induced solid phase densification phenomenon. Note that the carbon particles densify with respect to those participating in a hypothetical reaction at constant diameter. Density is simultaneously increased by densification and decreased by gasification of carbon atoms, the net effect on density being a function of the specific relationship between diameter and conversion.
rearrangements producing loss of pore volume in fine pores. At the length scale of the larger pores in a carbon particle, then, the optically homogeneous "microporous solid" appears to undergo a densification/shrinkage, the larger pores shrinking also, acting as holes in a homogeneously shrinking matrix.
To understand the densification phenomenon, consider that carbons are composed of small and imperfect graphitic carbon layers, whose irregular packing arrangement is responsible for carbon micropores. Since the thermodynamically preferred form of carbon is crystalline graphite, which is non-microporous, it is only energy barriers associated with solid state rearrangements that trap the imperfect layer-packing and the resulting microporosity.
Atomic rearrangements that lead to surface area loss can occur in an inert environment at temperatures as low as 1000 oC(D19) and can be thought of as the initial stage of graphitization. The solid state rearrangements accompanying gasification of Spherocarb and other carbons in this study are reaction induced and occur at temperatures at least as low as 450 OC. It is believed that the gasification reaction, by breaking bonds, removing cross links, and removing carbon atoms, "loosens" entanglements, and increases the driving force for, and facilitates densification via rearrangements analogous to those occurring spontaneously at somewhat higher temperatures in the initial stages of graphitization.
Amorphous solid densification is also seen in germanium and glasses(D20), and it is especially noteworthy that Kaae(D21) has observed densification during neutron irradiation of a glassy carbon at
1100 OC, under conditions where no densification occurred during heating in the absence of the neutron beam.
D4.23 Implications. The phenomenon of gasification-induced carbon densification makes measurements of particle size or density unreliable tests for determining the fraction of the gasification occurring on the external surface of the particle. In addition, by reducing internal porosity during gasification, the phenomenon should be an important factor determining the fragmentation behavior of carbon particles, which is a topic of much current interest in gasification research. Finally, shrinkage is important in pore structure evolution and surface area evolution during gasification or activation and will affect gasification rates and activated carbon adsorptive properties. The reduction of surface area and reactivity would be most pronounced at high conversion, potentially contributing to the difficulty in achieving high carbon conversions in some gasification processes. This topic is explored at length in the following section.
D4.3 Modeling of surface area evolution
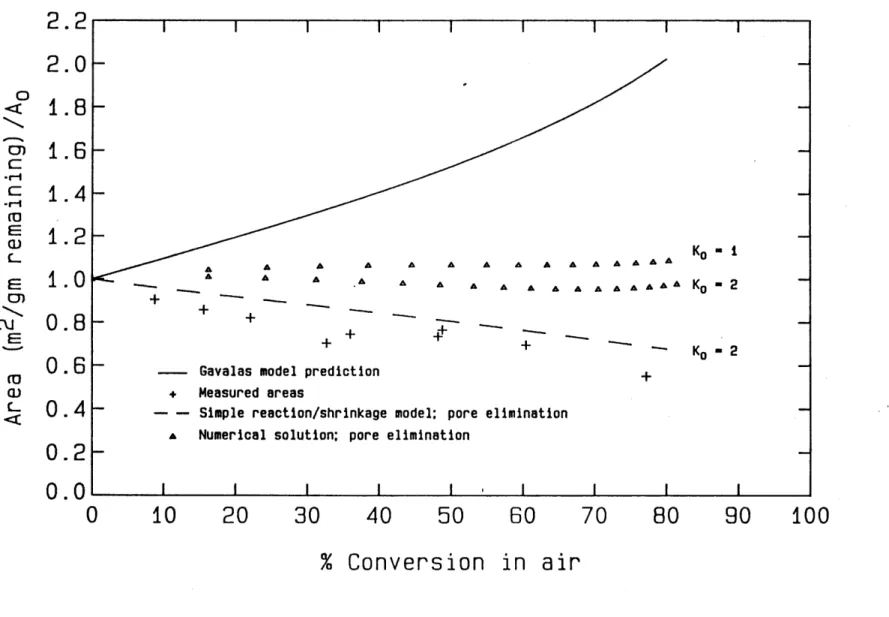
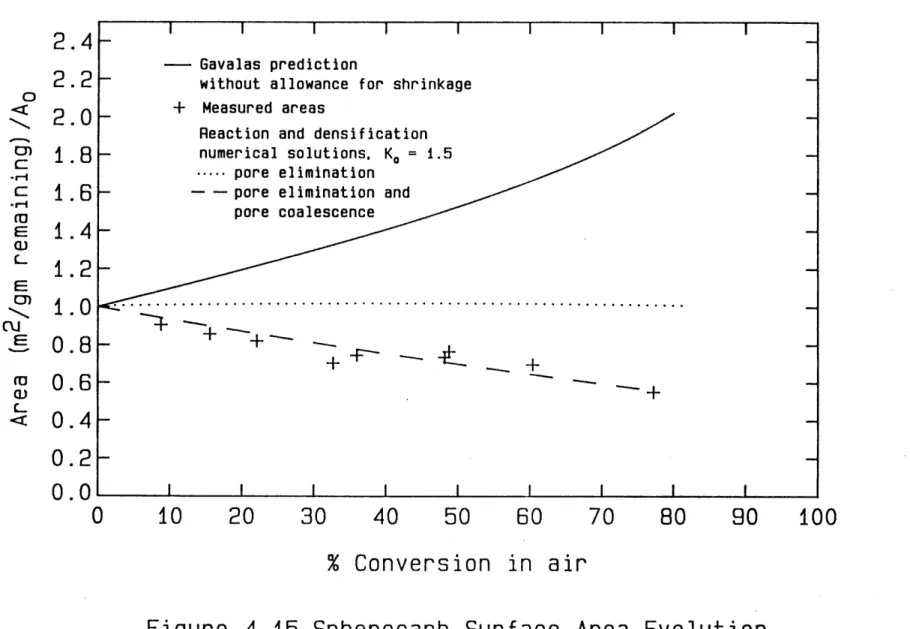
D4.31 The Gavalas Random Pore Model. Gavalas(D22) has derived an exact analytical solution with no empirical parameters for the evolution of the pore size distribution and total surface area during carbon gasification (without allowance for densification) for an arbitrary initial pore size distribution, assuming randomly distributed, infinite cylindrical pores, with no initial closed porosity. We undertook here to compare, for the first time, measured surface areas with the exact Gavalas solution requiring as input the complete measured pore size
distribution, available to us courtesy of Niksa(D18). The prediction of the Gavalas random pore model for Spherocarb surface area evolution is compared in figure 4.11 to measured surface areas calculated from carbon dioxide adsorption isotherms measured gravimetrically in Dudek's single particle electrodynamic balance. The discrepency between the data and the model without allowance for densification/shrinkage is striking. In fact, the measured areas decrease when normalized by the mass of carbon remaining, whereas both the Gavalas and the Simons random pore models, which do not consider reaction induced shrinkage, predict monotonically increasing areas per remaining mass for the kinetically limited gasification of all carbons (i.e. regardless of the initial pore structure of the carbon).
D4.32 Modeling of gasification with concurrent shrinkage.
Surface
area development during gasification with concurrent shrinkage can be treated as the sum of two terms as follows:dA/dX - (6A/SX)d + (6A/6d)x(dd/dX)
The first term on the right-hand side represents the evolution of surface area during gasification at constant diameter and is dealt with by existing models. The second term contains the change in diameter with respect to conversion, which can be obtained directly from measurements, and the change in area with respect to diameter at
constant mass, which requires the development described in the next paragraph.
D4.33 Reaction and densification: simple model. During shrinkage at constant mass, the total porosity is a unique function of the initial porosity and the extent of shrinkage. We postulated that there are
2.4
2.2
0~
2.0
01 1.8 *-c:
1.6
-rIE
1.4
L1.2
E-1
1.0
CMIE
0.8
(0
0.6
-
0.4
0.2
0
n
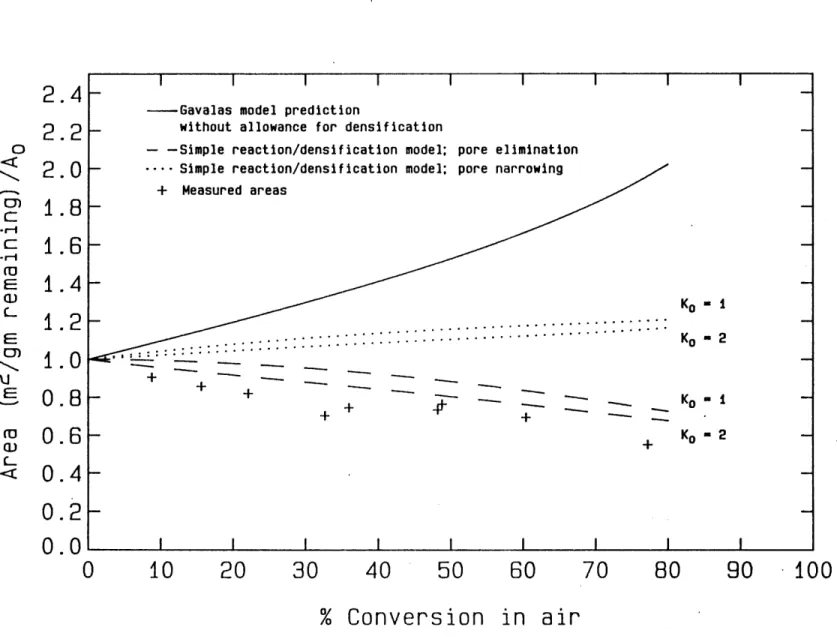
I I I I I I I I I- Gavalas model prediction
without allowance for densification
- -Simple reaction/densification model; pore elimination
- .... Simple reaction/densification model; pore narrowing
+ Measured areas K- -... ... ... Ko 2 + K+ -+ Ko 2 -I I I I I I I
0
10
20
30
40
50
60
70
80
90
100
% Conversion in air
Figure 4.11 Spherocarb Surface Area Evolution
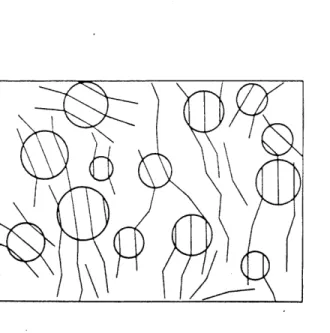
two distinct classes of pores, smaller pores in which the solid state rearrangements occur and larger pores which shrink homogeneously as holes in a shrinking microporous solid. The characteristic of homogeneous shrinkage is that the large pore diameters shrink in the same proportion as the particle diameter, from which it could be shown that the large pore porosity is constant during shrinkage at constant mass. The small pore porosity was obtained as the difference between the total and large pore porosities. The effect on surface area was modeled by considering the atomic rearangements to be a combination of
elimination and narrowing of cylindrical pores.
The prediction of the constant volume Gavalas model was coupled to the results of the shrinkage at constant mass formulation above to generate a simple analytical model of gasification with concurrent shrinkage whose prediction can be seen in figure 4.11. The parameter Ko, which is a property of the initial pore structure of the carbon, has a rather weak influence on the predicted area development, whereas the chosen model of the rearrangement process (pore elimination vs. pore narrowing) is quite important. In all cases, however, the shrinkage term has an important influence on the predicted area development.
D4.34 Exact numerical solution of gasification with concurrent shrinkage. The approach was to treat both reaction and shrinkage by altering Gavalas' pore-axis probability density function throughout conversion and to use relations derived by Gavalas to compute the porosity and total surface area from the altered P.D.F. at any point.