HAL Id: hal-00802738
https://hal.archives-ouvertes.fr/hal-00802738
Submitted on 14 Jan 2021HAL is a multi-disciplinary open access archive for the deposit and dissemination of sci-entific research documents, whether they are pub-lished or not. The documents may come from teaching and research institutions in France or abroad, or from public or private research centers.
L’archive ouverte pluridisciplinaire HAL, est destinée au dépôt et à la diffusion de documents scientifiques de niveau recherche, publiés ou non, émanant des établissements d’enseignement et de recherche français ou étrangers, des laboratoires publics ou privés.
Photoelectron angular distributions from the ionization
of xenon Rydberg states by mid-infrared radiation
Ymkje Huismans, Arnaud Rouzée, Arjan Gijsbertsen, P. S. W. M. Logman,
Franck Lépine, Cécile Cauchy, Sébastien Zamith, A. S. Stodolna, J. Jungman,
J. M. Bakker, et al.
To cite this version:
Ymkje Huismans, Arnaud Rouzée, Arjan Gijsbertsen, P. S. W. M. Logman, Franck Lépine, et al.. Photoelectron angular distributions from the ionization of xenon Rydberg states by mid-infrared ra-diation. Physical Review A, American Physical Society, 2013, 87 (3), pp.033413. �10.1103/Phys-RevA.87.033413�. �hal-00802738�
This is the accepted manuscript made available via CHORUS. The article has been
published as:
Photoelectron angular distributions from the ionization of
xenon Rydberg states by midinfrared radiation
Y. Huismans, A. Rouzée, A. Gijsbertsen, P. S. W. M. Logman, F. Lépine, C. Cauchy, S.
Zamith, A. S. Stodolna, J. H. Jungmann, J. M. Bakker, G. Berden, B. Redlich, A. F. G. van
der Meer, K. J. Schafer, and M. J. J. Vrakking
Phys. Rev. A 87, 033413 — Published 19 March 2013
Photoelectron angular distributions from the ionization of xenon
Rydberg states by mid-infrared radiation
Y. Huismans1, A. Rouzée1,2, A. Gijsbertsen1, P. S. W. M. Logman1, F. Lépine3, C. Cauchy3, S. Zamith4, A. S. Stodolna1, J. H. Jungmann1, J. M. Bakker5, G. Berden5, B. Redlich5, A.F.G. van der Meer5, K.J.
Schafer6 and M. J. J. Vrakking1,2
1
FOM-Institute AMOLF, Science Park 1t13, 1098 XG Amsterdam, The Netherlands
2
Max-Born-Institut, Max Born Straße 2A,D-12489 Berlin, Germany
3
Université Lyon I, CNRS, LASIM, UMR 5579, Bât. Kastler, 43, Boulevard du 11 Novembre 1918, F69622 Villeurbanne Cedex, France.
4
Laboratoire Collisions, Agrégats, Réactivité, IRSAMC, UPS, Université de Toulouse and UMR 5589 CNRS, 31062 Toulouse, France
5
FOM-Institute for Plasma Physics Rijnhuizen, Edisonbaan 14, 3439 MN Nieuwegein, The Netherlands
6
Department of Physics and Astronomy, Louisiana State University, Baton Rouge, Louisiana 70803-4001, USA
Abstract
Angle-resolved photoelectron spectra, resulting from the strong field ionization of atoms or molecules, carry a rich amount of information on ionization pathways, electron dynamics and the target structure. We have investigated angle-resolved photoelectron spectra arising from the non-resonant ionization of xenon Rydberg atoms in the multi-photon regime, using intense mid-infrared radiation from a Free Electron Laser. The experimental data reveal a rich oscillatory structure in the low-order above threshold ionization (ATI) region. By performing quantum mechanical and semi-classical calculations, the observed oscillations could be well reproduced and explained by both a multi-photon absorption picture as by a model invoking electron wave-packet interferences. Furthermore, we demonstrate that the shape and orientation of the initial Rydberg state leaves its own fingerprint on the final angular distribution.
Introduction
Strong field ionization of atoms or molecules can be well characterized by measuring the ejected photoelectrons. In conventional photoelectron spectra, information on the ionization dynamics and the target structure is encoded in the form of the electron yield versus the kinetic energy. This has revealed many features of the ionization process, like its non-linear character 1, the maximum energy transfer to the electron of two times the ponderomotive energy (2Up) 2, the
existence of Freeman resonances 3 and many other processes. The angular dependence of the ejected photoelectrons is known to carry additional details about the ionization dynamics and the target system. Examples are the signature of the molecular orbital in electron diffraction 4, the encoding of temporal and spatial information of both ion and electron by means of photoelectron holography 5 and the influence of the Coulomb force on low energy electrons 6-8.
Depending on the ionization regime, angular structures are commonly explained in two different ways. The tunnel-ionization regime is quantified by the Keldysh parameter γ = √(IP/2Up) < 1, with ionization potential IP and ponderomotive energy (i.e. the electrons’ average quiver energy) Up = Flaser2/4ωlaser2, with the laser field strength Flaser and the laser frequency ωlaser. In this regime, the field strength is strong enough to sufficiently suppress the Coulomb barrier so to provide a tunnel for the electron to escape. Simultaneously, the laser frequency is low enough to provide a quasi-static barrier during tunneling. As a consequence, ionization happens mainly at the field maxima and the dominant structures observed in the photoelectron spectra are explained as interferences between electron wave-packets emitted at different times within the laser cycle 5, 9-11. In the multi-photon ionization regime (MPI, γ > 1), either the field strength is too low to sufficiently suppress the barrier or the frequency is too high, meaning that the electron does not experience a static barrier. In this case the ionization is viewed as going ‘vertically’, i.e. the electron absorbs a number of photons in order to exceed the ionization threshold. Structures in the photoelectron spectra are consequently described as being due to multi-photon transitions 12, 13, in which the observed dominant angular momentum is interpreted in terms of the addition of the angular momentum of the initial state and the angular momentum of each absorbed photon, according to the dipole selection rules.
An example in which the same structure is explained using these two complementary pictures is the above threshold ionization (ATI) photoelectron spectrum, which is characterized by maxima in the electron yield separated by the energy of one photon. In the multi-photon ionization domain, this structure is explained as the absorption of multiple photons above the ionization threshold. In the tunnel-ionization domain it is explained as the interference of photoelectron wave-packets that are ionized at field maxima separated by one laser cycle from each other. This is an example of two coexisting explanations for the same pattern and shows that the distinction between these two regimes is not as strict as outlined above 14. It is therefore interesting to study photoelectron angular distributions from both perspectives.
In this paper, we have investigated the multi-photon ionization of selected Rydberg states of the xenon atom using mid-infrared radiation between 24 and 31 µm, obtained from the Free Electron Laser for IntraCavity Experiments (FELICE) 15. The observed rich angular distributions in the photoelectron momentum spectra are analyzed using various theoretical models. First, the Time
Dependent Schrödinger Equation (TDSE) was solved, allowing to identify the imprint that different atomic orbitals and their orientations leave on the final angular distribution. Second, the oscillatory structure in the low-order ATI rings was analyzed using a biased random walk model 16, 17 and by performing strong field approximation (SFA) calculations. In the random walk model, each photon absorption leads to an altering of the angular quantum number by
Δ = ±
A
1
, biased towards1
Δ = +
A
18, consistent with a multi-photon absorption picture. By performing SFA calculations we show that the same structures can be explained by photoelectron wave-packet interferences and we identify the origin of the nodes in the ATI rings 19. We note that in a very recent paper by Korneev et al.20, a similar explanation has been given for the observed two photon energy spaced structure at 90 degrees with respect to the laser polarization. Upon combining experimental results with a number of theoretical models we provide an explanation of the measured angular distributions using each of the two complementary pictures. Furthermore, our analysis allows identifying the specific imprint that an atomic orbital and its orientation leave on the final photoelectron angular momentum spectra.Experimental setup & theoretical models
In the experimental setup (Figure 1) high-lying xenon Rydberg states were prepared by a combination of electron impact 21 and a tunable dye laser. Ionization proceeded by the mid-infrared radiation from the FELICE laser 15. The resulting photoelectrons were detected with a velocity map imaging spectrometer (VMI) 22, in which photoelectrons were accelerated by a static electric field towards a two-dimensional (2D) positive sensitive detector consisting of a dual stack of micro-channel plates (MCPs) and a phosphor screen followed by a CCD camera. By using an inversion procedure, the three-dimensional (3D) velocity distributions were retrieved. The presented data are slices through this 3D distribution and are referred to as momentum maps. The extraction of the 3D velocity distribution from the measured 2D projection is only possible when the 3D distribution contains an axis of symmetry in the plane of the position-sensitive detector (see also caption of Figure 1). This is only the case when the initial state populated by the dye laser has mℓ=0. Upon populating states with |mℓ| = 1, or higher, the cylindrical symmetry is lost. Therefore, such data are only presented in this paper by their 2D projection, as indicated in the corresponding figure captions.
As described above, two theoretical models were used in the analysis. In the quantum mechanical TDSE-model, the time-dependent Schrödinger equation was solved on a 3D grid using the single active electron (SAE) approximation. A mixed gauge approach was used, with the length gauge close to the core and the velocity gauge far away from the core. The switching of gauges
happened outside the initial Rydberg orbital. The laser pulse envelope was chosen to be a sine-squared shape. A more detailed description of this method can be found in23-26. To analyze electron wave-packet interferences a standard SFA model 27 was used. In the SFA, an expression for the ionization amplitude is obtained by solving the time-dependent Schrödinger equation with the approximation that in the continuum the photoelectron only experiences the laser field and therefore the Coulomb force can be neglected. SFA calculations were performed using a saddle-point method in order to determine the most relevant ionization times 27.
Analysis of xenon 10s ionization
Figure 2 shows the evolution of the photoelectron angular distribution as a function of the laser wavelength, recorded after ionization of xenon atoms that were prepared in the 10s[3/2]2 state. The top figure of each panel shows the experimental momentum maps. As expected, the dominant ionization is along the laser polarization axis of the ionizing laser, i.e. the z-axis. Also, all of the electron momentum distributions show a clear ring structure that corresponds to ATI and which is highly structured. Upon increasing the wavelength (i.e. decreasing the photon-energy) the ATI rings move inward. In order to decipher the observed angular distribution of the ejected photoelectrons, the experimental data are compared to focal volume averaged 28 TDSE calculations solved for a maximum value of the vector potential Amax = 0.12 a.u. and a total pulse duration of 16 cycles i.e., about 6 cycles full-width-at-half-maximum (FWHM). These values of the vector potential and the pulse duration provided the best agreement between the calculations and the experiment, as shown in Figure 2, where the TDSE calculations are displayed below each experimental result. This judgment was based on a comparison between the experimental and calculated angle-integrated photoelectron spectra, where the slope and the high-energy cut-off of the spectra, as well as the modulation depth in the ATI structures could be compared, and by comparison of the angular distributions of the first ATI rings. The pulse duration of 6 cycles FWHM does not really agree with the values estimated from the experiment: from the acquired wavelength spectra of the FELICE pulses, a rough estimation of a 1-2 ps pulse duration (i.e. approximately 20 cycles FWHM) was obtained. This discrepancy is most likely due to the fact that the FELICE micro-pulses have a pulse envelope that differs substantially from the sine-squared shape that was used in the TDSE calculation. More importantly, as measured with a power meter, the micro-pulse energies varied between 0.5 and 1.3 mJ, leading to values for the maximum vector potential ranging between Amax = 0.4 and 1 a.u., for a beam waist at the focal spot of about 0.7 mm. This is much higher than the maximum value used in the calculations, suggesting that the ionization is strongly saturated. This was experimentally confirmed by the fact that the spectra did not show any changes upon lowering
the intensity. Saturation was also confirmed by our TDSE calculations, however, according to these calculations saturation is expected to set in only for higher values of Amax. The latter discrepancy could be a result of the different time structures used in the experiment and in the calculations. Despite these uncertainties, the TDSE calculations do show reasonable agreement with the experimental results: a dominant contribution along the laser polarization is observed, together with highly-structured ATI rings, where the number of nodes usually agrees with the experimental data. The positions of the ATI peaks differ slightly in the experiments and in the calculations (ΔE ≈ 0.01 eV), due to the static electric field produced by the VMI extraction region in the experiment.
Previous work on ionization of Xenon atoms with mid-infrared radiation revealed holographic structures in the photoelectron angular distribution 5, 10, 29, 30. As investigated, the condition for observing the holographic structures is Up/ω >> 1 (in atomic units) 5, 29. In present work the value is Up/ω ~ 2 for peak values of the vector potential (A = 0.12 a.u.) and lower in the outer ranges of the laser spot. Consequently the calculations and experimental data are in the transition regime in which holographic structures may or may not be observed. In the TDSE calculations some holographic structures are visible, in the experimental data no pronounced holographic structures are observed. These and other differences, like the higher contrast in the TDSE calculation for the ATI rings and their substructures, are mainly attributed to the time structure of the FELICE micro-pulses, as argued before.
A more detailed comparison of the angular distributions of the first and second ATI rings is given in Figure 3, where the experimental data, the TDSE calculations and SFA calculations are compared. An attractive feature of the SFA calculation is that it allows turning on/off specific ionization events, and therefore allows establishing the origin of interference structures that are observed in the experimental and TDSE results, as will be discussed later (see also Figure 4).
As Figure 3 shows, the oscillatory structure in the low-order ATI rings changes parity for each subsequent ATI ring as observed for example at 26 µm, where at 90 degrees there is a minimum in ring 1, and a maximum in ring 2. Though the TDSE calculations in general show sharper oscillations, the number and position of the oscillations agree to a large extent. In previous experiments on multi-photon ionization with 800 nm laser light, the number of nodes in the ATI rings was directly related to the angular momentum of the ground or resonance state plus the number of photons absorbed 12, 13. This is understood as follows: each time a photon is absorbed the dipole selection rules apply and a transition to a
Δ = ±
A
1
state is made, with a bias towardsΔ = +
A
1
. The bias is in reality is often the case, as explained by Fano 18. If for example an electron starts out in an ℓ = 1 state, upon absorbing three photons it can end up in a superposition of ℓ = 0, 2 and 4. A dominance of angular momentum ℓ = 4 will lead to 4 minima over a 180 degrees angular range. Thisfurthermore implies that a minimum or maximum at 90 degrees with respect to the polarization axis indicates whether the final angular momentum is a superposition of respectively odd or even angular momenta.
Following this line of reasoning, one can apply a biased random walk model 16, 17 to predict the number of observed maxima in the angular distributions. Chen et al.17 and Arbó et al.16 obtained a good fit to their low energy electron angular distribution using a ratio of 0.3325:0.6675 for transitions according to
Δ = −
A
1
andΔ = +
A
1
, respectively. We applied the model in the same manner as Chen et al. The observed angular momentum was retrieved from the angular distributions by counting the number of minima over a 180 degrees angular range (see Table 1). Good agreement is achieved for a ratio of 0.115:0.885 for theΔ = −
A
1
:Δ = +
A
1
transition probabilities. There is no reason to assume that the obtained ratio should match the one obtained by Chen et al. and Arbó et al. exactly, since the bias between theΔ = −
A
1
andΔ = +
A
1
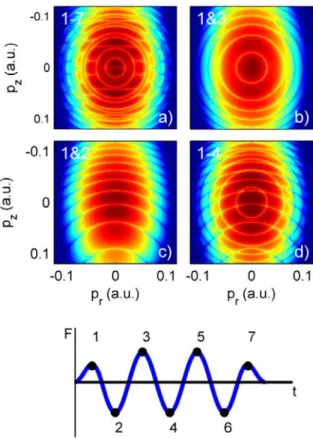
transitions depends in a non-trivial way on the quantum numbers n and ℓ 31 which are very different in our case.So far, we have explained the angular distribution of the ejected photoelectrons using a multi-photon picture, with the number of nodes related to the angular momentum changes that occur each time a photon is absorbed. A similar nodal structure in the angular distributions can be obtained using a wave-packet interference picture 20. This is demonstrated in Figure 4a, which shows the result of an SFA calculation for the ionization of the xenon 10s state with 29 µm light at an intensity of 1·108 W/cm2. The calculation was done for a three-and-a-half cycle laser pulse with a half cycle turn-on and turn-off. A nodal structure in each ATI ring is observed, with alternating parity for each subsequent ATI ring. This agrees with what was found in the experimental data and TDSE calculations shown in Figure 2 and 3, and with what was predicted by the random walk model (Table 1). As described above, the ATI structure can be explained as an interference of trajectories ionized at subsequent maxima of the laser field, separated by a full laser cycle. The trajectories they follow are identical, but the first ionized electron feels one more oscillation. This interpretation of the ATI structure is confirmed by the calculation shown in Figure 4b, in which only trajectories from the first half and the third half cycle are included. The interference between these two electron wave-packets indeed leads to an ATI structure, with peaks in the photoelectron kinetic energy distribution separated by the energy of a single photon. We have verified that the addition of trajectories from the second and fourth maxima similarly leads to an ATI pattern. The rings that characterize the ATI pattern do not, however, have a pronounced angular dependence (Figure 4b). The nodal structure that we observed experimentally in the low-order ATI peaks comes from a different type of wave-packet interference, namely the interference of wave-wave-packets ionized at the opposite maxima of the
laser field during the same cycle. This is demonstrated by Figure 4c where the trajectories from the first and second field maxima are added. The presented analysis is in line with recent work by Korneev et al 20, who analytically explained that the interference of the trajectories from the first and second field maxima leads to the 2ħω separated oscillation at 90 degrees angle. In Figure 4d all trajectories from two laser cycles are taken into account in the SFA calculation, which is the minimum number of trajectories for the ATI with nodal structure to appear. A detailed comparison of the SFA with the TDSE calculations and the experimental data is shown in Figure 3. Though the parity is always correct, the number of nodes is generally underestimated in SFA. This underestimation has been investigated in reference 17 , where it is shown that upon removing the long range Coulomb tail in TDSE, the nodal structure of the TDSE calculation is identical to the SFA structure, implying that the long range Coulomb force is crucial in determining the correct number of nodes.
In conclusion, our discussion demonstrates that the observed structures in low-order ATI can be explained both by a multi-photon absorption process, as well as by a description in terms of wave-packet interferences. For the latter, the long range Coulomb force is crucial for a correct prediction of the number of nodes. This is similar to the fact that in the multi-photon absorption process a bias towards
Δ = +
A
1
, which depends on the Coulomb potential18 , is essential.Analysis of xenon s, p, d and f state ionization
In our experiment, we have also investigated the influence of different initial atomic orbitals and their orientations on the final photoelectron angular distribution. In Figure 5, raw experimental data are compared for the ionization of selected xenon s, p, d and f-states. A progressive widening of the central lobe (along the laser polarization) is observed when increasing the angular momentum of the initial state. This is further illustrated in Figure 5e, which shows the angular distribution (in the 2D experimental image) at the radius corresponding to the first ATI ring. For the s-state, a narrow contribution is observed along the laser polarization, i. e. at 0 and 180°. For the p-state this contribution is wider and a very small dip appears. For the d-state, one can distinguish a prominent dip along the laser polarization and for the f-state an extra oscillation appears within this dip. In our experiment we have observed that this behavior is general for s, p, d and f-states.
To investigate this observation in more detail, we focus on the 11p[3/2]2 state. In Figure 6 the angle-resolved photoelectron signal resulting from the ionization of the xenon 11p state is shown as a function of wavelength. Since the polarization of the dye laser and the FELICE laser are orthogonal to each other, we expect to populate only the |mℓ| = 1 state 32. This implies, as explained above, that this state is not fully cylindrical symmetric and the resulting 2D distributions cannot be
inverted. Because we expect that by inverting the data only finite errors are introduced in the regions of interest – i.e., the number of oscillations in the rings and the dip at 0 and 180 degrees - the inversion was performed to be able to make a comparison to the TDSE calculations. For a reasonable comparison we have however found it to be necessary to use a superposition of mℓ = 0 and |mℓ| = 1 states with a relative strength of the mℓ = 0 and |mℓ| = 1 contribution corresponding to a statistical ratio of 1:2. A possible explanation for this is the presence of a magnetic field, leading to a Zeeman splitting of the mℓ-states. In our experimental setup, a large magnetic field is produced in the vicinity of the interaction region by the coil of the metastable source. Even though the interaction region is shielded with a μ-metal tube, it is not expected to perfectly screen the magnetic field, especially since there is a substantial hole in the μ-metal to let the gas atoms into the chamber. The Zeeman splitting will lift the degeneracy between the mℓ-states and induce a wave-packet motion between the various mℓ-states, with an oscillation period proportional to the inverse of the energy splitting, ~1/ΔE. Since the electronic state is coupled to the core state of xenon in a jK coupling scheme, mJ is the good quantum number and the projection of mJ on mℓ will lead to a population of the mℓ = 0 state. Without shielding, the residual magnetic field at the interaction region would have been about 2.3·10-4 T, leading to a very small energy splitting of about 2.7·10-8 eV and a corresponding oscillation period on the order of tens of nanoseconds. If only 1% of the magnetic field penetrates, the oscillation period is still on the order of a few μs, comparable to the length of the FELICE macro-pulse, which was a few μs. Hence it is conceivable that in our experiment a mixture of mℓ = 0 and |mℓ| = 1 states play a role.
Using a statistical mixture of mℓ-states, the TDSE calculations and the experimental data show a similar widening of the central lobe, and highly structured ATI rings with the correct parity for most of the cases. The observed deviations are again attributed to the different time structure in the experiment and in the calculations, as well as to uncertainties about the relative contributions of the mℓ = 0 and |mℓ| = 1 states.
Concerning the previously mentioned holographic structures, note that due to the lower value for the maximum vector potential as compared to the 10s state, the value for Up/ω ~ 1. Consequently no clear holographic structures are expected. Indeed no pronounced holographic structures are observed in the experimental data or in the theoretical calculations.
In the experimental data, for a wavelength of 24.2 μm, a rather remarkable radial structure is observed within the first ATI ring, which is not accurately reproduced by the TDSE calculations. We have observed this in other experimental data (not shown), accompanied by a smooth angular distribution. The precise nature of this structure is currently not well understood. Upon ionizing rare gas atoms from their ground state, radial sub-structures have been previously observed 12, 13, 33. They
are formed when the ionization passes through a set of high lying resonant states, called Freeman resonances 3. However, in our case the sub-structure only occurs below the first ATI ring, which is not the expected behavior for a Freeman resonance. Other well-known special phenomena that may occur in the threshold region in an ATI experiment are highly oscillatory angular patterns that correlate with channel closing/opening 7, 34. This pattern however occurs in the angular domain without any remarkable accompanying behaviour in the radial domain. Further investigations are needed in order to understand this special and unresolved phenomenon.
With the TDSE calculations, it is possible to disentangle the contributions from the mℓ = 0 and |mℓ| = 1 state, as shown in Figure 7. In Figure 7a and b, TDSE calculations for respectively mℓ = 0 and |mℓ| =1 are shown for λlaser = 26 µm and Ilaser = 1·108 W/cm2. Two major differences are observed. First, the contribution along the laser polarization axis shows a dip for |mℓ| = 1, which explains the observed small dip in the main-lobe of the measured 11p state. The TDSE calculations show that without contribution from mℓ = 0 this dip would have been even larger. The origin of this dip can be explained in two ways and relates to the orientation of the atomic orbitals. For ℓ = 1, |mℓ| = 1 the orientation of the atomic orbital is such that there is no contribution along the laser polarization axis, as shown in the cartoon in Figure 7. Since the quantum number mℓ is conserved in the ionization, no photoelectron signal is expected along the z-axis. The same feature can also be explained by the fact that the ionization from the positive and negative halves of the orbital (cartoon Figure 7) destructively interfere along the z-axis. According to the TDSE calculations, an even wider region along the laser polarization is suppressed for the |mℓ|= 2 projection of the d-orbital, explaining its even larger dip as observed in Figure 5.
The second observation is that the nodal structures of the ATI rings have opposite parity for mℓ = 0 and |mℓ| = 1. According to the cartoon in Figure 7, the mℓ = 0 orbital is aligned along the laser polarization and consequently has an electron distribution with opposite parity along the laser polarization. This induces a π-shift between the phase of the electron wave-packets that are ionized in opposite directions along the laser polarization during successive half cycles, as indicated by the blue and red arrows. Due to the different orientation of the |mℓ| = 1 orbital, no asymmetry in the laser polarization direction is present and the π-shift is absent. The π-shift in the mℓ = 0 case leads to an opposite parity with respect to the |mℓ| = 1 case.
Next we analyze the observed angular distribution by applying the random walk model discussed earlier (Table 2). Since the random walk model does not include the mℓ quantum number, a comparison can only be made to TDSE calculations for mℓ = 0 states. Upon using the same ratio for the
Δ = −
A
1
andΔ = +
A
1
transitions as previously used for the xenon 10s state, the predicted and observed angular momentum agree, except for a wavelength of 31.2 μm. In the table, the angularmomentum for the |mℓ| = 1 states are also given. They were obtained from counting the minima in the angular distribution as given by the TDSE calculations. As outlined above, the parity for |mℓ| = 1 is always opposite to mℓ = 0 and more specifically the angular momentum always differs by one.
One can also explain the oscillations in the angular distribution of the ATI by wave-packet interferences. SFA calculations were performed and compared to TDSE calculations. In Figure 7 the result is shown for an ionization potential corresponding to 11p, λlaser = 26 µm and an intensity of Ilaser = 1·108 W/cm2. Since the atomic orbital’s structure is not included in the SFA-calculation no distinction can be made between mℓ = 0 and |mℓ| = 1. The above given explanation for the observed difference in parity for mℓ = 0 and |mℓ| = 1 implies that the parity of the SFA calculation should match the |mℓ| = 1 parity, because in this case all the trajectories are emitted with the same phase. Indeed, the parity of the nodal structures in the ATI ring for the SFA-momentum map corresponds to the parity of the |mℓ| = 1 state of the TDSE-momentum map (Figure 7d). The mℓ = 0 states can be mimicked upon introducing a π-shift for all trajectories emitted in opposite directions, as indicated in Figure 7e, where all ionization times for π-shifted trajectories are marked with a red dot. The result is shown in Figure 7c and indeed it matches the TDSE mℓ = 0 case.
Conclusion
We have measured angle-resolved photoelectron spectra for the ionization of selected xenon Rydberg states in the multi-photon ionization regime. The data show highly structured photoelectron angular distributions. The TDSE calculations show similar patterns with in general a higher contrast, which is attributed to a different pulse structure that existed in the experiment. We have successfully explained the observed nodal structures by two complementary viewpoints, namely in the frequency domain (i.e. by multi-photon absorption) and in the time domain (i.e. by electron wave-packet interferences). For this, respectively, a random walk model and an SFA calculation were applied. For the correct prediction of the number of maxima a bias is required in the random walk model. When analyzing the structures as wave-packet interferences, the inclusion of the long range Coulomb force is essential. The SFA method also allowed us to identify that the interference responsible for the nodal structure in the ATI rings is caused by trajectories that are launched at opposite maxima of the laser field. Upon selecting specific Rydberg states in the experiment, we have furthermore shown that the atomic orbital and its orientation leave a specific imprint on the final photoelectron angular distribution. TDSE calculations gave further insight into the origin of the different imprints.
We can conclude that photoelectron spectra carry a rich amount of information on the ionization process and the target structure. This information can be understood by applying either a
frequency or time domain picture, providing complementary explanations that are not restricted to either the tunneling regime or the multi-photon regime.
Acknowledgement
This work is part of the research program of the "Stichting voor Fundamenteel Onderzoek der Materie (FOM)", which is financially supported by the "Nederlandse organisatie voor Wetenschappelijk Onderzoek (NWO)". K. J. Schafer is supported by National Science Foundation grant no. PHY-0701372 and the Ball Professorship at LSU.
1. P. Agostini, F. Fabre, G. Mainfray, G. Petite and N. K. Rahman, Phys Rev Lett 42 (17), 1127 (1979).
2. H. B. van Linden van den Heuvell and H. G. Muller, In "Multiphoton Processes", Vol. 8 of Cambridge Stdies in Modern Optics. Cambridge University Press, Cambridge, p. 25. (1988). 3. R. R. Freeman, P. H. Bucksbaum, H. Milchberg, S. Darack, D. Schumacher and M. E. Geusic,
Phys Rev Lett 59 (10), 1092-1095 (1987).
4. M. Meckel, D. Comtois, D. Zeidler, A. Staudte, D. Pavičić, H. C. Bandulet, H. Pépin, J. C. Kieffer, R. Dörner, D. M. Villeneuve and P. B. Corkum, Science 320 (5882), 1478-1482 (2008). 5. Y. Huismans, A. Rouzée, A. Gijsbertsen, J. H. Jungmann, A. S. Smolkowska, P. S. W. M.
Logman, F. Lépine, C. Cauchy, S. Zamith, T. Marchenko, J. M. Bakker, G. Berden, B. Redlich, A. F. G. van der Meer, H. G. Muller, W. Vermin, K. J. Schafer, M. Spanner, M. Y. Ivanov, O. Smirnova, D. Bauer, S. V. Popruzhenko and M. J. J. Vrakking, Science 331 (6013), 61-64 (2011).
6. D. G. Arbó, S. Yoshida, E. Persson, K. I. Dimitriou, Burgd, ouml and J. rfer, Phys Rev Lett 96 (14), 143003 (2006).
7. A. Rudenko et al., Journal of Physics B: Atomic, Molecular and Optical Physics 37 (24), L407 (2004).
8. T.-M. Yan, S. V. Popruzhenko, M. J. J. Vrakking and D. Bauer, Phys Rev Lett 105 (25), 253002 (2010).
9. Arbó, D. G., E. Persson and J. Burgdörfer, Phys Rev A 74 (6), 063407 (2006).
10. X.-B. Bian, Y. Huismans, O. Smirnova, K.-J. Yuan, M. J. J. Vrakking and A. D. Bandrauk, Phys Rev A 84 (4), 043420 (2011).
11. F. Lindner, M. G. Schätzel, H. Walther, A. Baltuška, E. Goulielmakis, F. Krausz, D. B. Milošević, D. Bauer, W. Becker and G. G. Paulus, Phys Rev Lett 95 (4), 040401 (2005).
12. M. J. Nandor and et al., Journal of Physics B: Atomic, Molecular and Optical Physics 31 (20), 4617 (1998).
13. R. Wiehle, B. Witzel, H. Helm and E. Cormier, Phys Rev A 67 (6), 063405 (2003). 14. M. Y. Ivanov, M. Spanner and O. Smirnova, J Mod Optic 52 (2-3), 165-184 (2005). 15. J. M. Bakker, V. J. F. Lapoutre, B. Redlich, J. Oomens, B. G. Sartakov, A. Fielicke, G. von
Helden, G. Meijer and A. F. G. Van der Meer, Journal of Chemical Physics 132 (7) 074305 (2010).
17. Z. Chen, T. Morishita, A.-T. Le, M. Wickenhauser, X. M. Tong and C. D. Lin, Phys Rev A 74 (5), 053405 (2006).
18. U. Fano, Phys Rev A 32 (1), 617 (1985).
19. Y. Huismans, Ph.D. thesis, University of Nijmegen, 2012.
20. P. A. Korneev, S. V. Popruzhenko, S. P. Goreslavski, T. M. Yan, D. Bauer, W. Becker, M. Kübel, M. F. Kling, C. Rödel, M. Wünsche and G. G. Paulus, Phys Rev Lett 108 (22), 223601 (2012). 21. A. Kohlhase and S. Kita, Rev. Sci. Instrum. 57 (12), 2925-3139 (1986).
22. A. T. J. B. Eppink and D. H. Parker, Rev.Sci. Instrum. 68 (9), 3477-3484 (1997). 23. K. C. Kulander and T. N. Rescigno, Comput. Phys. Commun. 63, 523 (1991). 24. K. J. Schafer, Comput. Phys. Commun. 63, 427 (1991).
25. K. J. Schafer, in Strong Field Laser Physics, edited by T. Brabec (Springer Science and Business
Media, New York, 2008).
26. K. J. Schafer and K. C. Kulander, Phys Rev A 42 (9), 5794 (1990).
27. W. Becker, F. Grasbon, R. Kopold, D. B. Milošević, G. G. Paulus and H. Walther, in Advances
In Atomic, Molecular, and Optical Physics, edited by B. Bederson and H. Walther (Academic
Press, 2002), Vol. 48, pp. 35-98.
28. J. H. Posthumus, Rep. Prog. Phys. 67 (5), 623 (2004).
29. T. Marchenko, Y. Huismans, K. J. Schafer and M. J. J. Vrakking, Phys Rev A 84 (5), 053427 (2011).
30. Y. Huismans, A. Gijsbertsen, A. S. Smolkowska, J. H. Jungmann, A. Rouzée, P. S. W. M. Logman, F. Lépine, C. Cauchy, S. Zamith, T. Marchenko, J. M. Bakker, G. Berden, B. Redlich, A. F. G. van der Meer, M. Y. Ivanov, T. M. Yan, D. Bauer, O. Smirnova and M. J. J. Vrakking, Phys Rev Lett 109 (1), 013002 (2012).
31. H. A. Bethe and E. E. Salpeter, Quantum Mechonics of One- and Two- Electron Atoms (Springer-Verlag, 1957).
32. J. J. Sakurai, Modern Quantum Mechanics (Addison Wesley, 1994). 33. V. Schyja, T. Lang and H. Helm, Phys Rev A 57 (5), 3692-3697 (1998).
34. T. Marchenko, H. G. Muller, K. J. Schafer and M. J. J. Vrakking, Journal of Physics B: Atomic, Molecular and Optical Physics 43 (9), 095601 (2010).
Figures and Tables
Figure 1: (Color online) Experimental setup. Xenon was injected into the vacuum chamber using a pulsed
valve. In the metastable source 21, a significant fraction of the atoms was promoted into the metastable
5p5(2P3/2)6s[3/2]2 state by means of electron impact. In the interaction region, a tunable dye laser (in red,
denoted with "EDye") excited the metastable xenon atoms to the Rydberg states of interest. Ionization of these
states proceeded by interaction with the FELICE laser (in yellow, denoted with "EFELICE") 15. The photoelectrons
were detected with a velocity map imaging (VMI) spectrometer 22, containing a set of electrodes (R – repeller,
E – extractor, G – ground) and a position-sensitive detector consisting of a dual stack of micro-channel plates (MCPs), a phosphor screen and a CCD-camera. To allow for the three-dimensional (3D) reconstruction of the photoelectron kinetic energy and angular distribution, an axis of cylindrical symmetry of the 3D distribution parallel to the detection plane is required, which was obtained by choosing the polarization of the FELICE laser
parallel to the detector. The polarization of the dye laser was however orthogonal to the FELICE-laser
polarization and the detection plane. Consequently, the prerequisite cylindrical symmetry was only achieved when the dye laser was used to excite fully symmetric atomic orbitals, i.e. s-orbitals. In this case, for the 3D reconstruction an Abel inversion routine based on a Legendre polynomial expansion was used, similar to the
Figure 2: (Color online) Electron momentum distribution recorded after ionization of the xenon 10s[3/2]2 state
as a function of the FEL-wavelength. Each panel shows both the “inverted” experimental data (top) and the results of focal volume-averaged TDSE calculations carried out for a maximum value of the vector potential
Amax = 0.12 a.u. and considering a pulse duration of 16 full laser cycles (bottom). For a detailed discussion
rationalizing these values of the intensity and the pulse duration, the reader is referred to the discussion in the text. The laser polarization direction is along the vertical axis.
Figure 3: (Color online) Angular distributions of the first and second ATI ring observed after ionization of the
xenon 10s[3/2]2 state, as a function of the FEL-wavelength. The presented angular distributions for the
experimental data (yellow/ light gray) and TDSE calculations (green/ gray) are derived from the momentum distributions presented in Figure 2. SFA calculations (blue/ black) were performed for a single intensity of
1·108W/cm2, which is justified by the fact that the focal volume-averaged TDSE calculations show only minor
differences in the angular distribution compared to the single intensity 1·108W/cm2 TDSE calculations. The
y-axis represents the logarithmic signal strength in arbitrary units and the different angular distributions are shifted with respect to each other for clarity. The figures can be quantitatively interpreted by using the fact that relative vertical scales are identical and the signal strengths cover one to two orders of magnitude for
λ (μm) N Obs. L Pred. L 24.2 8 8 8 25.2 9 7/9 7 26.2 9 7 7 27.2 9 7 7 28.2 10 6/8 8 29.2 10 8 8 30.2 10 8 8 31.2 11 9 9
Table 1. Comparison of the observed dominant angular momentum L (Obs. L) in the first ATI ring from
ionization of xenon 10s with the angular momentum L (Pred. L) predicted by the biased random walk model 16,
17
used with relative probabilities of
Δ = −
A
1
versusΔ = +
A
1
transitions of 0.115:0.885. N in the tablerepresents the number of photons that are absorbed by the atom in order to reach the energy of the first ATI ring.
Figure 4. (Color online) SFA calculations for the ionization of xenon 10s using a few-cycle mid-infrared laser
pulse with λlaser = 29 μm and I = 1·108 W/cm2. The flat top pulse used in the calculations is shown in the lower
panel and consists of 3.5 cycles, with a half cycle turn on and off. The electron momentum distribution is obtained for a) a 3.5 cycle flat top laser pulse, b) considering only interference between trajectories from the first and third half cycle of the laser pulse, c) considering only interference between trajectories from the first and second half cycle of the laser pulse d) considering interference of all trajectories (1-4) that start during the first two laser cycles.
Figure 5. (Color online) a-d) raw experimental photoelectron images for the ionization of the 12s[3/2]2,
11p[3/2]2, 11d[7/2]4 and 8f[3/2]2 Rydberg states by 31.2 µm FEL radiation. Because the experiment does not
contain an axis of cylindrical symmetry, the images are not inverted. The laser polarization axis is the vertical
axis. The momentum in the plane of the detector perpendicular to the laser polarization axis is labeled p r’ , and
is distinct from the actual momentum perpendicular to the laser polarization axis pr in the 3D distribution e)
Figure 6. (Color online) Momentum maps resulting from the ionization of xenon 11p[3/2]2 state as a function of
the FEL-wavelength. The top rows in each panel are the inverted experimental data and bottom parts show
focal volume averaged TDSE calculations carried out for a maximum field strength of Amax = 0.10 a.u., a pulse
duration of 16 full laser cycles and a 1:2 mixture of mℓ = 0 and |mℓ| = 1. The laser polarization direction is along
Figure 7. (Color online) Calculated photoelectron momentum maps for the ionization of xenon 11p with 26 µm
radiation and at an intensity of 1·108W/cm2. a) TDSE calculation for mℓ = 0 b) TDSE calculation for |mℓ| = 1 c)
SFA calculation with a π-shift for each positive laser field maximum d) SFA calculation without π-shift. In the bottom two figures the laser field F is plotted; the π-shifted trajectories are marked by red dots and normal
trajectories by black dots. Cartoon: the ionization of p-orbitals with mℓ = 0 and mℓ = 1. The color indicates the
λ (μm) N Obs. L (m = 0) Obs. L (m = 1) Pred. L 24.2 5 6/8 7 6 25.2 6 7 8 7 26.2 6 7 6 7 27.2 6 7/9 6 7 28.2 6 7 6 7 29.2 6 7 6 7 30.2 7 8 7 6/8 31.2 7 10 7 6/8
Table 2. Comparison of the observed dominant angular momentum L (Obs. L) in the first ATI ring from
ionization of xenon 11p with predicted angular momentum L (Pred. L) by the biased random walk model with a
chance for an electron to go to
Δ = −
A
1
versusΔ = +
A
1
of 0.115:0.885. N in the table represents thenumber of photons needed to arrive at the first ATI ring. For 30.2 and 31.2 μm it was not possible to

![Figure 2: (Color online) Electron momentum distribution recorded after ionization of the xenon 10s[3/2] 2 state as a function of the FEL-wavelength](https://thumb-eu.123doks.com/thumbv2/123doknet/14278222.491290/16.918.136.778.151.715/figure-electron-momentum-distribution-recorded-ionization-function-wavelength.webp)
![Figure 3: (Color online) Angular distributions of the first and second ATI ring observed after ionization of the xenon 10s[3/2] 2 state, as a function of the FEL-wavelength](https://thumb-eu.123doks.com/thumbv2/123doknet/14278222.491290/17.918.162.777.169.404/figure-color-angular-distributions-observed-ionization-function-wavelength.webp)

![Figure 5. (Color online) a-d) raw experimental photoelectron images for the ionization of the 12s[3/2] 2 , 11p[3/2] 2 , 11d[7/2] 4 and 8f[3/2] 2 Rydberg states by 31.2 µm FEL radiation](https://thumb-eu.123doks.com/thumbv2/123doknet/14278222.491290/20.918.265.597.123.533/figure-color-online-experimental-photoelectron-ionization-rydberg-radiation.webp)
![Figure 6. (Color online) Momentum maps resulting from the ionization of xenon 11p[3/2] 2 state as a function of the FEL-wavelength](https://thumb-eu.123doks.com/thumbv2/123doknet/14278222.491290/21.918.159.768.146.690/figure-color-online-momentum-resulting-ionization-function-wavelength.webp)


