A Classification of Carbon Footprint
Methods Used by Companies
by
Suzanne L. D. Andrews
M.Sc. Industrial Engineering (Specialty in Quality and Productivity Systems) Instituto Tecnol6gico y de Estudios Superiores de Monterrey, 2006
Submitted to the Engineering Systems Division in Partial Fulfillment of the Requirements for the Degree of
Master of Engineering in Logistics
at the MASSACHUSETTS INSTWE
Massachusetts Institute of Technology
OFTECHNOLOGYJUN 3
0
2009
June 2009
© 2009
LIBRARIES
Suzanne Andrews All rights reserved.
The author hereby grants to MIT permission to reproduce and to distribute publicly paper and electronic covies f this document in whole or in part.
Signature of Author... .
Master of E ering in stics Program, En>eering Sstems Division
A'
7/
,
7
May 27, 2009
Certified by.
Dr. Chris Caplice
Executive Director, Center for Transportation and Logistics-, Thesis Supervisor
Accepted by...
Prof. Yossi Sheffi Professor, Engineering Systems Division Professor, Civil and Environmental Engineering Department Director, Center for Transportation and Logistics Director, Engineering Systems Division
Abstract
The percent increase in greenhouse gas (GHG) concentration in the atmosphere can be harmful to the environment. There is no single preferred method for measuring GHG output. How can a company classify and choose an appropriate method? This thesis offers a classification of current methods used by companies to measure their GHG output.
Acknowledgements
I would first like to thank my Lord and Savior, Jesus Christ, for blessing me with the opportunity
to study at the Massachusetts Institute of Technology, specifically within the Master of
Engineering in Logistics Program (MLOG). I would also like to thank my husband, Laurence
Andrews, and my parents Dr. and Mrs. Dennis Minott for being my support network during my
time here.
Next, I would like to thank Dr. Chris Caplice, Executive Director of MLOG who, in addition to
accepting me into the program, also awarded me an International Logistics Fellowship. Late in
the game, he became my thesis advisor and this thesis has benefited greatly from his advice.
Finally, I would like to thank Dr. William Haas for being my unofficial thesis co-advisor. He
Table of Contents
Abstract ... .. ... . . ... .. ... ... ... ...
2
A cknow ledgem ents ... ... . . ... ... 3
T able of C ontents... ... ... ... .. ... 4
List of Tables ... ... ... . ... 7
List of Figures ... .... ... 8
Chapter 1 Introduction ... ... ... ..
9
1.1 Definition of Terms ... 9
1.2 Global Warming: Constraint or Opportunity?... . . .. . .. . . . .. . . .. . . .. . . . .. . . 11
1.3 Concerns with Carbon Footprint Methods ... ... 13
1.4 M otivation of Thesis ... ... 13
Chapter 2 Literature Review ... ... ... 14
2.1 Carbon Footprint Methods Used by Companies ... 14
2.2 The Emphasis on the Carbon Footprint of Products ... ... 15
2.3 Research Question 1: Concerns about Corporate and Product Carbon Footprint Methods...17
Chapter 3 Methodology ... .. ... ... ... ... 21
Chapter 4 Data Analysis and Results ... 22
4.1 Online Carbon Footprint Calculators ... .... ... 23
4.1.1 Individual/H ousehold ... 23 4.1.2 Industry ... . ... .. 24 4.1.3 Corporate/Office... .. .. ... ... 24 4.2 GHG Protocol Boundaries ... ... 25 4.2.1 Em issions ... ... ... ... 26 4.2.2 Types of Emissions ... ... ... ... ... 27
4.2.3 Nature of Companies and Data Collection...28
4.2.4 Should Scope 3 Emissions be Optional ... 32
4.3 PAS 2050 ... .. ... .. . ... 33
4.3.1 Boundaries ... ... ... .. ... 33
4.4 Research Question 2: Benefits and Costs of the GHG Protocol and PAS 2050...37
4.5 Where the GHG Protocol and the PAS 2050 Overlap ... 40
4.6 Research Question 3: Tradeoffs between the GHG Protocol and PAS 2050...43
Chapter 5 Conclusion ... ... ... ... 44
5.1 Long-term Ramifications of Using Corporate CF Methods ... 44
5.2 Long-term Ramifications of Using Product CF Methods ... ... 46
5.3 The Conundrum Presented by a Tin of Peanuts ... 47
5.4 Other Environmental Effects Apart from Global Warming...48
Appendices - Carbon Footprint Calculators ... ... 55
A Individual/Household... ... 56
B Features of Individual CF Calculators ... ... ...57
C Industry ... ... ... 58
D Corporate/Office ... .. ... ... ... .... ... 58
List of Tables
Table 2.1: Only Cited 'Official' Corporate CF Method ... ... ... 14
Table 2.2: Several Cited Product CF Methods ... ... 15
Table 4.1: Comparison of "Simple Inputs" vs. "Detailed Inputs" ... 23
Table 4.2: Approaches to Gathering Data ... ... .. ... 28
Table 4.3: Benefits and Costs of the GHG Protocol and PAS 2050 ... ... ...39
Table 4.4: BHD GHG Emissions According to the GHG Protocol ... 41
List of Figures
Figure 1.1: Projected Changes in Global Temperature ... .... ... ... 10
Figure 1.2: Global GHG Emission by Gas (2000) ... 11
Figure 2.1: Release Dates of Product CF Methods ... ... ... 16
Figure 2.2: Corporate vs. Product CF M ethods ... .. ... ...17
Figure 4.1: Bringin' Home the Dough ... ... ... 22
Figure 4.2: Organizational and Operational Boundaries of a Company ... 26
Figure 4.3: Overview of Emissions and Scopes across a Supply Chain...27
Figure 4.4: GHG Protocol Classification ... ... 31
Figure 4.5: GHG Emissions across a Supply Chain... ... ... ...32
Figure 4.6: Comparison of Company-by-Company and Supply Chain Analyses... 34
Figure 4.7: B2C and B2B Boundaries ... ... 35
Figure 4.8: PAS 2050 Classification ... ... ... 38
Figure 4.9: A Loaf of BHD Wheat Bread ... . ... ... 36
Figure 4.10: Product Emissions across the Supply Chain ... 37
Figure 4.11: Life Cycle Stages of a Mobile Phone ... ... ... 38
Chapter 1 - Introduction
Global warming and the reduction of carbon dioxide emissions are at the top of the environmental
policy agenda today (Weidema et al., 2008). From an organizational perspective, some of the
trends that have dramatically increased their respective profiles include: science and policy
initiatives that have called for more aggressive action in stabilizing carbon dioxide emissions in
the future; growing public and media interest in the need for alternative and renewable energy for
security and environmental reasons; and increasing concern from financial institutions about the
potential risks that an organization may face in a carbon-concerned future (Bennett, 2007). In
this chapter, I first define what is meant by the terms carbon footprint, greenhouse gases, greenhouse effect and global warming. I then show how global warming, although initially
considered a constraint for companies, is now being viewed as a source of opportunity. In order
to realize this opportunity, companies need to first understand how to measure their carbon
footprints. Given that some concerns exist with these methods, I conclude this chapter by highlighting these concerns and stating the motivation for this thesis.
1.1 Definition of Terms
In the specific context of organizations, The Carbon Trust (2006) defines a carbon footprint as the total amount of greenhouse gas (GHG) emissions for which an organization is responsible. Gases such as carbon dioxide, methane, nitrous oxide and halocarbons are called greenhouse
gases (GHGs). They serve to absorb and reradiate the sun's energy. This phenomenon is
referred to as the greenhouse effect. It serves to keep the earth 330C (60'F) warmer than it would
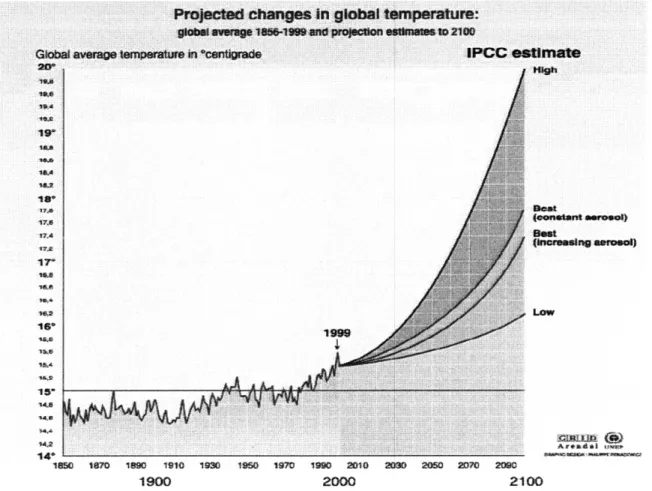
otherwise be. However, as concentrations of these GHGs increase, this warming effect also increases (Pew Center on Global Climate Change). This warming effect is referred to as global
warming. Figure 1.1 shows the projected changes in global temperature using estimates from the
Intergovernmental Panel on Climate Change
(IPCC).
Projected changes
in
global teiperature
globat am"" 1 6-19f anprojecOon eimfe.s to 2100
GobaI averaQ temperature in centigrade IPCC OStimate
17e
Bet
lew 1870 1890 1910 1930 1950 1970 1990 2010 2030 2050 2070 2090
1900 2000 2100
Figure 1.1: Projected Changes in Global Temperature (Source: United Nations Environment Program)
According to Nordhaus (2008), higher concentrations of GHGs lead to increased surface warming
of the land and oceans. Such intense warming is now resulting in climate changes, such as
temperature extremes, storm location and frequency. These changes may have profound impacts
on biological and human activities that are sensitive to climate. Nordhaus (2008) further adds
that global warming is a serious, perhaps even a grave, societal issue. He states that, of all the
greenhouse gases, carbon dioxide represents the largest problem because the burning of fossil (or
levels and greater accumulation in the earth's atmosphere than other greenhouse gases. Figure
1.2
illustrates that carbon dioxide is the most concentrated GHG, as of 2000.
Carbon Difoide: 77%
Mclhane: 4%
HFCs, PFCs, SF: r%
Figure 1.2: Global GHG Emissions by Gas (2000) (Source: World Resources Institute)
Hawken et al. (1999) also offer that scientific analysis of bubbles in the Vostok ice core from
Antarctica show that carbon dioxide in the atmosphere is at the highest level in 420,000 years and
that global temperatures in the next century are expected to exceed a 10,000-year record.
1.2 Global Warming: Constraint or Opportunity?
With these findings of Nordhaus (2008) and Hawken et al. (1999), it is understandable that
discussions of global warming and its effect on organizations have often focused on the downside
of carbon dioxide emissions controls, labeling them as constraints. However, today, that
Greenhouse Gas Protocol Corporate Standard, which provides standards and guidance for
companies and other organizations preparing a greenhouse gas (GHG) emissions inventory, many
businesses, ranging from the automobile to the mining industries are voluntarily participating in
GHG emissions inventories.
The Business Standards Institute (BSI) encourages these businesses to undertake inventories of
their greenhouse gas emissions in order to improve their corporate image and attract capital
investment. Lash and Wellington (2007) also cite the following risks that can be transformed into
opportunities: regulatory, product and technology, litigation, physical and supply chain. As
companies assess their susceptibility to regulations, with supply chain risk, in particular, Lash and
Wellington (2007) recommend that they should evaluate the vulnerability of their suppliers. This
could lead to higher component and energy costs as suppliers pass along increasing
carbon-related costs to their customers.
For example, auto manufacturing relies heavily on suppliers of steel, aluminum, glass, rubber and
plastics, all of which are likely to be seriously affected by emissions regulations, or - as in the
case of aluminum manufacturing, a big consumer of energy - by regulations on their supplier's
supplier. Lash and Wellington (2007) further offer that a company should take into account the
geographical distribution of its supplier network. Executives should be made aware of how many
of their suppliers operate in, say, the European Union, where regulatory structures are already in
place. In addition, executives must be mindful that the other aforementioned risks could affect
not just their companies, but their suppliers as well. Since a company can only manage what it
measures, both Bennett (2007) and Lash and Wellington (2007) urge that any carbon emissions risk management strategy needs to begin with the company measuring its carbon footprint.
1.3 Concerns with Carbon Footprint Methods
In its measurement of the carbon footprint (CF) of an organization, the Greenhouse Gas Protocol
Corporate Standard notes that it establishes organizational boundaries, in terms of equity share
and control and operational boundaries, in terms of processes, products and services. However, authors like Wiedmann and Minx (2007) and Matthews et al. (2008) have raised methodological
concerns about these organizational boundaries. They also question the completeness and
robustness of these measurements. In particular, Matthews et al. (2008) recommend that an
organization should not only measure its own CF, but also the CF that it shares with other
companies within a product's supply chain. They caution that to do otherwise could generally
lead to large underestimates of greenhouse gas emissions for products and services. They further
warn that without a full knowledge of their carbon footprints, companies will be unable to pursue
the most cost-effective mitigation strategies.
1.4 Motivation of Thesis
I am therefore motivated in this thesis to review and classify the methods by which companies
measure their carbon footprints. In Chapter 2, I explore the literature in order to identify these
methods. I then answer the first research question, which is: What are some of the concerns
raised in the literature about these CF methods? In Chapter 3, I discuss the methodology by which I classify these methods. In Chapter 4, I present and discuss the classification of these methods and answer the second and third research questions, which are: What are the benefits and costs of using each method? What are the tradeoffs? In Chapter 5, I conclude this thesis and illustrate some of the long-term ramifications for a company, given the particular CF method that it chooses.
Chapter 2
-
Literature Review
The recent trends discussed in Chapter 1 have been the basis upon which companies are currently
looking for methods that would give them the best indication of their respective carbon footprints.
In this chapter, I review the literature to learn some more about these methods. I then answer the
first research question which is: What are some of the concerns in the literature concerning these
CF methods?
2.1 Carbon Footprint Methods Used by Companies
East (2008) and Wiedmann and Minx (2007) note that the majority of publications that cover the
issue of carbon footprint methods is coming from "grey" (popular) rather than scientific literature.
This was also my observation. I therefore resorted to entering the keywords "company", "carbon
footprint" and "method" into the Google and Google Scholar search engines. The only method
that resulted was the Greenhouse Gas Protocol Corporate Standard (GHG Protocol). In Table
2.1, I list where and how many times this standard was mentioned as the 'official' corporate
carbon footprint method.
Corporate CF Method Source Frequency of
Citation
Greenhouse Gas Protocol 1. SETAC Europe (2008) 7 times (GHG) Corporate Standard 2. Matthew et al. (2008)
3. Lash and Wellington (2007) 4. Bennett (2006)
5. British Standards Institute 6. www.learnaboutcarbon.net 7. www.bestfootforward.com Table 2.1: Only Cited 'Official' Corporate CF Method
I use the word 'official' since authors like Lash and Wellington (2007) have noted that the GHG
Protocol has been taken up by the International Organization of Standardization (ISO) and has
been used by several hundred companies to measure and track their greenhouse gas emissions.
2.2 The Emphasis on the Carbon Footprint of Products
From a supply chain management perspective, finding only one 'official' CF method used by
companies was very surprising. I therefore decided to enter the keywords "supply chain", "carbon footprint" and "method" into the Google and Google Scholar search engines. I also
entered these keywords into ProQuest, which is a database of multiple scientific journals. Several
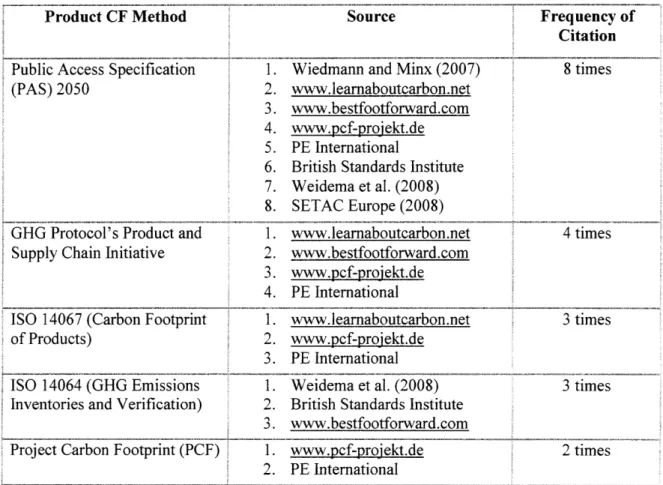
'product' CF methods surfaced. In Table 2.2, I list where and how many times these product CF
methods were mentioned.
Product CF Method Source Frequency of
Citation Public Access Specification 1. Wiedmann and Minx (2007) 8 times (PAS) 2050 2. www.learnaboutcarbon.net
3. www.bestfootforward.com 4. www.pcf-projekt.de
5. PE International
6. British Standards Institute 7. Weidema et al. (2008) 8. SETAC Europe (2008)
GHG Protocol's Product and 1. www.learnaboutcarbon.net 4 times Supply Chain Initiative 2. www.bestfootforward.com
3. www.pcf-projekt.de 4. PE International
ISO 14067 (Carbon Footprint 1. www.learaboutcarbon.net 3 times
of Products) 2. www.pcf-projekt.de
3. PE International
ISO 14064 (GHG Emissions 1. Weidema et al. (2008) 3 times Inventories and Verification) 2. British Standards Institute
3. www.bestfootforward.com
Project Carbon Footprint (PCF) 1. www.pcf-projekt.de 2 times 2. PE International
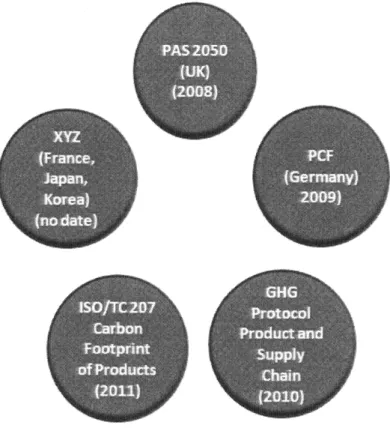
Evidently, there were more methods focused on measuring and reducing greenhouse gas
emissions of particular products, as opposed to companies (East, 2008). What was also
interesting was that, of these product CF methods, only PAS 2050 was currently available, at the
time of writing this thesis (see Figure 2.1).
Figure 2.1: Release Dates of Product CF Methods (Source: PE International)
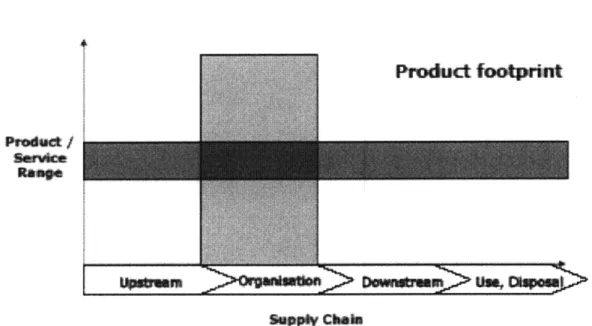
The literature review indicates that companies have been using both the GHG Protocol Corporate
Standard and the PAS 2050 to measure their carbon footprints. The former has been used to
measure the specific footprint of a particular company, while the latter has been used to measure
the carbon footprint of a company, in terms of its contribution to the development of a product
within a supply chain. Figure 2.2 notes the difference between corporate and product carbon
Corporate footprint:
Product footprit
SBpply Chain
Figure 2.2: Corporate vs. Product CF Methods (Source: The Carbon Trust)
2.3 Research Question 1: Concerns about Corporate and Product CF Methods
Finkbeiner (2009), Rich (2008), Matthews et al. (2008), Wiedmann and Minx (2007) and
Johnson (2008) are some of the authors expressing concern about corporate and product CF
methods. Below, I detail some of their concerns:
Scope of Emissions:
Shall all GHGs specified by the IPCC or only the GHG Gases of the Kyoto Protocol be
considered? The Kyoto Protocol is an international agreement linked to the United Nations
Framework Convention on Climate Change. The major feature of the Kyoto Protocol is that
it sets binding targets for 37 industrialized countries and the European community for
Climate Change). How would emissions between multiple suppliers, products and
companies be allocated?
Life Cycle Stages:
While a general understanding is that CF methods consider all stages of a product, from raw
materials to end-of-life, the inclusion of the use phase might be controversial between
business-to-business and business-to-consumer perspectives. If included, how can use phase
profiles be defined in a meaningful way? How would downstream emissions (e.g. product
transport, product use and disposal) be accounted?
System Boundaries:
How would cut-off criteria be specified? How would employee transport be considered?
How would time boundaries be considered, especially for agricultural products?
Offsetting:
Shall offsetting be included in the calculation or not? Offsetting provides a mechanism to
reduce GHG emissions in the most cost-effective and economically-efficient manner
(www.carbonfootprint.com). Is the use of renewable energy a type of offsetting or not?
Data:
Which data sources will be used? What will be the share between primary activity data and
secondary data? PAS 2050 defines primary data as direct measurements made internally or by
someone else in the supply chain about the specific product's life cycle. It also defines secondary
data as the external measurements that are not specific to the product, but rather represent an
average or general measurement of similar processes or materials (e.g. industry reports or
aggregated data from a trade association). Are any operational data quality requirements
possible? How much of the supply chain will be considered? Would actual data from suppliers
versus generic data be collected? What level of accuracy is needed? For multinational
companies, in particular, how would GHG data from suppliers worldwide be collected? How
would the issue of confidentiality be handled where data has to be exchanged between suppliers
and customers? How would consistent data reporting and verification along the supply chain be
ensured?
End-of-life:
How would end-of-life scenarios be defined? This is because some products can be used as
inputs to multiple final products with widely divergent use and disposal characteristics (e.g.
aluminum can be used in drink cans or airplanes).
Carbon Capture and Storage:
How would carbon capture and storage be treated? Carbon capture and storage, or CCS, involves burying the carbon dioxide deep underground (www.economist.com).
Land Use Change:
Shall emissions arising from direct land use change be included or not? Shall changes in soil
Capital Goods:
How will capital goods be treated? Capital goods are goods used for the purpose of producing other goods. They would include items such as industrial buildings, equipment and heavy machinery (www.inverstorglossary.com).
Finkbeiner (2009), SETAC Europe (2008) and Weidema et al. (2008) are concerned that if corporate and CF methods do not address the aforementioned methodological issues,
oversimplification may misguide stakeholders on the environmental implications of companies and their products and thereby lead to counterproductive results for the environment. This, they say, is especially true in the case where the evaluation is limited to a single indicator, such as global warming and disregards other potential environmental impacts such as acidification, summer smog and ozone layer depletion. Nevertheless, they all agree that these carbon footprint methods, despite their limitations, are meaningful ways for mitigating global warming, a major environmental concern. Specifically, Weidema et al. (2008) offer that CF methods, more than any other that has been suggested to reduce global warming, have been able to capture the attention of the public and orient it to product life cycle thinking. As a consequence, an
overwhelming abundance of websites - some even government-sponsored - exist to calculate a person's impacts, in terms of what they consume, and offer suggestions for offsetting emissions.
In Chapter 3, I therefore explain the methodology by which I classify the methods used by companies within the supply chain to measure their CF, in order to decipher what these CF methods currently include and exclude. I also go a step further and analyze the carbon footprint methods used by, not only companies, but also individuals, households, industries, offices and products, given their apparent abundance online.
Chapter 3
-
Methodology
Based on the review of the literature that was conducted in Chapter 2, I found only two CF
methods that companies officially use to measure their carbon footprints: the GHG Protocol
Corporate Standard (GHG Protocol) and the British Standards Institute's PAS 2050. The GHG
Protocol contained a suite of calculation tools, whereas PAS 2050 did not. The Industrial
Biotechnology Innovation and Growth Team (IB-IGT) defines a carbon footprint method as a
guidance manual, and contrasts it with a tool for calculating carbon footprints. With this
distinction in mind, I then decided to research these CF calculation tools (calculators), in addition
to these CF methods, in order to get a sense of how the methodologies behind these calculators
work. This I did, already knowing that the majority of methodologies for these calculators were
not standardized (Padgett et al., 2008 and Kenny and Gray, 2008).
Given the lack of standardization, I specifically sought to select calculators that were
recommended by one or more of the following: government department, non-governmental
organization, state energy agency, state environmental agency, accredited academic institution, leading consulting firm and leading academic/scholarly journal. This is similar to the selection
criteria used by Kenny and Gray (2008) and Padgett et al. (2008) in their respective studies on
carbon footprint calculators.
I also broadened my search in order to consider all of the methodologies, used by companies, as well as individuals, households, industries, offices and products. I considered these methods over a six-week period. Researching these methods gave me a sense of what carbon footprint
methods, in general, are measuring. The differences among these methods are what I used to build the classifications that appear in Chapter 4.
Chapter 4 - Data Analysis and Results
In this chapter, I briefly describe the methods behind the carbon footprint calculators that I found
online. I then detail and classify the methods behind, specifically, the carbon footprint calculators
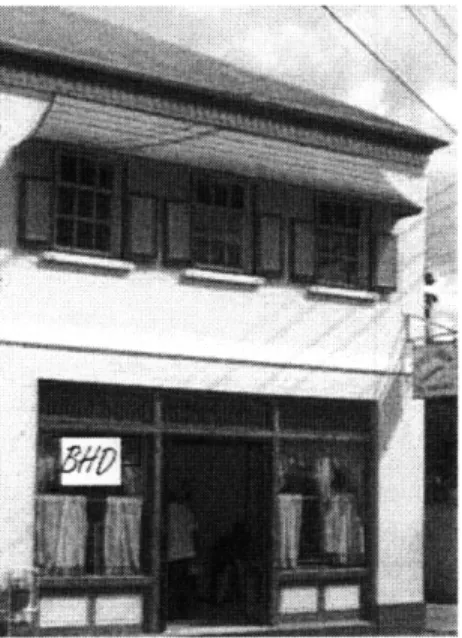
used by companies. To aid in the explanation of this classification, I have created a fictional
bread manufacturing company, entitled, Bringin ' Home the Dough (BHD). The values used to
demonstrate the calculation of BHD's carbon footprint have been chosen for their simplicity to
make the calculation as easy as possible to follow. BHD produces two types of bread: wheat and
rye. Wheat bread is its faster-selling product. BHD is located in Wellesley, MA, where it
operates out of a two-story building which it owns (see Figure 4.1). Its bread-making facility and
storefront are housed on the first floor, while its corporate office is housed on the second floor.
BHD employs twelve people: four bakers (who work in the baking facility), two servers and two
cashiers (who work in the storefront) and one accountant, two sales representatives and one
manager (who work in the office). A year ago, BHD purchased a one-story building in
Cambridge, MA, for future expansion purposes. However, in the meantime, it has leased this
one-story building to another organization.
Finally, I answer the second and third research questions, which are: What are the benefits and
costs of each of these methods? What are the tradeoffs?
4.1 Online Carbon Footprint (Carbon) Calculators
Over a six-week period, I found seventy-six carbon calculators online. Fifty-two were used to
calculate the carbon footprints of individuals and households. Twelve were used to calculate the
carbon footprints of industries. Ten were used to calculate the carbon footprints of companies
and offices. Companies were described as being involved in the manufacturing of a product and
offices were described as being service-oriented (GHG Protocol). Finally, two were used to
calculate the carbon footprints of products. Lists of carbon calculators by type, and some of their
features, appear in the Appendices.
4.1.1 Individual/Household
Typically, these methods asked for two levels of inputs - simple or detailed. For example, Table
4.1 compares Home Energy Saver's single heating and cooling inputs with its detailed inputs.
Major End-Use Simple Inputs Level Detailed Inputs
Heating and Cooling * City with similar climate Approximately 80 additional * House construction year questions about house shape
* Conditioned floor area and size; exterior shading; air-* Stories above ground level tightness; foundation and * Orientation floor; walls, doors and * Foundation type windows
* Ceiling/floor/wall insulation
* Heating/cooling equipment
As Padgett et al. (2008) note, the major categories for individual/household carbon footprint
calculators were electricity use and transportation. They were also country- and
location-specific.
4.1.2 Industry
Five of the twelve industry CF calculators found were considered adaptable to the vegetable
industry. They either employed static, spreadsheet-based approaches or dynamic, process-based
models that captured the flow and stock of carbon dioxide. However, Lisson (2008) notes that,
individually, those calculators did not appear suitable for immediate application to the vegetable
industry. Furthermore, investment was required to address their scientific, design and operational
limitations.
The remaining seven CF industry calculators spanned the aluminum, cement and steel industries
and were based on the GHG Protocol. The GHG Protocol required companies within each
industry to add Uip their respective carbon footprints, in order for an industry-wide carbon
footprint to be calculated. It was therefore more beneficial to look at the corporate CF calculators
and their respective methods.
4.1.3 Corporate/Office
Nine out of the ten corporate/office calculators were based on different methods. These methods
were very similar to the individual/household methods and were primarily aimed at calculating
the carbon footprints of offices. They enquired about each office's electricity use and the amount
of travel (air, road or rail) made by their employees. However, the sole remaining corporate
applicable to manufacturing companies. In the next sub-section, I present the results of my
analysis of how the GHG Protocol classified what it needed from a manufacturing company (with
a corporate office) in order to measure its carbon footprint.
4.2 GHG Protocol Boundaries
The GHG Protocol first establishes two types of boundaries: organizational and operational. An
organizational boundary is determined based on the extent of an organization's equity share and
control. The equity share reflects economic interest, which is the extent of rights a company has
to the risks and rewards flowing from it. Under the control approach, a company accounts for
100 percent of the GHG emissions from operations over which it has control. In the case of our
fictional company, BHD owns two buildings. However, in order to measure its particular GHG
output, BHD has decided to only include the two-story building that houses its bread-making
facility and corporate office, since the one-story building houses another organization. With this
organizational boundary established, BHD then considers the ways in which its bread-making
facility and corporate office generate GHG emissions. This would constitute its operational
boundary.
The GHG Protocol determines an operational boundary by identifying emissions associated with a company's operations. These emissions are categorized as direct or indirect. Direct GHG emissions are emissions from sources that are owned or controlled by the company. Indirect GHG emissions are emissions that are consequences of the activities of the company but occur at sources owned or controlled by another company. What is classified as direct and indirect emissions is dependent on the organizational boundaries (determined by either equity or control). Figure 4.2 shows the relationship between the organizational and operational boundaries of a company.
-. - --- .
_---I
---t
Figure 4.2: Organizational and Operational Boundaries of a Company (Source: GHG Protocol)
Continuing with our example of BHD, its operational boundary includes a natural gas-powered
water heater and electricity use in the two-story building and employee business travel via car,
train and commuter rail.
4.2.1 Emissions
Direct and indirect emissions are further classified into three scopes: scope 1, scope 2 and scope
3. Scope 1 emissions account for direct GHG emissions that occur from sources that are owned
or controlled by the company, for example, emissions from combustion in owned or controlled
boilers, heaters, vehicles, etc. Scope 2 emissions account for GHG emissions that are generated
by purchased electricity. Purchased electricity is defined as electricity that is purchased or
otherwise brought into the organizational boundary of the company. Scope 2 emissions
physically occur at the facility where electricity is generated. The GHG Protocol regards scope 3
emissions as optional. These emissions are a consequence of the activities of the company, but
occur from sources not owned or controlled by the company. Some examples of scope 3
fuels; and employee business travel. Figure 4.3 gives an overview of the emissions and scopes over a supply chain.
1igure 4._: uverview ot tmissions ana scopes across a supply Cfnam (source: UiHUi Frotocol)
BHD therefore has the following emissions: Scope 1 (direct emissions) are emissions from the natural gas-powered water heater in the two-story building that it owns. Scope 2 (indirect
emissions) are emissions from purchased electricity use in this two-story building. Scope 3 (other indirect emissions) are emissions from business travel by employees via car, train and commuter rail.
4.2.2 Types ofEmissions
Emissions can be further classified into types of activities and sources of emissions. For example,
fugitive emissions result from intentional or unintentional releases, e.g. equipment leaks from
joints or seals; methane emissions from coal mines and venting; and hydroflourocarbon emissions during the use of refrigeration and air conditioning equipment. Sources of emissions include
stationary combustion (the combustion of fuels in stationary equipment such as turbines, heaters
trucks, trains and ships); and process emissions (the emissions from physical or chemical
processes). The GHG Protocol notes that every company has processes, products and services
that generate direct and/or indirect emissions from one or more of the above broad categories. It
further states that its calculators are based on these categories.
4.2.3 Nature of Companies and Data Collection
Once organizational and operational boundaries have been established, the next step is to identify
exactly what data would be needed to measure GHG output. The GHG Protocol notes that there
are two basic approaches for gathering data on GHG emissions from a corporation's facilities:
centralized, this is where individual facilities report activity/fuel use data to the corporate level,
where GHG emissions are calculated; and decentralized, this is where individual facilities collect
activity/fuel use data, directly calculating their GHG emissions, and report this data to the
corporate level. The difference between these two approaches is in where the emissions
calculations occur. Table 4.2 shows these two approaches to gathering data.
SITE LEVEL CORPORATE LEVEL
Centralized Activity Data Sites report activity data (GHG emissions
calculated at corporate level: Activity Data x
Emissions Factors = Quantity of GHG
Emissions)
Decentralized Activity Data x Emission Sites report GHG emissions
Factor = Quantity of GHG Emissions
BHD is a centralized company. As depicted in Figure 4.2, BHD needs to find the appropriate
activity data and emissions factor. Activity data quantify an activity in units that will help to
measure the amount of emissions generated, for example, the kilowatt hours of electricity used.
BHD's Scope 2 emissions are indirect emissions from electricity use in both the bread-making
facility and the corporate office. The activity data that it needs to measure the amount of GHG
emissions that it generates is in kilowatt hours (kWh). Suppose that BHD's annual electricity
usage in both the bread-making facility and the corporate office is 47,313 kWh. Once activity
data has been collected for each emissions source, emissions factors need to be found. Emissions
factors convert activity data to emissions values. Emissions factors are published by various
entities such as local, state, or national government agencies and intergovernmental agencies.
As noted in Table 4.2, for a centralized company like BHD, its GHG emissions can be measured
by using the following formula:
Activity Data x Emissions Factors = Quantity of GHG Emissions
Note the activity data and emissions factors must be expressed in the same measurement units. As fictionalized above, BHD's annual electricity usage in both the bread-making facility and the corporate office is 47,313 kWh. Since this electricity activity data is in kWh, BHD uses an emissions factor, from, say, the E-GRID database from the Environmental Protection Agency (EPA), to convert kWh to pounds (lbs) of carbon dioxide equivalents (CO2e). CO2e is the unit for
comparing the global warming impact of a greenhouse gas expressed in terms of the amount of carbon dioxide that would have an equivalent impact (PAS 2050). The emissions from this database are expressed in lbs of CO2e/megawatt hour (MWh). The activity data is in kWh, so the
emissions factor is first converted into CO2e/kWh by dividing by 1,000. Below, the emissions
calculation is performed, and then the result is converted to tons (metric tons).
Calculate emissions: 47,3 Convert to metric tons: 9,13 Total CO2e from electricity
13 kWh x (0.1931bs of C02e/kWh)
1 lbs of C0 2e/2,205 lbs/ton
= 9,131 lbs of CO2e = 4.14 tons of CO2e
= 4.14 tons of COze
Therefore, BHD's total GHG emissions from purchased electricity for this year are 4.14 tons of CO2e. This is reported as BHD's Scope 2 emissions.
Figure 4.4 summarizes how the GHG Protocol classifies what is required from a company in order to measure its carbon footprint.
Boundaries
I
shareI
Lco.Eic
LFinIZ
.
DirectEmissions Emissions RequiredFi2ure 4.4: GHG Protocol Classification
Purchased Energy OW Optional i ope rational ~--- --- --- --- --- , ----
---
-- -
-
I iI
---4.2.4 Should Scope 3 Emissions be Optional?
As can be seen from Figure 4.4 and noted in sub-section 4.2.2, the GHG Protocol regards scope 3
emissions as optional. This is problematic from a supply chain perspective. Consider Figure 4.5.
Upstream
(Suppliers)
Electricity
GneratO
eiotn
,
U
'
Use of sold products Scope 27
Disposal of sold products Scope3
Fi2ure 4.5: GHG Emissions across a Supply Chain (Source: World Resources Institute)
According to the World Resources Institute (WRI), which developed the GHG Protocol, corporate GHG management is moving beyond companies' own operations and toward the full supply chain. It notes the following factors that have been driving the creation of a new protocol that addresses product and supply chain GHG accounting and reporting: increasing focus on GHG emissions associated with products; push for supply chain disclosure and risk management; increasing public reporting of scope 3 emissions in product-level GHG emissions; and increasing
business-to-business requests for product-level information. This is why the WRI is currently in the process of developing a new standard for product and supply chain GHG accounting and reporting. However, it will not be available until 2010. In the meantime, companies are using the PAS 2050 to calculate the carbon dioxide emissions of their products and along their supply chains, in order to close this gap. The next sub-section addresses the product carbon footprint method, PAS 2050.
4.3 PAS 2050
As previously discussed in Chapter 2, although there are about five CF methods currently being created, PAS 2050 is the only 'official' one. It was therefore not surprising that of the seventy-six calculators found, only two were product-based. Both of these calculators, from Gabi
Software and CleanMetrics, said that they were based on PAS 2050. In this sub-section, I present the results of my analysis of how PAS 2050 classified what it needed from a company
in order to measure its carbon footprint. To aid in the explanation of this classification, I will again use the example of the bread manufacturer, BHD. Recall that BHD produces two types of bread: wheat and rye. Since wheat bread is its faster-selling product, for the purposes of this classification, I will only focus on BHD's production of wheat bread.
4.3.1 Boundaries
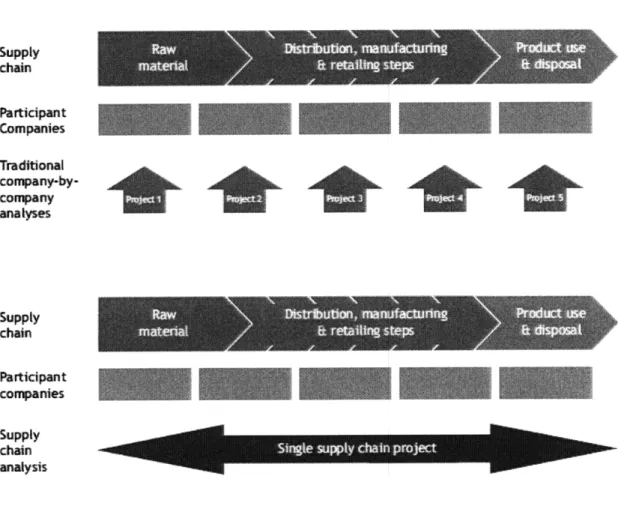
While the GHG Protocol establishes organizational boundaries and analyzes the operations of a single company or even a single site, PAS 2050 takes a supply chain approach. This approach covers specific processes from multiple companies and multiple sites operating in a single supply chain. This allows the carbon footprint of each product to be measured. Figure 4.6 shows a comparison of company-by-company and supply chain analyses.
Supply chain Participant Companies Traditional company-by-company analyses Supply chain Participant companies Supply chain analysis
* *
Q
Figure 4.6: Comparison of Company-by-Company and Supply Chain Analyses (The Carbon Trust, 2008).
PAS 2050 considers two types of boundaries for calculating the CF of products:
business-to-consumer (B2C) and business-to-business (B2B). B2C involves processes that take place from
raw materials, through manufacture, distribution and retail, to consumer use and finally disposal
and/or recycling. B2B carbon footprints stop at the point at which the product is delivered to
another manufacturer. This is because B2B products can be used as inputs to multiple final
products with widely divergent use and disposal characteristics (e.g. aluminum can be used in
drink cans or airplanes). B2B therefore captures raw materials through production up to the point
where the product arrives to a new organization, including distribution and transport to the
customer's site. It excludes additional manufacturing steps, final product distribution, retail,
nufaawift
ft MWfifts steps
consumer use and disposal/recycling. Figure 4.7 illustrates the differences between B2C and
B2B boundaries.
Figure 4.7: B2C and B2B Boundaries (Source: PAS 2050)
Once these boundaries have been established, the materials that are processed and the activities
that occur within them are considered. Figure 4.8 summarizes how the GHG Protocol classifies
what is required from a company in order to measure its carbon footprint.
* M gas used at any stage In -ie ie cyckr SInclude crocesses related raw mrasoon - Fanning -Forestry - processing - Fakaging -r orage * Account for lirpoct o raw (prodinoe. - use dage A adNr. hIes from collection of row maecos todisritson: -Ah producNs procesws - Transport! storage related to producmon enssions e.g fighting, witilaion, *sPNceture; * AS mateflats poduced: - Product - Wstse DM<1 oduos) - Direct emission * Al sepsin ransort and related storage * Retail storage and dtsplak * Energy required during use phase - Storage -Preparation - Applicatio -Matnienorice; repnir re-g for long use phased * AN steps indisposd: - Transpon -St orage - Prozessng * Energy reqtared in disposalrecydlig process * Direct emissions due o disposal recycing: - Carban decay - Metane rleaseIianeronn
Consider the case of BHD's wheat bread: 50% of it comprises of flour, 25% comprises of water,
20% comprises of butter and 5% comprises of other ingredients such as yeast. Once the wheat
bread is made, it is wrapped in plastic packaging material. The activities involved in producing
the wheat bread occur at multiple companies. Where the raw materials such as wheat, milk and
butter are concerned, Mega Mills produces and transports wheat and mills it into flour, before
transporting the flour to BHD. Daring Dairy produces milk, manufactures butter and transports
both to BHD. Once the raw materials have arrived to BHD's bread-making facility, wheat bread
is manufactured and packaged. The finished product is then distributed to BHD's storefront, as
well as to other nearby convenience stores. Customers then eat the wheat bread (see Figure 4.9)
and dispose of the waste, in the form of expired bread or the plastic packaging.
Figure 4.9: A Loaf of BHD Wheat Bread Ready for Consumption (Source: Real Baking with Rose)
PAS 2050 notes that depending on the company's aim in measuring it's product carbon footprint, it could either focus on all of the materials and activities itemized in Figure 4.8 or conduct a high-level carbon footprint (hot spot analysis) whereby the major sources of GHG emissions are
identified or the most important sources that would differentiate a company and its product from
its competitors are considered. Figure 4.10 complements Figure 4.8.
Upstream
/
Own
Operations
Downstream
Suppliers
Customers
Figure 4.10: Product Emissions across the Supply Chain (Source: World Resources Institute)
4.4 Research Question 2. Benefits and Costs of GHG Protocol and PAS 2050
The GHG Protocol can facilitate public reporting, since it is recognized by the International
Organization of Standards (ISO). It can also facilitate participation in voluntary and mandatory
GHG programs. It also helps companies to participate in GHG markets. Finally, it helps a company to identify and prioritize GHG hotspots and reduction opportunities at the company level. However, to date, it cannot do this at the product level (GHG Protocol). This appears to be the only cost of the GHG Protocol. Recall that in Chapter 1, Matthews et al. (2008) urged that without a full knowledge of its carbon footprint, a company would be unable to pursue the most cost-effective mitigating strategies.
On the other hand, PAS 2050 can give a company a more complete knowledge of its carbon footprint, where its product is concerned, because it gives a detailed assessment of a product's life
cycle (BSI). PAS 2050 can also help the company to identify the largest emission sources both within a company's own operations and across the activities of other companies operating in the supply chain. However, the Climate Change Corp notes that the more intricate the product becomes, the trickier the job. For example, measuring the carbon footprint of an apple is easier than measuring the carbon footprint of a mobile phone. In a study on the life cycle environmental issues of mobile phones, it was found that due to the complex nature of the mobile phone, the potential scope of the data that has to be collected to measure its carbon footprint is immense (Nokia, 2005) (See Figure 4.11).
: PR 1 ,Z) 440 MA A IAL [ . . ... ... ....... . . ... .... ...
~~~..
. ... FW4T R.. .... . PRODUC MA~ACT---
i
. .USAGE OF PRODUCT~
oz=r&s
ri
r>
49-ft E ND OF L0FE TREATMENT OF PRODUCT
-fl
t II 4<
;
i> :
Figure 4.11: Life Cycle Stages of a Mobile Phone (Nokia, 2005)
Where communicating a product's carbon footprint is concerned, PAS 2050 states that it is only
suitable for internal reporting (PAS 2050). This is a limitation. In order to provide more
confidence in its own internal decision-making or as a step towards making external claims, PAS
2050 recommends that the company seek third-party certification by an internationally
recognized body. Here, an auditor would review the process used to estimate the carbon
footprint, check the data sources and calculations and certify whether PAS 2050 has been used
correctly and whether the assessment has achieved conformity. Table 4.3 summarizes the
benefits and costs of the GHG Protocol and PAS 2050.
Criteria GHG Protocol PAS 2050
Company level reporting Product level reporting Internal reporting External reporting Hotspot analysis Detailed analysis
Single company involved Multiple companies involved Companies engaged individually
Companies engaged collaboratively up and down the supply chain
Savings from efficiencies within each company's operation
Savings from both internal efficiencies and from external process change and reorganization
Table 4.3: Benefits and Costs of GHG Protocol and PAS 2050
From Table 4.3, we can see that depending on what the company needs a CF method to measure, it will either choose the GHG Protocol or PAS. Neither can be described as the "correct" carbon
4.5 Where the GHG Protocol and the PAS 2050 Overlap
Consider again Figure 2.2 from Chapter 2, where the corporate and product CF methods overlap
(Figure 4.12).
Corporate footprint
Product
footprint
Prot / Range -'.--Overlap BaplsCha
a So 0 Ply C haa~Figure 4.12: Where the GHG Protocol and PAS 2050 Overlap
In this overlapping region, it should be noted that the GHG Protocol (the corporate CF method)
and the PAS 2050 (the product CF method) do not necessarily measure GHG output in the same
way. Using the GHG Protocol, in Table 4.4, the corporate carbon footprint of the bread
Scope Amount of CO2e
Scope 1 1.25 tons of CO2e (from natural gas-powered water heater)
Scope 2 4.14 tons of CO2e (from purchased electricity)
Scope 3 0.1 tons of CO2e (from car travel)
0. 05 tons of CO2e (from train travel)
0.02 tons of CO2e (from commuter rail travel)
Total GHG Emissions 5.56 tons of CO2e
Table 4.4: BHD GHG Emissions According to the GHG Protocol
Using the PAS 2050, in Table 4.5, the product carbon footprint of the bread manufacturer, BHD, was measured. In particular, 1 ton of wheat bread was considered.
Company Activity Amount of CO2e
Mega Mills (Raw Materials) Wheat Farming 0.45 tons of CO2e
Wheat Transport 0.009 tons of CO2e
Flour Production 0.045 tons of CO2e
Flour Transport 0.007 tons of CO2e
Flour Waste Transport 0.014 tons of CO2e
Flour Waste Disposal 0.054 tons of CO2e
Daring Dairy (Raw Materials) Declined to give information Declined to give about the butter and milk that information about the it supplied to BHD butter and milk that it
supplied to BHD Bringin' Home the Dough (Manufacturing, Bread-Making 0.3 tons of CO2e
Distribution and Retail)
Waste Transport 0.002 tons of CO2e
Bread Distribution 0.03 tons of COze
Storage 0.0005 tons of CO2e
Transport to Convenience 0.005 tons of CO2e
Stores
Consumer use (storage) 0.005 tons of CO2e
Consumer use (heating) 0.036 tons of CO2e
Disposal of wasted wheat 0.0004 tons of CO2e
bread
Disposal of plastic packaging 0.012 tons of CO2e
Total GHG Emissions 1.009 tons of CO2e Table 4.5: BHD GHG Emissions According to PAS 2050
Comparing the carbon footprint measurements in Tables 4.4 and 4.5, respectively, we see that
according to the GHG Protocol, BHD's corporate carbon footprint is 5.56 tons of CO2e and
according to PAS 2050, BHD's product carbon footprint is 1.009 tons of CO2e. By reviewing
the inputs of each measurement, one could see that there really was no overlap in terms of what
each method measured. There could have been some overlap if the GHG Protocol's Scope 3
emissions included product-level information, where the wheat bread was concerned. But it was
optional to include it. Had it been included, we would see that both the GHG Protocol and the
PAS 2050 would have calculated the product-level information, as it related to only BHD, in the
same way. However, the GHG Protocol would not have included information from Mega Mills
since this would have been outside of its pre-established organizational boundary. Also, PAS
2050 would not have included information that did not pertain to the direct production of the
2050 calculated could have been larger, if Daring Dairy had participated in the measurement,
given that 20% of the wheat bread comprises of butter.
The results from Tables 4.4 and 4.5 show that due to the arbitrary nature of carbon footprint
boundaries, different values of carbon footprints can be calculated. For purposes of comparison,
however, PAS 2050 cautions that different product footprints are not truly comparable unless the
same data sources, boundary conditions and other assumptions are used.
4.6 Research Question 3: Tradeoffs between GHG Protocol and PAS 2050
Despite these variable results, from the point of view of investors and shareholders, it is perhaps
better to use GHG Protocol, given its focus on a single company. The GHG Protocol allows a
company to address its direct financial and regulatory exposure if the company has high GHG
emissions. The company can do so, by addressing the environmental implications of its corporate
brand. However, from the perspective of the consumer, it is perhaps better to use PAS 2050.
PAS 2050 looks at impacts outside a particular company's boundary and gives a fuller picture
from the product-level (The Carbon Trust, 2006). Using both, though, would be the better option,
since a fuller picture of a company's carbon footprint, internally and along its product's supply
chain is most desirable. Recall, though, that PAS 2050 cannot be publicly reported. In the next
and final chapter, I discuss some of the long-term ramifications of using either the GHG Protocol
or PAS 2050. For argument's sake, I assume that both the GHG Protocol and the PAS 2050 can
be publicly reported.
Chapter
5 -
Conclusion
Given my research on the carbon footprint (CF) methods used by companies, I have drawn three
key insights. Firstly, a carbon footprint is not simply a measure of carbon dioxide output; it is
also a measure of the output of other greenhouse gases, such as nitrous oxide and methane.
Secondly, there are a number of methods for measuring the carbon footprints of companies. They
fall into two categories: corporate and product. These two categories of CF methods differ
significantly from each other. This implies that no single method can be described as the
'preferred' method. It was more advisable to make tradeoffs between each of these methods.
Finally, methods are chosen according to purpose to be served. I now conclude this thesis by
discussing some of the long-term ramifications of choosing a particular method.
5.1 Long-term Ramifications of Using Corporate CF Methods
Consider a company that has measured its GHG output. using the GHG Protocol. Based on the
results, the company can either choose to internally reduce its GHG emissions (use internal
reduction strategies) or to shift the intensive GHG aspects of the company outside of its
responsibility (use outsourcing strategies). How a company chooses to respond will be driven by
either regulatory concerns or consumer demand. Consider the case of regulatory concerns, whereby a cap and trade system is in place, along with a tax on a particular greenhouse gas (e.g.
carbon dioxide): if a company has reached its limit (its cap) of carbon dioxide, then it will be
taxed. The company would then have to decide if it is cheaper to pay this tax, or to reduce the
amount of carbon dioxide that it is emitting, by outsourcing its carbon dioxide-intensive activities
to lesser environmentally-regulated companies or regions. Here the internal reduction strategy
becomes an outsourcing strategy. Such outsourcing strategies are also referred to as carbon
Reinaud (2008) defines carbon leakage as the increase in emissions outside a region as a direct
result of the policy to cap emission in that particular region. Carbon leakage means that the
domestic climate mitigation policy is less effective and more costly in containing emission levels, a legitimate concern for policy-makers. In her report, she focuses on the competitiveness leakage
channel for manufacturing sectors: immediate loss of market share for carbon-constrained
industrial products, to the benefit of non-carbon-constrained countries (i.e. decreases of exports
and increases of imports); and relocation of energy-intensive industries to countries with a more
favorable climate policy. Changes in trade patterns as a result of uneven carbon constraints are
the main indicator of this competitiveness driven-carbon leakage.
Reinaud (2008) offers that since the competitiveness of a company is defined as its ability to
maintain profits and market share, a substantial increase in costs for a sector in one region
(entailing loss in profits compared to international competitors) would affect a company's
competitiveness (its ability to retain market shares) in different ways: enhanced competition from
cheaper competitors on domestic and overseas markets and lower profits leading to lower
capacity to invest and expand activities. She gives an example: with or without the carbon
dioxide cost component, companies in the European primary smelting industry have defacto lost
their position: demand is increasingly met by imports as domestic production is saturated and no
investments in additional capacity are in the pipeline.
This means that companies need to be incentivized to look outside of their company's boundaries
and into their supply chain, in order to prevent their own extinction, in light of increasing
environmental regulation and its associated costs (tax). This is what OK Petroleum, Sweden's
largest refiner and retailer of gasoline, did. When faced with emissions limits for the carbon
dioxide that it produces, it used an internal reduction strategy and lobbied for a higher carbon tax.
By fighting for higher carbon taxes, because it no longer wanted to see itself as being in the
petroleum business, it entered the clean energy business. OK Petroleum foresaw two
ramifications of its decision. First, an increase in carbon taxes would help them in the long-term
by giving them incentives to be innovative. Second, this increase also fostered the creation of
cleaner fuels (Hawken et al., 1999).
5.2 Long-term Ramifications of Using Product CF Methods
Rather than wait for carbon dioxide cost components to spell dire effects for its survival, similar
to OK Petroleum, Walkers, the UK's largest snack foods manufacturer with such brands as
Doritos and Wotsits was forward-thinking in its approach. It decided to become green, both in
response to increasing regulatory pressure, as well increasing consumer pressure for greener
products, by looking outside of its company's boundaries and into its supply chain. That is, instead of becoming a victim of outsourcing strategies and carbon leakage, Walkers used an
internal reduction strategy, that involved greener, more energy-efficient production processes, or
the use of greener suppliers along its supply chain.
To accomplish this, Walkers worked with the Carbon Trust, the co-creators of PAS 2050 on
energy efficiency and carbon management, identifying opportunities that saved more than 2,000
tons of carbon dioxide per annum and reduced their energy bills by approximately £225,000.
Through its continuing commitment to reduce its GHG emissions, Walkers was able to boost its
profitability through energy savings. One key opportunity related to the water content of the
potatoes that Walkers purchases. Since Walkers produced potatoes by weight, it was paying a
price per ton of potatoes it purchased from farmers. This excess water in potatoes meant that potato frying time was increased and emissions resulting from the frying stage increased by up to
content. Potatoes with lower water content resulted in an overall supply chain saving of up to
9,200 tons of carbon dioxide and £1.2 million per annum. This in turn led to Walkers reducing
the GHG emissions that occurred in the potato frying stage by up to 10% (The Carbon Trust,
2006). Walkers was therefore able to develop a low-carbon product that captured new markets
and generated higher profits, thereby giving it larger market share and thus greater competitive
advantage.
5.3 The Conundrum Presented by a Tin of Peanuts
This Walkers example points to improving, or better said, 'greening' a company's final product, by using an internal reduction strategy, rather than either using or becoming a victim of
outsourcing strategies. Albino et al. (2009) define a green product as a product designed to
minimize its environmental impacts during its whole life cycle. In particular, non-renewable
resource use is minimized, toxic materials are avoided and renewable resource use takes place in
accordance with their rate of replenishment. In order to accomplish the cost savings that it did, Walkers took a supply chain perspective, instead of a single company perspective.
Indeed, low-carbon products allow companies like Walkers to differentiate themselves in the
marketplace. In fact, the creators of PAS 2050 have worked with companies like Tesco, a major
UK retailer, to put CF labels on products in four different categories: laundry detergent, orange
juice, potatoes and light bulbs. The carbon labels tell customers the amount of carbon dioxide
and other greenhouse gases produced during the lifetime of the product including use and
disposal. However, Schmidt (2009) asks the following question: if a tin of peanuts is labeled to
have a load of 85 grams of carbon dioxide, what would this mean to the customer? For a CF
be included. Only in this way can consumers become aware of the connections and evaluate the
information in order to act appropriately. Regarding the tin of peanuts, Schmidt (2009) asks what
would happen if a consumer goes to fetch a tin of peanuts and notices that a tin in one store is
labeled to have 85 grams of carbon dioxide, while a tin in another store is labeled to have 90
grams of carbon dioxide? If she chooses to buy the tin with 85 grams of carbon dioxide, she
trusts that she is making a contribution to reducing carbon dioxide. However, what sense would
it make if the store that sells the tin with 90 grams of carbon dioxide is nearer to where the
customer lives? She could end up generating about 200 times more carbon dioxide to get to that
store, in order to save 5 grams of carbon dioxide worth of peanuts, and is left confused.
5.4 Other Environmental Effects Apart from Global Warming
This sort of confusion, on the parts of companies, their suppliers and customers, is what has
raised many of the methodological questions about the carbon footprint methods used by
companies, which have been outlined in this thesis. Underlying these questions is the concern of
whether or not companies are really ready to address the observation that while the earth's
resources (natural capital) have been diminishing, companies manufacturing capital has been
expanding (Hawken et al., 1999). Hawken et al. (1999) asks if companies have really reached the
stage whereby creating production and distribution systems that reverse the loss and eventually
increase the supply of natural capital is their only option? Getting to this stage will require more
than product design, marketing or competition. It will mean a fundamental reevaluation of
companies' roles and responsibilities amidst this global warming debate.
For example, while increasing labor productivity to improve competitiveness requires huge