HAL Id: inserm-00409647
https://www.hal.inserm.fr/inserm-00409647
Submitted on 8 Aug 2011
HAL is a multi-disciplinary open access
archive for the deposit and dissemination of
sci-entific research documents, whether they are
pub-lished or not. The documents may come from
teaching and research institutions in France or
abroad, or from public or private research centers.
L’archive ouverte pluridisciplinaire HAL, est
destinée au dépôt et à la diffusion de documents
scientifiques de niveau recherche, publiés ou non,
émanant des établissements d’enseignement et de
recherche français ou étrangers, des laboratoires
publics ou privés.
Adipose triglyceride lipase and hormone-sensitive lipase
protein expression is decreased in the obese
insulin-resistant state.
Johan Jocken, Dominique Langin, Egbert Smit, Wim Saris, Carine Valle,
Gabby Hul, Cecilia Holm, Peter Arner, Ellen Blaak
To cite this version:
Johan Jocken, Dominique Langin, Egbert Smit, Wim Saris, Carine Valle, et al.. Adipose
triglyc-eride lipase and hormone-sensitive lipase protein expression is decreased in the obese insulin-resistant
state.. Journal of Clinical Endocrinology and Metabolism, Endocrine Society, 2007, 92 (6), pp.2292-9.
�10.1210/jc.2006-1318�. �inserm-00409647�
Adipose Triglyceride Lipase and Hormone-Sensitive
Lipase Protein Expression Is Decreased in the Obese
Insulin-Resistant State
Johan W. E. Jocken, Dominique Langin, Egbert Smit, Wim H. M. Saris, Carine Valle, Gabby B. Hul,
Cecilia Holm, Peter Arner, and Ellen E. Blaak
Department of Human Biology (J.W.E.J., E.S., W.H.M.S., G.B.H., E.E.B.), Nutrition and Toxicology Research Institute Maastricht, Maastricht University, 6200 MD Maastricht, The Netherlands; Obesity Research Unit (D.L., C.V.), Institut National de la Sante´ et de la Recherche Me´dicale, Unite´ 586, F-31432 Toulouse, France; Paul Sabatier University (D.L., C.V.), Louis Bugnard Institute, Institut Fe´de´ratif de Recherche 31, F-31432 Toulouse, France; Centre Hospitalier Universitaire de Toulouse (D.L.), Biochemistry Laboratory, Biology Institute of Purpan, F-31059 Toulouse, France;
Department of Experimental Medical Science (C.H.), Division of Diabetes, Metabolism, and Endocrinology, Lund University, SE-221 00 Lund, Sweden; and Department of Medicine (P.A.), Karolinska Institutet, Karolinska University Hospital, Huddinge, SE-141 86 Stockholm, Sweden
Aim/Hypothesis: Obesity is associated with increased triacylglyc-erol (TAG) storage in adipose tissue and insulin resistance. The mo-bilization of stored TAG is mediated by hormone-sensitive lipase (HSL) and the recently discovered adipose triglyceride lipase (ATGL). The aim of the present study was to examine whether ATGL and HSL mRNA and protein expression are altered in insulin-resistant con-ditions. In addition, we investigated whether a possible impaired expression could be reversed by a period of weight reduction. Methods: Adipose tissue biopsies were taken from obese subjects (n⫽ 44) with a wide range of insulin resistance, before and just after a 10-wk hypocaloric diet. ATGL and HSL protein and mRNA expres-sion was determined by Western blot and quantitative RT-PCR, respectively.
Results: Fasting insulin levels and the degree of insulin resistance (using the homeostasis model assessment index for insulin resistance)
were negatively correlated with ATGL and HSL protein expression, independent of age, gender, fat cell size, and body composition. Both mRNA and protein levels of ATGL and HSL were reduced in insulin-resistant compared with insulin-sensitive subjects (P⬍ 0.05). Weight reduction significantly decreased ATGL and HSL mRNA and protein expression. A positive correlation between the decrease in leptin and the decrease in ATGL protein level after weight reduction was ob-served. Finally, ATGL and HSL mRNA and protein levels seem to be highly correlated, indicating a tight coregulation and transcriptional control.
Conclusions: In obese subjects, insulin resistance and hyperinsu-linemia are strongly associated with ATGL and HSL mRNA and protein expression, independent of fat mass. Data on weight reduction indicated that also other factors (e.g. leptin) relate to ATGL and HSL protein expression. (J Clin Endocrinol Metab 92: 2292–2299, 2007)
O
BESITY IS CHARACTERIZED by increased
triacyl-glycerol (TAG) storage in adipose tissue and insulin
resistance. The mobilization of stored TAG (lipolysis) is
me-diated by hormone-sensitive lipase (HSL). For more than 30
yr, the paradigm has been that HSL is the rate-limiting
en-zyme responsible for TAG breakdown. Studies in HSL
knockout mice (1– 6) raised doubt on the rate-limiting role of
HSL in TAG metabolism and suggested that at least one
additional lipase in adipose tissue should be active that
pref-erentially hydrolyzes the first ester bond of the TAG
mole-cule. Recently, a new TAG lipase that belongs to a gene
family characterized by the presence of a patatin domain was
identified (7–9). Zimmermann et al. (9) termed this new
non-HSL lipase adipose triglyceride lipase (ATGL), being
pre-dominantly expressed in adipose tissue.
An impaired catecholamine-induced lipolysis and a
re-duced HSL expression in preadipocytes and differentiated
adipocytes is observed in obesity (10 –12). This blunted
cat-echolamine-induced lipolysis has been proposed to be a
cause of excessive accumulation of body fat. Indeed, studies
in first-degree relatives of obese subjects demonstrate an
impaired catecholamine-mediated lipolysis (13).
Further-more, the impaired catecholamine-induced lipolysis did not
improve after weight loss, indicating that it may be an early
factor in the development or maintenance of increased fat
stores (14 –17). A plausible other interpretation is that this
reduced lipolytic response is an appropriate
down-regula-tion of lipolysis per unit fat mass (FM) to prevent an excessive
fatty acid outflow from the expanded FM and to prevent
worsening of the insulin-resistant (IR) state. In line, fasting
insulin concentrations have been shown to be inversely
re-lated to fatty acid efflux from adipose tissue (18). Moreover,
insulin down-regulates ATGL and HSL mRNA expression in
3T3-L1 adipocytes, and HSL mRNA expression is increased
First Published Online March 13, 2007
Abbreviations: Adj.Vol.OD, Adjusted volume OD; ATGL, adipose triglyceride lipase; BMI, body mass index; FCV, fat cell volume; FCW, fat cell weight; FFM, fat-free mass; FM, fat mass; HOMAir, homeostasis model assessment index for insulin resistance; HSL, hormone-sensitive lipase; IR, insulin resistant; IS, insulin sensitive; PPAR-␥, peroxisome proliferator-activated receptor-␥; TAG, triacylglycerol.
JCEM is published monthly by The Endocrine Society (http://www. endo-society.org), the foremost professional society serving the en-docrine community.
doi: 10.1210/jc.2006-1318
in adipocytes from insulin-deficient animals (19 –22). In
ad-dition, ATGL is down-regulated in animal models for insulin
resistance (ob/ob and db/db), and HSL knockout animals
show signs of impaired insulin sensitivity in adipose tissue
and skeletal muscle (4, 7). Thus, there seems to be a negative
relationship between insulin, ATGL, and HSL expression.
The aim of the present study was to investigate whether
the degree of insulin resistance and hyperinsulinemia are,
independently of FM, related to an impaired ATGL and HSL
protein expression in a group of overweight-obese subjects
with a wide range of insulin resistance, selected from an
existing cohort. In addition, we investigated the impact of
weight loss by means of a hypocaloric diet (low-fat vs.
me-dium-fat diet) on adipose tissue ATGL and HSL protein
levels. To the best of our knowledge, this is the first time that
ATGL protein levels are measured in human adipose tissue.
Subjects and Methods Subjects
This study is part of the European multicenter study NUGENOB (for Nutrient-Gene Interactions in Human Obesity), which has been de-scribed in detail previously (23–25). Only the overweight-obese subjects from the Maastricht center participated in this part of the study. The basic selection criteria for overweight-obese subjects were 20 –50 yr of age and a body mass index (BMI) of at least 26 kg/m2. Exclusion criteria were as follows: weight change of more than 3 kg within the 3 months before the study start; drug-treated hypertension, diabetes, or hyper-lipidemia; thyroid disease; surgically treated obesity; pregnancy; alcohol or drug abuse; and participation in other simultaneous ongoing trials. All subjects were recruited by means of an advertisement in a local newspaper and were informed in detail about the investigation, and their consent was obtained before participating in the study. From the 116 participants at the Maastricht center, a selection of 22 insulin-sen-sitive (IS) and 22 IR subjects was made. Insulin sensitivity was assessed by the homeostasis model assessment index for insulin resistance (HO-MAir) calculated from fasting glucose and insulin according to the equa-tion of Matthews et al. (26). The median for HOMAirin the total Maas-tricht cohort was 2.19 (range, 0.4 –9.9). Subjects above the 50th percentile of HOMAirwere assigned as IR, and subjects below the 50th percentile were assigned as IS. Before entering the study, all subjects were in good health as assessed by medical history and physical examination. The Medical Ethical Review Committee of Maastricht University approved the study protocol, and the clinical investigations were performed ac-cording to the Declaration of Helsinki.
Study design
A clinical investigation day took place before and just after a 10-wk dietary intervention with either low-fat or medium-fat diets (see Dietary
intervention). Subjects arrived at the clinical research center at 0800 h after
a 12 h overnight fast and a 3-d run-in period, in which they had to avoid excessive physical activity and alcohol consumption, as described pre-viously in detail (23). During this day, the subjects underwent anthro-pometric measurements (see below), and an adipose tissue biopsy was taken (see Adipose tissue biopsy). In addition, a venous basal blood sample was drawn for additional analysis (see Biochemical analysis).
Dietary intervention
Subjects followed one of two energy-restricted diets: a medium-fat (n⫽ 23) or a low-fat (n ⫽ 21) diet. Data on the different diets and how the diet was controlled have been published previously (23). The target macronutrient composition of the two diets was as follows: for the low-fat diet, 20 –25% of total energy was provided by fat, and the cor-responding figure for the medium-fat diet was 40 – 45%. Both diets derived 15% of total energy from protein and the remainder (60 – 65 and 40 – 45 for the low-fat and medium-fat diets, respectively) from carbo-hydrates. Both diets were designed to provide 600 kcal/d less than the
individual estimated energy expenditure based on resting metabolic rate, measured using a ventilated hood system, expressed in kilocalories per day and multiplied by 1.3.
Anthropometric measurements
After subjects voided their bladder, body weight was determined on a calibrated electronic scale, accurate to 0.1 kg. Waist and hip circum-ference measurements to the nearest 1 cm were made midway between the lower rib and iliac crest with the participant standing upright. Height was measured using a wall-mounted stadiometer. BMI was calculated as body weight in kilograms divided by squared height in meters. FM and fat-free mass (FFM) were assessed using multifrequency bioimped-ance (QuadScan 4000; Bodystat, Douglas, Isle of Man, UK). The per-centage body fat was calculated from total FM (in kilograms) and body weight.
Adipose tissue biopsy
A sc adipose tissue biopsy was taken from the abdominal region early in the morning after an overnight fast. The second biopsy was taken in wk 10 of the dietary intervention. Biopsies were performed under local anesthesia (0.5% Xylocaine and 0.5% Lidocaine; AstraZeneca, Zoeter-meer, The Netherlands) on the left or right side of the abdomen about 5 cm lateral from the umbilicus using a Hepafix Luer lock syringe (Braun Medical, Bethlehem, PA) and a 146⫻ 31⁄5in. (2.10⫻ 80 mm) Braun Medical Sterican needle. The biopsy was washed in physiological saline and stored in a sterile polypropylene tube at⫺80 C until additional analysis.
Biochemical analysis
Plasma glucose concentrations (ABX Diagnostics, Montpellier, France) were measured on a COBAS MIRA automated spectrophotom-eter (Roche Diagnostica, Basal, Switzerland). TAG (Sigma, St. Louis, MO), FFA (NEFA C kit; Wako Chemicals, Neuss, Germany), and glyc-erol (Roche Molecular Biochemicals, Mannheim, Germany) were mea-sured on a COBAS FARA centrifugal spectrophotometer (Roche Diag-nostica). Standard samples with known concentrations were included in each run for quality control. Plasma insulin and serum leptin were measured with a double antibody RIA [Insulin RIA 100 (Kabi-Pharma-cia, Uppsala, Sweden) or Human Leptin RIA kit (Linco Research, St. Charles, MO)].
Fat cell volume (FCV) and fat cell weight (FCW)
Fat cell characteristics were determined in a subset of the same cohort (n⫽ 39; 19 IS/20 IR; HOMAir, 1.4⫾ 0.1 vs. 4.7 ⫾ 0.5; P ⬍ 0.01). Weight loss after diet was the same among these subjects as in the whole cohort (data not shown). Also, with respect to other metabolic parameters, this subgroup was comparable with the group in which ATGL and HSL protein and mRNA expression was determined (see Results). Adipose tissue was subjected to collagenase treatment, and the mean FCV and FCW were determined as described previously (27).
Sample preparation
Approximately 200 mg adipose tissue was ground to a fine powder under liquid nitrogen and homogenized in 200l of ice-cold buffer: 8 m urea, 2% 3-[(3-cholamidopropyl)dimethylammonio]-1-propane sul-fonate (catalog no. C9426; Sigma), 65 mm dithiotreitol (catalog no. 161-0611; Bio-Rad, Hercules, CA), protease inhibitor (catalog no. P8340; Sigma) and phosphatase inhibitor cocktail (catalog no. P5726; Sigma). The homogenate was vortexed for 5 min and centrifuged at 20,000⫻ g for 30 min at 4 C. The supernatant was carefully collected, and aliquots were stored at⫺80 C. The protein concentration was determined by the Bradford-based protein assay (catalog no. 500-0006; Bio-Rad).
Western blot analysis
Ten micrograms of protein were separated using 10% SDS-PAGE and then transferred to a nitrocellulose membrane. An affinity-purified poly-clonal antibody was raised in rabbit against a 15 amino acid peptide
(amino acids 386 – 400, GRHLPSRLPEQVERL) of human ATGL (Euro-gentec, Seraing, Belgium). In Western blot analysis, a single band at 56 kDa was detected that disappeared after preincubation of the antibody with the peptide. This band corresponds to the predicted molecular mass of the human ATGL protein (9). In addition, when COS cells were transfected with cDNA coding for human ATGL, also a single band of 56 kDa was observed after Western blot of extracted cellular protein. HSL was detected using a rabbit polyclonal antibody, raised and pu-rified against recombinant human HSL. The HSL antibody has been validated previously (28). The secondary antibody was a horseradish peroxidase-conjugated antirabbit Ig (DakoCytomation, Glostrup, Den-mark). Antigen-antibody complexes were visualized using enhanced chemiluminescence (ECL⫹; Amersham Biosciences, Little Chalfont, UK) and a Kodak Image Station (Eastman Kodak, Glostrup, Denmark). Quantification of antigen-antibody complexes was performed using Quantity One 1-D analysis software (Bio-Rad). Optical density units are expressed as adjusted volume [adjusted volume OD (Adj.Vol.OD)⫽ sum of pixels inside the volume boundary⫻ area of a single pixel (in mm2)⫺ the background volume]. Differences in loading were adjusted to-actin protein levels, and an isolated mature adipocyte lysate was included as positive control.
Adipose tissue mRNA analysis
ATGL and HSL mRNA expression was determined in a subset of adipose tissue samples of 26 subjects (13 IS/13 IR; 14 females and 12 males) before and after the diet. Total RNA was extracted from adipose tissue using the RNeasy mini kit (Qiagen, Hilden, Germany). The RNA concentration and purity were assessed spectrophotometrically. An Agi-lent 2100 bioanalyzer (AgiAgi-lent Technologies, Massy, France) was used to confirm the integrity of the RNA. From each sample, 1g of total RNA was reverse transcribed to cDNA using Superscript II Reverse Tran-scriptase (Invitrogen, Cergy Pontoise, France) and random hexamer primers (Invitrogen). HSL and ATGL mRNAs were quantified using premade gene expression assays (Applied Biosystems). Ribosomal RNA, 18S, was used as control to normalize gene expression.
Statistics
All variables were checked for normal distribution, and variables with a skewed distribution were ln-transformed to satisfy conditions of normality.
First, univariate regression analysis was performed to identify vari-ables that contribute to ATGL and HSL protein expression and to changes in protein expression induced by weight loss. Subsequently, a multivariate regression analysis was performed with ATGL or HSL
protein levels as dependent variables and age, gender, FM, FFM, waist circumference, circulating insulin, and leptin levels as independent vari-ables (model 1). The same model was repeated with HOMAiras inde-pendent variable instead of insulin (model 2). To study the impact of weight reduction, changes in ATGL or HSL protein level were entered as dependent variable in the multivariate regression model with age, gender, change in FM, FFM, circulating insulin, and leptin as indepen-dent variables. ATGL and HSL mRNA and protein levels were com-pared between IS and IR subjects using Student’s unpaired t test. Antro-pometric and metabolic parameters and HSL and ATGL mRNA and protein levels were compared before and after the diets using Student’s paired t test. The differential effect of the diets was assessed with analysis of covariance using diet as fixed factor. To avoid multicollinearity in the regression model, independent variables with a correlation greater than 0.8 were not simultaneously included in the model. The impact of the independent variables is described as unstandardized or regression coefficients. A P value ofⱕ0.05 was considered statistically significant. All analyses were performed using SPSS for Mac Os X version 11.0 (SPSS, Chicago, IL).
Results Characteristics of the study subjects
Anthropometric and metabolic characteristics of the study
subjects before and after a 10-wk hypocaloric diet are
dis-played in Table 1. Extensive data on the effects of the
hy-pocaloric diet in the total NUGENOB cohort were reported
previously (23). The diet resulted in significant loss of body
weight (before vs. after, 98.7
⫾ 3.2 vs. 90.0 ⫾ 3.3 kg; P ⬍ 0.001),
FM (37.4
⫾ 1.6 vs. 30.7 ⫾ 1.5 kg; P ⬍ 0.001), and a significantly
decreased BMI (34.1
⫾ 0.7 vs. 31.3 ⫾ 0.7 kg/m
2; P
⬍ 0.001).
In addition, circulating fatty acids (506
⫾ 24 vs. 418 ⫾ 22
m/liter; P ⫽ 0.016), glycerol (105 ⫾ 11 vs. 83 ⫾ 8 m/liter;
P
⫽ 0.003), and leptin (24.7 ⫾ 2.3 vs. 14.5 ⫾ 1.5 ng/ml; P ⬍
0.001) decreased. There were no significant differences in
fasting glucose, insulin, and HOMA
ir. As reported
previ-ously, the low-fat and medium-fat diets resulted in similar
changes in anthropometric and metabolic parameters (23,
25).
TABLE 1. Anthropometric and metabolic parameters before and after a 10-wk hypocaloric diet
Before After IS IR IS IR n (female/male) 22 (16/6) 22 (12/10) 18 (13/5) 17 (9/8) Age (yr) 39.7⫾ 1.5 44.4⫾ 5.0* Weight (kg) 91.0⫾ 3.6 106.4⫾ 4.8* 84.2⫾ 3.7** 96.2⫾ 5.1** Height (m) 1.68⫾ 0.02 1.71⫾ 0.02 BMI (kg/m2) 32.1⫾ 0.7 36.2⫾ 0.9* 29.7⫾ 0.8** 32.9⫾ 1.0** Waist (cm) 105⫾ 3 115⫾ 3* 99⫾ 3** 105⫾ 3.8** Hip (cm) 113⫾ 8 117⫾ 2 108⫾ 2** 112⫾ 2.1** WHR 0.93⫾ 0.02 0.98⫾ 0.02 0.91⫾ 0.02** 0.94⫾ 0.03** %BF 38.2⫾ 1.6 38.4⫾ 1.6 33.6⫾ 1.7** 34.6⫾ 1.8** FFA (M/liter) 504⫾ 30 507⫾ 37 418⫾ 29 418⫾ 35
Free glycerol (M/liter) 114⫾ 21 95⫾ 8 89⫾ 13** 76⫾ 8**
TG (M/liter) 937⫾ 69 1476⫾ 125* 932⫾ 80 1230⫾ 136 Glucose (mM/liter) 5.2⫾ 0.1 5.7⫾ 0.1* 5.1⫾ 0.1 5.4⫾ 0.1 Insulin (U/ml) 7.2⫾ 0.4 15.8⫾ 1.4* 7.4⫾ 0.6 12.4⫾ 1.4 HOMAir 1.7⫾ 0.1 4.0⫾ 0.4* 1.7⫾ 0.2 3.1⫾ 0.4 Leptin (ng/ml) 23⫾ 3 26⫾ 4 14⫾ 2** 15⫾ 2** FCV (pl)a 775⫾ 36 869⫾ 33* 655⫾ 36** 744⫾ 29** FCW (ng)a 709⫾ 33 795⫾ 24* 600⫾ 33** 681⫾ 27**
Values are mean⫾SEM. %BF, Percentage body fat; FFA, free fatty acids; WHR, waist/hip ratio. *, P⬍ 0.05 IS vs. IR, unpaired t test; **,
P⬍ 0.05 before vs. after, paired t test.
Relationship between the degree of insulin resistance and adipose tissue ATGL and HSL protein levels
Univariate regression analysis indicated a negative
corre-lation between HOMA
ir, fasting insulin, and ATGL or HSL
protein levels (all P
⬍ 0.05), whereas age, gender, body
com-position (waist, FM, FFM), and levels of circulating leptin
were not significantly related to ATGL or HSL protein levels
(all P
⬎ 0.10). Multivariate regression analysis, shown in
Table 2, indicated the same negative correlation between
HOMA
ir(ATGL
-coefficient, ⫺1.33, P ⫽ 0.045; HSL
-co-efficient,
⫺0.965, P ⫽ 0.039) (Table 2), fasting insulin (ATGL
-coefficient, ⫺1.41, P ⫽ 0.048; HSL -coefficient, ⫺1.07, P ⫽
0.032) (Table 2), and ATGL or HSL protein levels. These data
indicate that the IR state rather than FM per se causes the
decrease in adipose tissue ATGL and HSL protein levels.
To illustrate the impact of insulin resistance on ATGL and
HSL protein levels, subjects were assigned as IS or IR based
on HOMA
ir(see Subjects and Methods, Subjects).
Anthropo-metric and metabolic characteristics of IS and IR subjects are
displayed in Table 1. Adipose tissue ATGL and HSL protein
levels were found to be dramatically reduced in IR compared
with IS obese subjects. ATGL protein levels were decreased
by 72% in IR compared with IS obese subjects (IR vs. IS, 2.6
⫾
1.3 vs. 9.3
⫾ 3.6 Adj.Vol.OD; P ⫽ 0.025) (Fig. 1B), whereas the
corresponding figure for HSL was 57% (6.6
⫾ 2.3 vs. 15.4 ⫾
3.0 Adj.Vol.OD; P
⫽ 0.001) (Fig. 1B). ATGL and HSL protein
levels were highly correlated (-coefficient, 1.05; r ⫽ 0.568;
P
⫽ 0.0001) (Fig. 2), indicating that ATGL and HSL protein
levels might be tightly coregulated in adipose tissue of obese
subjects.
As indicated in Subjects and Methods, FCV and FCW were
determined in a subset of IS (n
⫽ 19) and IR (n ⫽ 20) subjects
from the same cohort with similar characteristics with
re-spect to HOMA
ir(1.5
⫾ 0.1 vs. 4.7 ⫾ 0.5; P ⬍ 0.01), body fat
percentage (42.5
⫾ 1.1 vs. 42.8 ⫾ 2.0; P ⫽ 0.742), and waist
(108
⫾ 2 vs. 114 ⫾ 2; P ⫽ 0.031) and similar diet-induced
changes. FCV and FCW were significantly higher (12%; P
⫽
0.039) in IR compared with IS subjects and decreased
sig-nificantly after weight loss (P
⬍ 0.01) (Table 1). When ATGL
and HSL protein expression was corrected for mean FCV or
FCW, the difference between groups remained significant
(for ATGL: IR vs. IS, 2.6
⫾ 0.6 vs. 3.9 ⫾ 0.5, P ⬍ 0.01; for HSL:
IR vs. IS, 9.2
⫾ 1.5 vs. 13.4 ⫾ 1.6, P ⬍ 0.01).
ATGL and HSL mRNA expression in IS vs. IR subjects
Additionally, ATGL and HSL mRNA expression was
de-termined in a subset of adipose tissue samples of 26 subjects.
In agreement with the protein expression data, ATGL and
HSL mRNA expression were significantly lower in IR (n
⫽
13) compared with IS (n
⫽ 13) obese subjects (P ⫽ 0.006 and
P
⫽ 0.057, respectively) (Fig. 1A). Also, a positive correlation
was found for ATGL and HSL mRNA expression
(-coeffi-cient, 0.531; r
⫽ 0.253; P ⫽ 0.005), suggesting that the two
TABLE 2. Determinants of ATGL and HSL protein levels in multivariate regression analysis
Dependent variable (n⫽ 44) ATGL expression HSL expression
Bb 95% CI P value Bb 95% CI P value
Model 1
Age (yr) 5.98E⫺02 ⫺3.37E⫺02 to 0.15 0.199 5.29E⫺02 ⫺1.24E⫺02 to 0.12 0.107 Gender
Male 0 0 0 0
Female ⫺0.606 ⫺4.27 to 3.06 0.736 ⫺0.72 ⫺3.27 to 1.85 0.570
Waist (cm) ⫺3.77E⫺02 ⫺0.13 to 5.15E⫺02 0.392 ⫺1.01E⫺02 ⫺7.23E⫺02 to 5.22E⫺02 0.742 FFM (kg) ⫺5.79E⫺03 ⫺0.13 to 0.12 0.926 ⫺2.14E⫺02 ⫺0.11 to 6.72E⫺02 0.622 FM (kg) 2.78E⫺02 ⫺9.57E⫺02 to 0.15 0.646 3.51E⫺02 ⫺5.13E⫺02 to 0.12 0.410 Insulin (U/ml)a ⫺1.41 ⫺2.81 to ⫺1.57E⫺02 0.048 ⫺1.07 ⫺2.05 to ⫺9.95E⫺02 0.032
Leptin (ng/ml)a 7.79E⫺03 ⫺4.97E⫺02 to
6.53E⫺02
0.782 9.43E⫺03 ⫺3.08E⫺02 to 4.96E⫺02 0.633 Model 2
HOMAira ⫺1.33 ⫺2.63 to ⫺3.43E⫺02 0.045 ⫺0.965 ⫺1.88 to ⫺5.14E⫺02 0.039 Model 2 includes HOMAirinstead of circulating insulin levels in addition to the variables indicated in model 1. CI, Confidence interval; E, exponent 10.
aValues are entered in the model after being ln-transformed. bUnstandardized-coefficient.
FIG. 1. ATGL and HSL mRNA and protein expression in sc adipose tissue of IS (black bars) vs. IR (white bars) overweight-obese subjects. A, ATGL and HSL mRNA expression was significantly lower in IR (n⫽ 13) compared with IS (n ⫽ 13) subjects (#, P ⫽ 0.006; and ##, P ⫽ 0.057, respectively). mRNA levels were quantified by quantitative RT-PCR and normalized with 18S rRNA. B, In line, ATGL and HSL protein expression was significantly lower in IR (n⫽ 22) compared with IS (n⫽ 22) subjects (*, P ⫽ 0.025; and **, P ⫽ 0.001, respectively). ATGL and HSL protein expression was quantified using Western blot, and expression was related to the structural protein-actin. IS vs. IR using unpaired Student’s t test statistics. Values are mean⫾SEM.
enzymes belong to a common regulatory network with tight
transcriptional control.
Effect of weight reduction on adipose tissue ATGL and HSL protein levels
A 10-wk hypocaloric diet resulted in a decreased adipose
tissue ATGL (before vs. after, 5.7
⫾ 1.8 vs. 1.4 ⫾ 0.4
Adj.Vo-l.OD; P
⫽ 0.04) (Fig. 3B) and HSL (before vs. after, 10.8 ⫾ 1.9
vs. 5.9
⫾ 1.3 Adj.Vol.OD; P ⫽ 0.023) (Fig. 3B) protein level.
When ATGL and HSL protein expression was corrected for
mean FCV or FCW, the difference remained significant (for
ATGL: before vs. after, 3.2
⫾ 0.5 vs. 2.1 ⫾ 0.4, P ⫽ 0.02; for
HSL: before vs. after, 11.1
⫾ 1.8 vs. 7.5 ⫾ 1.4, P ⬍ 0.01).
Low-fat and medium-fat diets resulted in similar changes in
ATGL and HSL protein levels. To find the effect of changes
in anthropometric and metabolic parameters on ATGL and
HSL protein levels, univariate and multivariate regression
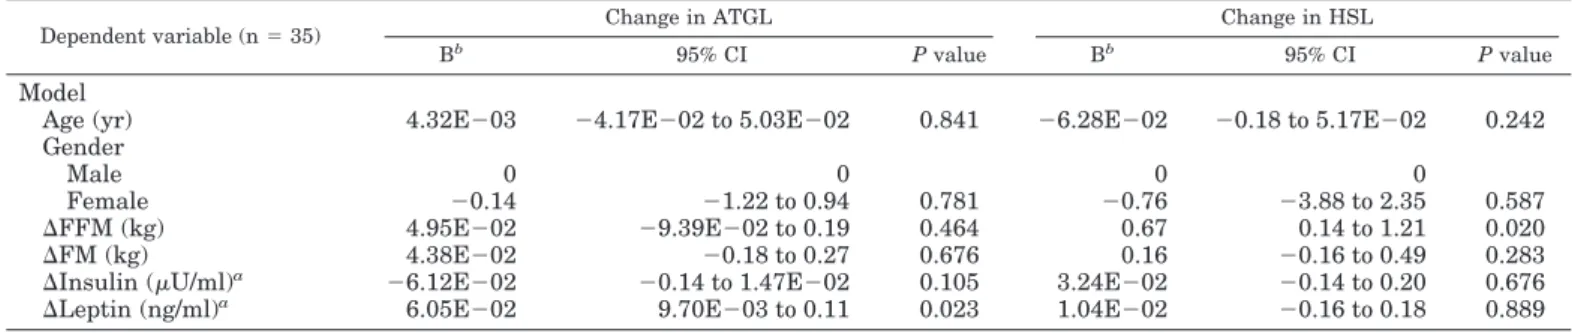
analysis was applied (Table 3). Univariate regression
anal-ysis indicated a positive correlation between the decrease in
leptin and the decrease in ATGL protein level after weight
reduction (P
⬍ 0.05), whereas age, gender, changes in body
composition (FM, FFM), and insulin were not significantly
related to changes in ATGL protein level (all P
⬎ 0.10).
Multivariate regression analysis (Table 3) indicated the same
positive correlation between the decrease in leptin and the
decrease in ATGL protein level after weight reduction (
-coefficient, 6.05
E-02; P
⫽ 0.023) (Table 3). In addition,
uni-variate regression analysis indicated a positive correlation
between the decrease in FFM and the decrease in HSL protein
level after weight reduction (P
⬍ 0.05), whereas age, gender,
changes in FM, circulating levels of insulin, and leptin were
not significantly related to changes in HSL protein level (all
P
⬎ 0.10). Multivariate regression analysis (Table 3) indicated
the same positive correlation between the decrease in FFM
and decrease in HSL protein level after weight reduction
(
-coefficient, 0.67; P ⫽ 0.020) (Table 3).
Finally, the correlation between ATGL and HSL protein
levels found during habitual dietary conditions was also
observed after a 10-wk hypocaloric diet (-coefficient, 0.99;
r
⫽ 0.484; P ⬍ 0.0001). Also, changes in ATGL and HSL
induced by weight loss highly correlated to each other
(-coefficient, 1.01; r
⫽ 0.503; P ⫽ 0.004) (Fig. 4). This
coordi-nated variation in ATGL and HSL expression during various
dietary conditions suggests that the two enzymes share a
common regulatory network.
ATGL and HSL mRNA expression after the diet
In line with the protein expression data, a 10-wk
hypoca-loric diet significantly lowered adipose tissue ATGL (P
⫽
0.001) and HSL (P
⫽ 0.007) mRNA expression (Fig. 3A).
Low-fat and medium-fat diets resulted in similar changes in
ATGL and HSL mRNA expression. A strong positive
cor-relation was found between ATGL and HSL mRNA
expres-sion after the diet (
-coefficient, 0.761, r ⫽ 0.578; P ⬍ 0.0001).
The changes in ATGL and HSL mRNA expression induced
by weight loss tended to correlate positively (P
⫽ 0.135).
Discussion
Our study, for the first time, examined the relationship
between adipose tissue ATGL and HSL mRNA and protein
expression and whole-body insulin sensitivity in a group of
obese subjects. The major finding of the present study is that
a reduced ATGL and HSL mRNA and protein expression is
associated with insulin resistance independent of FM.
Weight reduction decreased, rather than increased, ATGL
and HSL mRNA and protein expression. When ATGL and
HSL protein expression was corrected for mean FCV or FCW,
the differences between groups remained significant. In
ad-dition, ATGL and HSL mRNA and protein expression seem
to be tightly coregulated in adipose tissue, suggesting that
they belong to a common regulatory network.
Our data indicate that the degree of insulin resistance and
hyperinsulinemia in obesity rather than the increase in FM
and body fat distribution per se is associated with a reduced
ATGL and HSL protein and mRNA level. Because we only
A T GL pr otein expr ession
FIG. 2. Correlation between ATGL and HSL protein levels in sc ad-ipose tissue of overweight-obese subjects. ATGL and HSL protein levels were quantified by Western blot analysis (values are Adj.Vo-l.OD mm2). ATGL and HSL protein levels are entered after being ln-transformed.
FIG. 3. ATGL and HSL mRNA (A) and protein (B) expression before (black bars) and after (white bars) a 10-wk hypocaloric diet. A, The hypocaloric diet resulted in significantly decreased ATGL and HSL mRNA expression (n⫽ 26; #, P ⫽ 0.001; and ##, P ⫽ 0.007, respec-tively). mRNA levels were quantified by quantitative RT-PCR and normalized with 18S rRNA. B, In line, a significantly decreased ATGL and HSL protein expression was observed after the diet (*, P⫽ 0.04; and **, P⫽ 0.023, respectively). ATGL and HSL protein expression was quantified using Western blot, and expression was related to the structural protein-actin. Before vs. after using paired Student’s t test statistics. Values are mean⫾SEM.
studied expression in abdominal sc fat, we cannot rule out
depot-specific differences in ATGL and HSL expression. For
instance, it has been shown that HSL mRNA expression is
significantly different in sc and visceral adipose tissue, a
finding that could not be confirmed for ATGL mRNA
ex-pression (29). There is accumulating evidence from in vitro
and animals studies that insulin reduces HSL and ATGL
expression. It is documented that insulin down-regulates
ATGL and HSL mRNA levels in 3T3-L1 adipocytes in a
dose-dependent manner (19, 21, 22). More interestingly,
ATGL is down-regulated in a mouse model for insulin
re-sistance by 50% (7). In accordance, our data indicate a 72%
reduction in adipose tissue ATGL protein levels of IR
com-pared with IS obese subjects. Moreover, HSL mRNA levels
are increased in adipocytes from insulin-deficient
strepto-zotocin-treated rats compared with controls, suggesting a
negative effect of insulin on HSL expression (20).
Weight reduction decreased, rather than increased, ATGL
and HSL protein and mRNA expression levels with no effect
of diet composition and independent of changes in FM. This
seems consistent with Viguerie et al. (25) reporting a similar
decrease in HSL mRNA for the low-fat and medium-fat diets.
This down-regulation of key enzymes for triglyceride
break-down and the increase in lipoprotein lipase mRNA level after
weight loss (30) potentially enhances lipid storage and makes
additional weight loss more difficult. In contrast, Mairal et al.
(29) showed that adipose tissue ATGL mRNA expression
was unchanged and HSL mRNA expression increased after
long-term weight reduction in obese subjects. It should be
mentioned that, in this study, the second biopsy was taken
2– 4 yr after surgery. A factor explaining the inconsistent
findings may be that different conditions are compared. In
the present study, subjects were investigated while still on
the energy-restricted diet (second biopsy taken just at the end
of the diet). The negative energy balance produced by the
energy-restricted diet is known to modify profoundly
adi-pocyte metabolism, particular the lipolytic pathway, making
it impossible to differentiate between the chronic effect of
weight reduction per se and the acute effect of energy
re-striction. Interestingly, the decrease in leptin correlated
pos-itively with the decrease in ATGL expression after energy
restriction, independent of changes in FM, FFM, and
circu-lating insulin levels. Flier (31) advocate that this decrease in
leptin concentration serves as an important signal from fat to
the brain that the body is starving. In addition, it has been
proposed that an important function of leptin is to confine
storage of triglycerides to adipocytes (i.e. to affect adipose
tissue lipolysis) and to prevent triglyceride storage in
nona-dipocytes (e.g. myocytes), protecting them from lipotoxicity
(32).
In obese subjects, we observed no strict relationship
be-tween FM and ATGL or HSL expression, and fat cell size per
se was not important for our findings. When the obese state
has already developed, insulin resistance and
hyperinsulin-emia seem to be the major determinants for ATGL and HSL
protein expression. This seems in line with the observation
of a negative correlation between fasting insulin and in vivo
fatty acid outflow per unit of adipose tissue in IR conditions
(18), suggesting that a reduced expression of ATGL and HSL
may be a secondary phenomenon to insulin resistance. It can
be speculated that hyperinsulinemia may down-regulate
ad-ipose tissue lipolysis and thereby prevent worsening of the
IR state (33, 34). In the present study, weight loss had no
significant effect on insulin sensitivity. To fully elucidate the
effect of insulin resistance on ATGL and HSL expression, an
intervention should be performed that significantly improves
insulin sensitivity [e.g. exercise training or treatment with a
peroxisome proliferator-activated receptor-
␥ (PPAR-␥)
ago-nist]. It has been shown that ATGL is subject to transcriptional
control by PPAR-
␥-mediated signals (22). In addition, Festuccia
Change in A
TGL
FIG. 4. Correlation between change in ATGL and HSL protein levels after a hypocaloric diet. ATGL and HSL protein levels were measured before and after a 10-wk hypocaloric diet using Western blot analysis (values are Adj.Vol.OD mm2). The changes are calculated as follows for each individual: (protein level after the diet⫺ protein level before the diet)/protein level before the diet.
TABLE 3. Determinants of change in ATGL and HSL protein level after a 10-wk hypocaloric diet in multivariate regression analysis
Dependent variable (n⫽ 35) Change in ATGL Change in HSL
Bb
95% CI P value Bb
95% CI P value
Model
Age (yr) 4.32E⫺03 ⫺4.17E⫺02 to 5.03E⫺02 0.841 ⫺6.28E⫺02 ⫺0.18 to 5.17E⫺02 0.242 Gender
Male 0 0 0 0
Female ⫺0.14 ⫺1.22 to 0.94 0.781 ⫺0.76 ⫺3.88 to 2.35 0.587
⌬FFM (kg) 4.95E⫺02 ⫺9.39E⫺02 to 0.19 0.464 0.67 0.14 to 1.21 0.020 ⌬FM (kg) 4.38E⫺02 ⫺0.18 to 0.27 0.676 0.16 ⫺0.16 to 0.49 0.283 ⌬Insulin (U/ml)a ⫺6.12E⫺02 ⫺0.14 to 1.47E⫺02 0.105 3.24E⫺02 ⫺0.14 to 0.20 0.676
⌬Leptin (ng/ml)a 6.05E⫺02 9.70E⫺03 to 0.11 0.023 1.04E⫺02 ⫺0.16 to 0.18 0.889
CI, Confidence interval; E, exponent 10.
aValues are entered in the model after being ln-transformed. bUnstandardized-coefficient.
et al. (35) recently showed that treatment of mice with the
PPAR-
␥ agonist rosiglitazone significantly increased ATGL and
HSL mRNA expression, indicating that an improved insulin
sensitivity increases adipose tissue ATGL and HSL expression.
Finally, we cannot rule out that a decreased ATGL and HSL
expression is a primary defect in obesity. Interestingly,
ATGL-deficient mice have an increased fat storage in adipose and
nonadipose tissues (36). Furthermore, studies in first-degree
relatives of obese subjects have demonstrated an impaired
li-polytic function of adipocytes, suggesting also that primary
adipocyte lipolysis defects are present in obesity (13).
Expres-sion of HSL is markedly decreased in sc adipocytes and
dif-ferentiated preadipocytes from obese subjects, suggesting a
de-creased HSL expression to be a primary defect in obesity (11, 12,
16, 25). Also, several studies suggest that genetic variation in the
HSL and ATGL genes are associated with obesity and type 2
diabetes mellitus (37, 38). Additional research is needed to
elu-cidate the exact order of events.
The coregulation between ATGL and HSL protein levels or
mRNA expression (39) during different dietary conditions
suggests that the two enzymes belong to a common
regu-latory network with tight transcriptional control. A recent
study indicated that HSL is the major lipase catalyzing the
rate-limiting step in stimulated lipolysis, whereas ATGL
par-ticipates in basal lipolysis (39). Insufficient time has passed
since the discovery of ATGL to understand the nature of its
regulation. However, from the limited data available, it
ap-pears that, compared with HSL, ATGL is not a direct target
for protein kinase A-mediated phosphorylation and is
local-ized on the lipid droplet in the basal and hormone-stimulated
state of the cell (9). These observations suggest that ATGL is
not activated by phosphorylation and translocation to the
lipid droplet as demonstrated for HSL. Instead, an activator
protein regulates ATGL activity: CGI-58 (comparative gene
identification 58) (40, 41). It will be important to establish
whether the decreased HSL and ATGL protein and mRNA
expression observed in IR subjects is also accompanied by a
decreased activity of both enzymes.
In conclusion, ATGL and HSL expression are decreased in
the obese IR state. When the obese state has already
devel-oped, insulin resistance or hyperinsulinemia seem to be the
major determinant of ATGL and HSL protein expression
independent of FM. Conversely, there are also indications
that a reduced ATGL and HSL protein expression is a
pri-mary defect in obesity. Weight reduction decreased ATGL
and HSL expression, independent of circulating insulin and
FM, indicating that also other factors (e.g. leptin) relate to
ATGL and HSL protein expression in obese subjects.
Acknowledgments
Received June 20, 2006. Accepted March 1, 2007.
Address all correspondence and requests for reprints to: Dr. Johan W. E. Jocken, Department of Human Biology, Maastricht University, P.O. Box 616, 6200 MD Maastricht, The Netherlands. E-mail: j.jocken@hb.unimaas.nl.
This study has received support from NUGENOB (Nutrient-Gene Interaction in Human Obesity, Implications for Dietary Guidelines) sup-ported by the European Commission (Contract QLK1-CT-2000-00618), HEPADIP (Hepatic and Adipose Tissue and Functions in the Metabolic Syndrome) supported by the European Commission as an integrated
project under the 6th Framework Programme (Contract LSHM-CT-2005-018734), and Swedish Research Council Project 112 84.
Disclosure Statement: The authors have nothing to disclose.
References
1. Osuga J, Ishibashi S, Oka T, Yagyu H, Tozawa R, Fujimoto A, Shionoiri F,
Yahagi N, Kraemer FB, Tsutsumi O, Yamada N2000 Targeted disruption of hormone-sensitive lipase results in male sterility and adipocyte hypertrophy, but not in obesity. Proc Natl Acad Sci USA 97:787–792
2. Haemmerle G, Zimmermann R, Hayn M, Theussl C, Waeg G, Wagner E,
Sattler W, Magin TM, Wagner EF, Zechner R2002 Hormone-sensitive lipase deficiency in mice causes diglyceride accumulation in adipose tissue, muscle, and testis. J Biol Chem 277:4806 – 4815
3. Haemmerle G, Zimmermann R, Strauss JG, Kratky D, Riederer M, Knipping
G, Zechner R2002 Hormone-sensitive lipase deficiency in mice changes the plasma lipid profile by affecting the tissue-specific expression pattern of li-poprotein lipase in adipose tissue and muscle. J Biol Chem 277:12946 –12952 4. Mulder H, Sorhede-Winzell M, Contreras JA, Fex M, Strom K, Ploug T,
Galbo H, Arner P, Lundberg C, Sundler F, Ahren B, Holm C2003 Hormone-sensitive lipase null mice exhibit signs of impaired insulin sensitivity whereas insulin secretion is intact. J Biol Chem 278:36380 –36388
5. Harada K, Shen WJ, Patel S, Natu V, Wang J, Osuga J, Ishibashi S, Kraemer
FB2003 Resistance to high-fat diet-induced obesity and altered expression of adipose-specific genes in HSL-deficient mice. Am J Physiol Endocrinol Metab 285:E1182–E1195
6. Zimmermann R, Haemmerle G, Wagner EM, Strauss JG, Kratky D, Zechner
R2003 Decreased fatty acid esterification compensates for the reduced lipolytic activity in hormone-sensitive lipase-deficient white adipose tissue. J Lipid Res 44:2089 –2099
7. Villena JA, Roy S, Sarkadi-Nagy E, Kim KH, Sul HS 2004 Desnutrin, an adipocyte gene encoding a novel patatin domacontaining protein, is in-duced by fasting and glucocorticoids: ectopic expression of desnutrin increases triglyceride hydrolysis. J Biol Chem 279:47066 – 47075
8. Jenkins CM, Mancuso DJ, Yan W, Sims HF, Gibson B, Gross RW 2004 Identification, cloning, expression, and purification of three novel human calcium-independent phospholipase A2 family members possessing triacyl-glycerol lipase and acyltriacyl-glycerol transacylase activities. J Biol Chem 279:48968 – 48975
9. Zimmermann R, Strauss JG, Haemmerle G, Schoiswohl G,
Birner-Gruen-berger R, Riederer M, Lass A, NeuBirner-Gruen-berger G, Eisenhaber F, Hermetter A, Zechner R2004 Fat mobilization in adipose tissue is promoted by adipose triglyceride lipase. Science 306:1383–1386
10. Blaak EE, Van Baak MA, Kemerink GJ, Pakbiers MT, Heidendal GA, Saris
WH1994-Adrenergic stimulation of energy expenditure and forearm skeletal
muscle metabolism in lean and obese men. Am J Physiol 267:E306 –E315 11. Large V, Reynisdottir S, Langin D, Fredby K, Klannemark M, Holm C, Arner
P1999 Decreased expression and function of adipocyte hormone-sensitive lipase in subcutaneous fat cells of obese subjects. J Lipid Res 40:2059 –2066 12. Reynisdottir S, Wahrenberg H, Carlstrom K, Rossner S, Arner P 1994
Cat-echolamine resistance in fat cells of women with upper-body obesity due to decreased expression of 2-adrenoceptors. Diabetologia 37:428–435 13. Hellstrom L, Langin D, Reynisdottir S, Dauzats M, Arner P 1996 Adipocyte
lipolysis in normal weight subjects with obesity among first-degree relatives. Diabetologia 39:921–928
14. Blaak EE, Van Baak MA, Kemerink GJ, Pakbiers MT, Heidendal GA, Saris
WH1994-Adrenergic stimulation of skeletal muscle metabolism in relation to weight reduction in obese men. Am J Physiol 267:E316 –E322
15. Blaak EE, Wolffenbuttel BH, Saris WH, Pelsers MM, Wagenmakers AJ 2001 Weight reduction and the impaired plasma-derived free fatty acid oxidation in type 2 diabetic subjects. J Clin Endocrinol Metab 86:1638 –1644
16. Lofgren P, Hoffstedt J, Ryden M, Thorne A, Holm C, Wahrenberg H, Arner
P2002 Major gender differences in the lipolytic capacity of abdominal sub-cutaneous fat cells in obesity observed before and after long-term weight reduction. J Clin Endocrinol Metab 87:764 –771
17. Reynisdottir S, Langin D, Carlstrom K, Holm C, Rossner S, Arner P 1995 Effects of weight reduction on the regulation of lipolysis in adipocytes of women with upper-body obesity. Clin Sci (Lond) 89:421– 429
18. Karpe F, Tan GD 2005 Adipose tissue function in the insulin-resistance syn-drome. Biochem Soc Trans 33:1045–1048
19. Kralisch S, Klein J, Lossner U, Bluher M, Paschke R, Stumvoll M, Fasshauer
M2005 Isoproterenol, TNF␣, and insulin downregulate adipose triglyceride
lipase in 3T3–L1 adipocytes. Mol Cell Endocrinol 240:43– 49
20. Sztalryd C, Kraemer FB 1995 Regulation of hormone-sensitive lipase in strep-tozotocin-induced diabetic rats. Metabolism 44:1391–1396
21. Kim JY, Tillison K, Lee JH, Rearick DA, Smas CM 2006 The adipose tissue triglyceride lipase ATGL/PNPLA2 is downregulated by insulin and TNF-␣ in 3T3–L1 adipocytes and is a target for transactivation by PPAR␥. Am J Physiol Endocrinol Metab 291:E115–E127
22. Kershaw EE, Hamm JK, Verhagen LA, Peroni O, Katic M, Flier JS 2006 Adipose triglyceride lipase: function, regulation by insulin, and comparison with adiponutrin. Diabetes 55:148 –157
23. Petersen M, Taylor MA, Saris WH, Verdich C, Toubro S, Macdonald I,
Rossner S, Stich V, Guy-Grand B, Langin D, Martinez JA, Pedersen O, Holst C, Sorensen TI, Astrup A2006 Randomized, multi-center trial of two hypo-energetic diets in obese subjects: high- versus low-fat content. Int J Obes (Lond) 30:552–560
24. Tehard B, Saris WH, Astrup A, Martinez JA, Taylor MA, Barbe P, Richterova
B, Guy-Grand B, Sorensen TI, Oppert JM2005 Comparison of two physical activity questionnaires in obese subjects: the NUGENOB study. Med Sci Sports Exerc 37:1535–1541
25. Viguerie N, Vidal H, Arner P, Holst C, Verdich C, Avizou S, Astrup A, Saris
WH, Macdonald IA, Klimcakova E, Clement K, Martinez A, Hoffstedt J, Sorensen TI, Langin D2005 Adipose tissue gene expression in obese subjects during low-fat and high-fat hypocaloric diets. Diabetologia 48:123–131 26. Matthews DR, Hosker JP, Rudenski AS, Naylor BA, Treacher DF, Turner RC
1985 Homeostasis model assessment: insulin resistance and-cell function from fasting plasma glucose and insulin concentrations in man. Diabetologia 28:412– 419
27. Lofgren P, Andersson I, Adolfsson B, Leijonhufvud BM, Hertel K, Hoffstedt
J, Arner P2005 Long-term prospective and controlled studies demonstrate adipose tissue hypercellularity and relative leptin deficiency in the postobese state. J Clin Endocrinol Metab 90:6207– 6213
28. Large V, Arner P, Reynisdottir S, Grober J, Van Harmelen V, Holm C, Langin
D1998 Hormone-sensitive lipase expression and activity in relation to lipolysis in human fat cells. J Lipid Res 39:1688 –1695
29. Mairal A, Langin D, Arner P, Hoffstedt J 2006 Human adipose triglyceride lipase (PNPLA2) is not regulated by obesity and exhibits low in vitro triglyc-eride hydrolase activity. Diabetologia 49:1629 –1636
30. Kern PA, Ong JM, Saffari B, Carty J 1990 The effects of weight loss on the activity and expression of adipose-tissue lipoprotein lipase in very obese humans. N Engl J Med 322:1053–1059
31. Flier JS 2004 Obesity wars: molecular progress confronts an expanding epi-demic. Cell 116:337–350
32. Unger RH, Zhou YT, Orci L 1999 Regulation of fatty acid homeostasis in cells: novel role of leptin. Proc Natl Acad Sci USA 96:2327–2332
33. Lonnroth P, Digirolamo M, Krotkiewski M, Smith U 1983 Insulin binding
and responsiveness in fat cells from patients with reduced glucose tolerance and type II diabetes. Diabetes 32:748 –754
34. Arner P, Bolinder J, Engfeldt P, Hellmer J, Ostman J 1984 Influence of obesity on the antilipolytic effect of insulin in isolated human fat cells obtained before and after glucose ingestion. J Clin Invest 73:673– 680
35. Festuccia WT, Laplante M, Berthiaume M, Gelinas Y, Deshaies Y 2006 PPAR␥ agonism increases rat adipose tissue lipolysis, expression of glyceride lipases, and the response of lipolysis to hormonal control. Diabetologia 49: 2427–2436
36. Haemmerle G, Lass A, Zimmermann R, Gorkiewicz G, Meyer C, Rozman J,
Heldmaier G, Maier R, Theussl C, Eder S, Kratky D, Wagner EF, Klingenspor M, Hoefler G, Zechner R2006 Defective lipolysis and altered energy metab-olism in mice lacking adipose triglyceride lipase. Science 312:734 –737 37. Klannemark M, Orho M, Langin D, Laurell H, Holm C, Reynisdottir S, Arner
P, Groop L1998 The putative role of the hormone-sensitive lipase gene in the pathogenesis of Type II diabetes mellitus and abdominal obesity. Diabetologia 41:1516 –1522
38. Schoenborn V, Heid IM, Vollmert C, Lingenhel A, Adams TD, Hopkins PN,
Illig T, Zimmermann R, Zechner R, Hunt SC, Kronenberg F2006 The ATGL gene is associated with free fatty acids, triglycerides, and type 2 diabetes. Diabetes 55:1270 –1275
39. Langin D, Dicker A, Tavernier G, Hoffstedt J, Mairal A, Ryden M, Arner E,
Sicard A, Jenkins CM, Viguerie N, van Harmelen V, Gross RW, Holm C, Arner P2005 Adipocyte lipases and defect of lipolysis in human obesity. Diabetes 54:3190 –3197
40. Lass A, Zimmermann R, Haemmerle G, Riederer M, Schoiswohl G,
Schweiger M, Kienesberger P, Strauss JG, Gorkiewicz G, Zechner R2006 Adipose triglyceride lipase-mediated lipolysis of cellular fat stores is activated by CGI-58 and defective in Chanarin-Dorfman Syndrome. Cell Metab 3:309 – 319
41. Schweiger M, Schreiber R, Haemmerle G, Lass A, Fledelius C, Jacobsen P,
Tornqvist H, Zechner R, Zimmermann R2006 Adipose triglyceride lipase and hormone-sensitive lipase are the major enzymes in adipose tissue triacylglyc-erol catabolism. J Biol Chem 281:40236 – 40241
JCEM is published monthly by The Endocrine Society (http://www.endo-society.org), the foremost professional society serving the endocrine community.