HAL Id: halshs-02019063
https://halshs.archives-ouvertes.fr/halshs-02019063
Preprint submitted on 14 Feb 2019
HAL is a multi-disciplinary open access archive for the deposit and dissemination of sci-entific research documents, whether they are pub-lished or not. The documents may come from teaching and research institutions in France or abroad, or from public or private research centers.
L’archive ouverte pluridisciplinaire HAL, est destinée au dépôt et à la diffusion de documents scientifiques de niveau recherche, publiés ou non, émanant des établissements d’enseignement et de recherche français ou étrangers, des laboratoires publics ou privés.
developing countries?
Jean-Louis Combes, Alexandru Minea, Pegdéwendé Nestor Sawadogo
To cite this version:
Jean-Louis Combes, Alexandru Minea, Pegdéwendé Nestor Sawadogo. Does the composition of gov-ernment expenditures matter for sovereign bond spreads’ evolution in developing countries?. 2019. �halshs-02019063�
SÉRIE ÉTUDES ET DOCUMENTS
Does the composition of government expenditures matter for
sovereign bond spreads’ evolution in developing countries?
Jean-Louis Combes
Alexandru Minea
Pegdéwendé Nestor Sawadogo
Études et Documents n° 6
February 2019
To cite this document:
Combes J.-L., Minea A., Sawadogo P. N. (2019) “Does the composition of government
expenditures matter for sovereign bond spreads’evolution in developing countries?”, Études et
Documents, n° 6, CERDI.
CERDI POLE TERTIAIRE 26 AVENUE LÉON BLUM F- 63000 CLERMONT FERRAND TEL.+33473177400 FAX +33473177428 http://cerdi.uca.fr/2
The authors
Jean-Louis Combes
Professor
Université Clermont Auvergne, CNRS, IRD, CERDI, F-63000 Clermont-Ferrand, France.
Email address:
j-louis.combes@uca.fr
Alexandru Minea
Professor
Université Clermont Auvergne, CNRS, IRD, CERDI, F-63000 Clermont-Ferrand, France.
Email address:
alexandru.minea@uca.fr
Pegdéwendé Nestor Sawadogo
PhD Student in Economics
Université Clermont Auvergne, CNRS, IRD, CERDI, F-63000 Clermont-Ferrand, France.
Email address:
pegdewende_nestor.sawadogo@etu.uca.fr
Corresponding author: Pegdéwendé Nestor Sawadogo
This work was supported by the LABEX IDGM+ (ANR-10-LABX-14-01) within the program “Investissements d’Avenir” operated by the French National Research Agency (ANR).
Études et Documents are available online at:
https://cerdi.uca.fr/etudes-et-documents/
Director of Publication: Grégoire Rota-Graziosi
Editor: Catherine Araujo-Bonjean
Publisher: Mariannick Cornec
ISSN: 2114 - 7957
Disclaimer:
Études et Documents is a working papers series. Working Papers are not refereed, they constitute research in progress. Responsibility for the contents and opinions expressed in the working papers rests solely with the authors. Comments and suggestions are welcome and should be addressed to the authors.
3
Abstract
This paper evaluates the effects of public expenditures on sovereign bond spreads in emerging
market countries. Specifically, the paper explores empirically how country risk, as proxied by
sovereign bond spreads, is influenced by the different types of government expenditures
(namely current spending, public investments, spending on education, health, social
protection, economic affairs and defense) and country-specific fundamentals. Using panel
data from emerging market countries, we find that governments can improve their borrowing
conditions in international financial markets by heightening public investment and managing
their current spending. In accordance with the empirical literature on the determinants of
spreads, we find that country-specific fundamentals are also important determinants of
spreads. Further, we find evidence that financial markets’ reaction to public expenditures
depends on government effectiveness.
Keywords
Government expenditures, Sovereign bond spreads, Emerging market, Government
effectiveness.
JEL Codes
H50, H63, G12.
I. Introduction
Access to capital in the international financial markets is necessary for developing countries (DCs) who strongly aspire to develop investment and accelerate growth. According to the efficient market theory, this access is influenced by economic fundamentals (inflation, growth, deficits … etc.) as investors exploit all the available information about factors that may affect these countries’ default risk. Then this access can be hinder by the behavior of DCs in terms of public expenditures. From the 1980s sovereign debt crisis, investors lowered purchases of securities issued by DCs owing to their high risks. In doing so, they demand a high yield for holding debt instruments issued by DCs. The Bretton woods institutions constantly required for DCs to direct their public expenditures towards positive externalities generating activities (health, education, infrastructures…).
An important issue is to know how different types of public expenditures namely current spending, public investment and spending on education, health, social protection, economic affairs, defense affect sovereign bonds spreads. This paper aims to quantify the effects of changes in the composition of public spending on sovereign bonds spreads.
Researches on the link between fiscal policy and sovereign bonds spreads reach different conclusions. Some authors find that fiscal variables (Current Account/GNP, Debt/GNP) have significant effect on sovereign bonds spreads (Edwards, 1984; Min, 1998) while others find they have no effects on spreads (Akitoby and Stratmann, 2008; Gupta and al., 2008). The originality of our analysis is that it looks at the effect of the composition of public expenditure on sovereign bond spreads. To better capture compositional effects of public spending, we report each type of expenditure on total public expenditure. Then, we will see how sovereign borrowers can influence their access to international financial markets according to the type of expenditure that dominates in the state budget.
We contribute to this debate by investigating how the composition of public spending (current spending to total expenditure, public investment to total expenditure and spending on education, health, social protection, economic affairs, and defense) affects sovereign spreads.In fact, public expenditures have different returns (productive or unproductive), which is why their effects on growth are different (Aschauer, 1989; Aschauer, 1990; Munnell, 1990; Ford and Poret, 1991; Costa et al., 1987; Garcia-Milà and McGuire, 1992; Easterly and Rebelo, 1993; Tatom, 1991; Evans and Karras, 1994, Sturm and De Haan, 1995, Hurlin and Minea, 2013, etc.). In doing so, they affect the "fundamentals" that determine market sentiment in relation to sustainability and the dynamics of the debt (spread). Although we focus on public expenditures’ flows, our work is closely linked to those of Aschauer (1989, 1990). For instance, in his seminal paper,
Aschauer (1989) reveals that nonmilitary public capital stock strongly affects productivity as compared to military spending. He also finds that a “core” infrastructure (comprising streets and highways, airports, electrical and gas facilities, mass transit, water systems and sewers) mostly explains productivity in the US
during the period span from 1949 to 19851. This latter result is consistent with the extension to a panel of
the G-7 industrial countries (Aschauer, 1990). Several studies confirm Aschauer’sfindings (Munnell, 1990; Ford and Poret, 1991; Costa et al., 1987; Garcia-Milà and McGuire, 1992; Easterly and Rebelo, 1993; etc.).
However, Tatom (1991) claim that their estimates are suspect as they do not take account for (i) relative price of energy, (ii) time trend and notably (iii) non-stationarity of their variables. All these problems lead to spurious estimates that overstate the effect of public capital on productivity. In the same vein, Evans and Karras (1994) establish no evidence that government capital is productive and underprovided in a panel of seven countries2 including the US3. Furthermore, Sturm and De Haan (1995) check for the soundness of Aschauer (1989)’s econometric method and reach the conclusion that it is not well founded. In fact, as soon
as variables used are neither stationary nor cointegrated, level estimations are not suited. Indeed, they use first differences estimates and find peculiar results4. Given this uncertainty, Hurlin and Minea (2013)
question the reliability of the production function in estimating the genuine rate of return on public infrastructures. Their results suggest that the best empirical strategy to estimate government capital productivity consist to remove the common stochastic trends from only non-stationary independent variables5. Otherwise, we investigate isolated effect for each of these types of expenditures on sovereign
spreads. What type of expenditure does mostly affect sovereign risk6?
Furthermore, we investigate a possible non-linear effect of public expenditures on sovereign bonds spreads. We study the nonlinearity of public spending in relation to the quality of institutions because it is assumed that sovereign bond spreads depend on the quality of public spending and that this latter depends on institutional quality. Several empirical evidences emphasize that quality of institutions is the main drivers of growth in developing countries (Acemuglu et al., 2002; Easterly et al., 2002; Rodrik et al., 2002). Good institutions can therefore promote access to capital by developing countries through the growth they generate. Is institutional quality able to reverses the link between public spending and sovereign spreads in developing countries? Under what conditions will public spending reduce the sovereign spreads of these countries? We use alternative econometric methodsto deal with this topic.
We find that composition of public spending, unlike their level, is important in the evolution of sovereign spreads. Increasing the share of public investment in the state budget favors access to capital markets while the opposite occurs with current expenditure. We also highlight a nonlinear relationship between public spending and spreads. The relationship between public spending and spreads thus depends
1 This corroborate results of an earlier work by Ratner (1983).
2 These countries are Belgium, Canada, Finland, Germany, Greece, the UK and the US. Remark that this paper is written under the Clinton Administration which undertaken a large increase in public investment on the grounds that government capital is highly productive and underprovided in the US.
3 Note that Evans and Karras (1994) find a statistically significant effect of government capital on productivity when there are some misspecifications in the production function leading to ignore time effects in productivity growth as in Aschauer (1990).
4 Their results show a negative private capital elasticity and labour elasticity superior to unity, both in the US and the Netherlands (1945-1985). 5 This finding is at odd both for Aschauer (1989) and Tatom (1991) who differentiate all variables (regressand and all regressors) in his model. 6 Sovereign risk refers to the probability that a State will not be able to meet its financial commitments on time.
on the quality of governance measured by government effectiveness, political stability and control of corruption.
Our findings suggest that developing countries can have better access to financial markets even without reducing their total public expenditure. They must both improve the quality of governance and reorient public spending by giving more importance to public investment than to current expenditure.
The remainder of this paper is organized as follows. Section 2 lay out the literature review on sovereign spreads’ determinants in DCs. The underlying theoretical model and analytical structure is outline in section 3. The fourth section describes data used for empirical analysis and presents estimation results. Particular attention is paid for robustness analysis of our obtained results. Lastly, in conclusion section, major policy implications of our findings are discussed.
II. Literature review
Various studies on the determinants of sovereign bonds spreads emphasize the importance of country specific factors. Indeed Edwards (1984), in a seminal paper, finds that external debt and debt service are the key determinants of spreads follow-up by current account, international reserves and the investment ratio for a given country. In the same vein, Min (1998) underscores the significance of a set of macroeconomic variables such as inflation, foreign assets, terms of trade and real exchange rate in the determination of spreads. Besides, Fouejieu and Scott (2013) estimating the effects of inflation targeting (IT) on spreads, find that countries which have introduced inflation targeting experience low bonds spreads compared to the others one. They argue that this difference is due to the fact that inflation targeters have a greater stability and pre-visibility in terms of inflation in the long run. This result is proved by Balima et al. (2017) who show that IT matters for lower spreads, but this favorable effect is sensitive to countries several structural characteristics. So, Rowland and Torres (2004) argue that creditworthiness is crucial in fixing emerging countries’ sovereign debt cost. The review of three perspectives on country risk, namely debt intolerance, original sin, and currency mismatches, leads Bario and Packer (2004) to assert that good domestic macroeconomic and structural policies are essential for country risk management. The determinants of sovereign bonds spreads depend on either we are in short run or in long run. Indeed, Bellas et al. (2010) find that fundamentals are significant determinants of emerging market spreads in the long run, while financial volatility is a more important determinant of spreads in the short run. They show also that political risk is an important long-term determinant of sovereign bond spreads in emerging markets countries (by impacting the ability of governments to repay their bondholders). From the point of view of
Ferrucci (2003), market spreads broadly reflect fundamentals, as well as non-fundamental factors (capital market imperfections, such as higher investor risk appetite resulting from lower global interest rates) in emerging markets economies between 1995 and 1997. Finally, Eichengreen and Mody (1998) find that market sentiment has played a crucial role in spreads movements over 1991-1997 in emerging countries.
They argue that changes in observable issuer characteristics and in the responsiveness of spreads and issues to those characteristics do not provide an adequate explanation for changes overtime in the value of new bond issues and launch spreads.
A second strand of literature have investigated the short-term effects of fiscal policy (Keynesian or non-Keynesian effects of public expenditures, the method of financing, etc.). Several researchers have oriented their studies in this way (Giavazzi et al., 2000; Gupta et al., 2008; Akitoby and Stratmann, 2008; Alesina et al., 2002; Corsetti and Meier, 2009). For instance, a fiscal effort imputed to reduce unproductive public expenditures can increase the expected growth, namely a twofold positive effect in relation to which financial markets would be less stringent in terms of risk premia. As for Akitoby and Stratmann (2008), they find that budget composition is important given that achieving the budget consolidation’ goal by expenditures-based adjustment is associated to low spreads compared to revenue-based adjustment. Alesina et al. (2002) also analyze the effects of public expenditures on private investment in OECD’ countries and find that low public expenditures can involve high investment and economic growth throughout low capital taxes. The significance of these effects will depend on the transient or permanent nature of changes in public expenditures (Corsetti and Meier, 2009). Moreover, Giavazzi et al. (2000) and Gupta et al. (2005) underline that fiscal consolidation considerably reduce credit spreads especially in countries which have poor initial fiscal conditions. Then the composition of fiscal policy is determinant: a high public investment contributes to reduce spreads if this one does not increase fiscal deficit. In their study on the effects of fiscal policy on investment in OECD countries (1960-1996), Alesina et al. (2002) find a negative effect of public spending on profits and private investment. They explain this result by the fact that state hires crowd out those in the private sector through upward pressure on wages. These authors seek to know how different types of public spending influence profits and investments through their effect on private sector’s wages. They use a model with a competitive and unionized labor market. Furthermore, Alesina et al. (1998) conclude in a study on the economic effects of fiscal adjustment that all adjustments are not recessive. Some adjustments are recessive, and others are not. Working on data from 19 OECD countries from 1960 to 1995, they define two types of budgetary adjustments: type 1 adjustments consisting of a reduction in current expenditure and a type 2 adjustment based on both higher taxes and lower public investment. The main channels through which fiscal adjustments are transmitted to the economy are the labor market, the effects of expectations and the effects of credibility. According to these authors, only type 1 adjustments are expansionist. However, Schclarek (2007), using a mixed sample of 40 countries including 19 developed and 21 developing countries, shows a positive effect of expansionary fiscal policy on private consumption over the period 1970 to 2000. In the same line, Devarajan et al. (1996), investigate the composition of public spending on growth and show that current spending positively affects growth of 43 developing countries while the effect of investment spending is negative. They justify this result by the fact that there is an excess
of investment expenditure in developing countries, which makes these public expenditures unproductive through diminishing marginal returns. This may be explained by the existence of nonlinear effects of current spending and public investment with economic growth.
A last strand of literature which have concerned with the interactions between fiscal policy and political institutions unanimously conclude that high-quality institutions are fundamental for implementing sound fiscal policies. In this regard, Prakash and Cabezon (2008) as well as Dabbla-Norris et al. (2010)
show that the more the budget is transparent, and institutions are high quality, the less there are public deficits in Low-income countries. Government effectiveness is noticed as a fundamental determinant of spread for emerging markets(Eichler, 2014) and more specifically inLatin American countries (Martinez et al., 2013) as well as inflation, terms of trade ratio, external debt and currency reserves. In the same vein
Baldacci et al. (2011) analyze the main factors that explain country risk in a sample of 46 countries, over the period 1997-2008 and conclude that low country risks involve low spread particularly during financial crisis wherein markets are more sensitive to institutional instability. These authors find additionally that fiscal variables are important in determining spreads: countries which have the highest debts and/or deficits have high spreads. Furthermore, Faria et al. (2006) emphasize the importance of institutional factors in the determination of capital markets’ access during previous periods of globalization. Similarly,Gelos et al. (2011) point out country’s vulnerability to shocks and the quality of policies and institutions as the main
factors that determine market access by developing countries. They also make evidence that market access is not influenced by a country’s frequency of defaults. Focusing on financial cost of governments’ opacity,
Arbatli and Escolano (2012) argue that fiscal transparency is related with better rating. In short, Glennerster and Shin (2008) show that countries which have introduced IMF fiscal transparency reforms have later experienced low sovereign bonds spreads. Investigating on « The price of democracy » in developing countries, Block and Vaaler (2004) indicate that agencies and bondholders view elections negatively, increasing the cost of capital to developing democracies. They find that credit rating agencies downgrade developing countries’ ratings and that bond spreads is significantly higher approximately two months before an election. The combination of human capital and institutional quality has been a key determinant of emerging market countries’ ability to attract international investors during the previous waves of financial globalization, namely since 1870 (Faria et al., 2006). Alfaro et al., 2005a, 2005b) and Wei (2005) work on cross-section data of several mixed countries in the period 1970 to 2000 and provide evidence that the institutional quality of the host country is a key determinant of international capital flows over the long run. Using OLS and Heckman selection’s model, Ciocchini et al. (2003) highlights that more corrupt countries must pay a higher risk premium when issuing bonds because the global bond market ascribes a significant cost to corruption. Then, higher corruption increases borrowing costs on the international market for both government and firms in developing countries. Finally, Arezki and Brükner (2012) shed light on the fact
that commodity price boom lowers spread in democraties while their highers them in autocraties in a sample of 38 emerging market economies over the period 1970-2007.
The analysis model used in this paper come from sovereign risk spreads theory (introduced by
Edwards, 1984 and used by Eichler, 2014;Gupta et al., 2008;Akitoby and Stratmann, 2008, etc.) as well as the discussion on which there would be “keynesian” or “non-keynesian” effects of public expenditures increase in an economy (Alesina et al., 1998; Alesina et al., 2002; Schclarek, 2007; Devarajan et al., 1996, etc.). According to whether the increase of different types of public expenditures is expansionist or not, their effects on factors’ productivity is different and then, their effects on spreads will be different.
In order to test the hypothesis according to which public spending has a different effect on spreads, we focus on different components of public spending: current spending as a ratio of total expenditure, public investment as a ratio of total expenditure, total expenditure as share of gross domestic product (GDP), spending on education, health, social protection, economic affairs and spending on defense7. We control
the robustness of our results by applying several alternative estimation tools. This allowus to compare our results with those obtained in the literature(Eichler, 2014;Gupta et al., 2008;Akitoby and Stratmann, 2008; …etc.).
We also investigate the existence of a possible non-linear effect between public spending and sovereign spreads. Is there a threshold effect of government expenditures on spreads in relation to the quality of governance?
III. Basic model specification
We adopt the standard empirical spread model used by many authors such as Edwards (1984), Baldacci et al. (2011), Martinez et al. (2013), etc. The baseline model is as follows:
𝐿𝑜𝑔(𝑒𝑚𝑏𝑖𝑔)𝑖𝑡 = 𝛼𝑖+ 𝛽𝑋𝑖𝑡+ 𝜆𝑡+ 𝜀𝑖𝑡 (1)
with (𝑒𝑚𝑏𝑖𝑔)𝑖𝑡 the sovereign spread. This is taken in natural logarithm to reduce the problem of
heteroscedasticity even though this problem is less severe on annual data (compared to monthly and daily data); 𝑋𝑖𝑡 represents a vector of explanatory variables; 𝛼𝑖 and 𝜆𝑡are respectively individual and temporal specific effects, and𝜀𝑖𝑡an error term.
The spread of a government bond is calculated as the differential of the premium paid by that State to it holder in relation to US government bond (considered as risk-free) with similar characteristics.
7 We use unadjusted public spending in the business cycle because, as pointed out by Alesina et al. (1998), it is difficult for economic agents to distinguish discretionary expenditures from cyclical effects of the budget. Moreover, there is no agreement between professional economists in this field.
The vector of explanatory variables comprises various components of public expenditure (current spending, public investment, total expenditure, spending on education, health, social protection, economic affairs and defense) and other control variables.
Current expenditure is expenditure on goods and services (including wage bill) consumed within the current year in order to sustain the production. It includes final consumption expenditure, property income paid, subsidies and other current transfers (e.g., social security, social assistance, pensions and other welfare benefits)(IMF and OECD, 2002). It is expressed here as share of total spending.
Public investment or “productive”8 government spending covers general government gross fixed
capital formation. The general government comprises central and subnational governments, but excludes other public entities, such as state-owned enterprises and public-private partnership arrangements (IMF, 2015).This variable is also expressed here as share of total spending
Current spending is assumed to increase sovereign spreads by crowding out private investment and thus reducing growth. Public investment stimulates growth in a given country (see Barro, 1990) and will therefore reduce sovereign spreads. But they can also crowd out private investment and increase spreads. Moreover, as noted by Devarajan et al. (1996), misallocating public expenditures in favors of capital expenditure at expense of current spending can create adverse effect. This is supported by the fact that several components of current spending (compensation of employees, uses of good and services …etc.) support financing human capital. Indeed, the knowledge and skills that individuals possess directly increase productivity and increase the ability of an economy to develop and adopt new technologies. The expected sign of total spending is, a priori, ambiguous. Neoclassical theory states that any increase in public spending would crowd out private spending. The intervention of the State in the economy is thus ineffective in this vision. Conversely, the Keynesian vision of the economy emphasizes that public spending has a multiplier effect: the increase in public spending would stimulate aggregate demand and thus the national income. The increase of public expenditures can also be either directly productive or increases the productivity of private spending.
Based on the determinants of spreads’ literature, we control for the following variables:
(i) The growth rate of gross domestic product (GDP growth), which controls the economic cycle and monetary conditions. This variable is assumed to have a negative effect on spreads. Indeed, economies with high GDP growth rate can easily repay their borrowing compared to countries with low GDP growth rate.
(ii) The inflation rate (inflation) which is the basic indicator of macroeconomic stability. It positively affects spreads, as, for example, monetary financing of the budget deficit can lead to
8 We define productive public expenditure as the public expenditure that comes into the production function (public investment). It is therefore spending that reinforces growth as well as the positive effects of fiscal policy (transport infrastructures,electrical and gas facilities, mass transit, water systems, telecommunications, etc.).
high levels of inflation, which increase the cost of capital (equipment, etc.). This is taken in logarithm [Log (1 + inflation)].
(iii) The ratio of debt to gross domestic product (Debt). It is recognized that a high debt ratio increases, all other things being equal, the risk of default and therefore the spreads. This can be explained by the fact that a country that is heavily indebted will spend more money on debt service payments9.
(iv) The payment defaults (Debt default). It is a dummy variable that is worth 1 if a country has failed or restructured its debt (which disadvantages investors) in a given year and 0 otherwise. According to Reinhart et al. (2003) a country may be the victim of "debt intolerance10" when it
fails at least once in its history (i.e. a serial defaulter). The lack of payment further weakens its institutions (budgetary and financial institutions) and makes them less able to cope with possible debt problems and future defaults. A country can sustainably emerge from debt intolerance if it reduces both its public and external (public and private) debt (Reinhart and Rogoff, 2008). Defaulting countries are penalized in financial markets by high spreads.
(v) Terms of trade. The sign of this variable on sovereign spreads is expected to be negative. Indeed, a change in the terms of trade resulting from a change in export market prices (an increase of demand for domestic products on the international market) reduces spreads. In this case, the increase in the terms of trade allows the country to obtain foreign currency to pay for its debt service, thus reducing the risk of default.
(vi) The total currency reserves in months of imports. This variable is considered by the IMF as an appropriate indicator for reserve needs for countries with limited access to capital markets. It is expected to negatively affect bond spreads. It measures the country's ability to repay foreign debt denominated in foreign currencies. The higher the ratio of reserves in months of imports is; the lower are bond spreads, ceteris paribus.
(vii) The FDI net inflows as share of GDP that measures the capacity of a given country to attract foreign investors. Theoretically, this variable negatively affects sovereign spreads insofar as private investment would help to improve macroeconomic indicators such as employment, growth and to some extent external equilibrium.
(viii) A composite index (index) which captures the governance quality. It represents a simple average of seven ICRG indicators11. This variable is supposed to reduce sovereign bond spreads
as sound institutions reinforce investors’ confidence towards a given country.
9 Debt service is the total government expenditure on debt repayment (principal + interest), often expressed as a percentage of GDP.
10 Debt intolerance is the inability of emerging markets to manage levels of external debt that would be manageable for developed countries under the same circumstances (Reinhart et al., 2003).
11 These indicators are: government stability, internal and external conflict, corruption, military in politics, religious and ethnic tensions and democratic accountability.
IV. Empirical analysis 1. Data and stylized facts
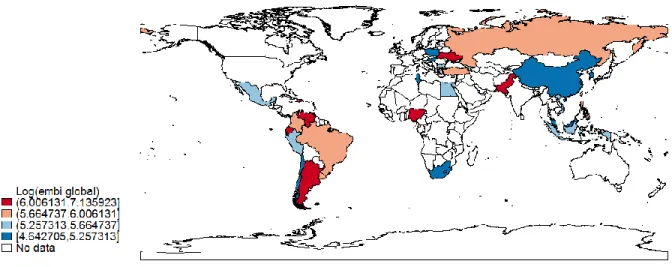
We use a panel of 30 emerging countries, all of which are part of the JP Morgan Emerging Market Bond Index Global (EMBIG). Our data are of annual frequency and span from 2000 to 2013.
Data on sovereign bond spreads come from The World Bank. The JP Morgan EMBIG includes all sovereign foreign debt instruments issued by emerging countries. These instruments include international borrowings denominated in US dollars such as Brady bonds, loans and Eurobonds with a face value of at least US$ 500 million and a maturity of 12 years.
Data on government expenditures and selected macroeconomic variables (growth of gross domestic product, inflation rate, debt and terms of trade) are derived from the IMF's World Economic Outlook database. Sovereign default data stem from Reinhart and Rogoff revised database (2009). Finally, data on all other control variables come from World Development Indicators, Worldwide Governance Indicators, ICRG and the World Bank Database of Political Institutions.
The choice of our homogenous sample of emerging countries is dictated by the availability of data on both spreads and various independent variables. Moreover, our choice to work on EMBIG is due to the fact that it includes several external debt instruments and covers, among the index published by JP Morgan, a large number of emerging countries.
The following figure depict the average evolution of EMBIG over the period 2000 and 2013 in DCs. As we can observe, EMBIG is lower in Asia countries relative to the rest of the world.
Table 1 contains the list of variables used in this paper and a brief description of the data12. We also
note that we tested the stationarity of the all variables in the model (see table 9 in the appendix). They are all stationary in level.
Table 1: Descriptive statistics for main variables
Variable name count Mean Sd Min Max
Log (embig) 347 5.698198 .8323937 3.250815 8.662101 GDP growth 364 4.509779 3.808713 -14.8 33.73577 Inflation rate 353 .0690067 .0658476 -.0172513 .6734245 Reseves months 362 5.656501 3.259067 .4167565 19.01295 Debt to GDP 364 48.28221 30.59699 3.9 181.9 Debt default 364 .0521978 .2227319 0 1 FDI inflows 364 3.760869 3.463629 -2.75744 30.99529
Current spending/Total spending 364 83.60862 9.537809 49.80733 100
Public investment/Total spending 363 15.30528 9.24079 0 40.69975
Total expenditure/GDP 364 29.29719 8.009214 14.72533 51.12439
Sources: IMF, World Bank, Reinhart and Rogoff (2009)
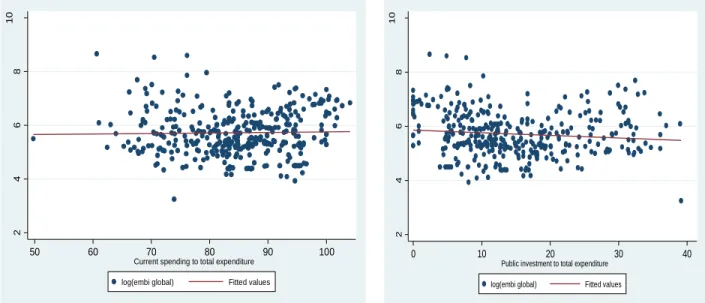
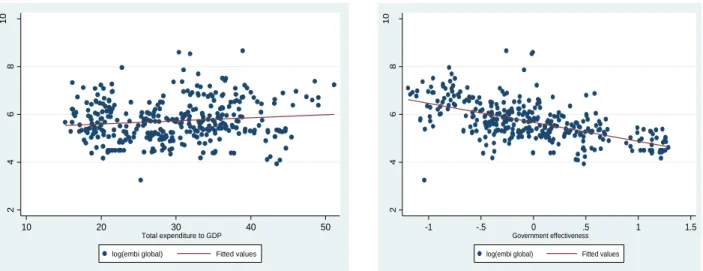
In figure 2 &3, we outline the relation between sovereign bonds spreads and various types of public expenditure. Public investment is negatively related to spreads while current spending and total expenditure have a positive relationship with spreads. Government expenditures on education, health and economic affairs seem to reduce bond spreads.
12 Table 10 in the appendix presents the matrix of correlation of the variables studied.
2 4 6 8 10 50 60 70 80 90 100
Current spending to total expenditure log(embi global) Fitted values
2 4 6 8 10 0 10 20 30 40
Public investment to total expenditure log(embi global) Fitted values
Figure 2: Emerging markets spreads and selected Fiscal and political variables
Figure 3: Emerging markets spreads and functional repartition of government expenditures
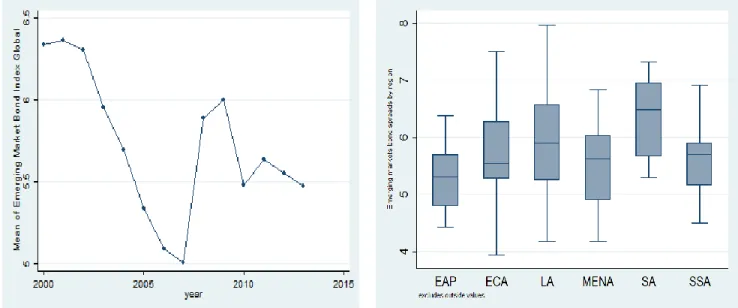
The evolution of emerging markets spreads (Figure 4) shows us that they fell from 2000 to 2007 when they reached their lowest level. They rose in the aftermath of the global crisis of 2008, before a phase of decline since 2009. So, does global crisis make any difference in the relationship between government expenditures and sovereign bond spreads? Latin America area is more affected by bonds spreads increases during this period.
2 4 6 8 10 10 20 30 40 50 Total expenditure to GDP log(embi global) Fitted values
2 4 6 8 10 -1 -.5 0 .5 1 1.5 Government effectiveness log(embi global) Fitted values
2 4 6 8 10 0 10 20 30 40 Education spending to total expenditure
log(embi global) Fitted values Scatterplot and OLS fitted line
2 4 6 8 10 0 5 10 15 20
Health spending to total expenditure log(embi global) Fitted values Scatterplot and OLS fitted line
2 4 6 8 10 0 10 20 30 40 50 Social protection spending/total expenditure
log(embi global) Fitted values Scatterplot and OLS fitted line
2 4 6 8 10 0 5 10 15 20 25 Defense spending to total expenditure
log(embi global) Fitted values Scatterplot and OLS fitted line
2 4 6 8 10 0 20 40 60
Economic Affairs to total expenditure log(embi global) Fitted values Scatterplot and OLS fitted line
2 4 6 8 10 3 4 5 6 7
Composite index of governance quality log(embi global) Fitted values Scatterplot and OLS fitted line
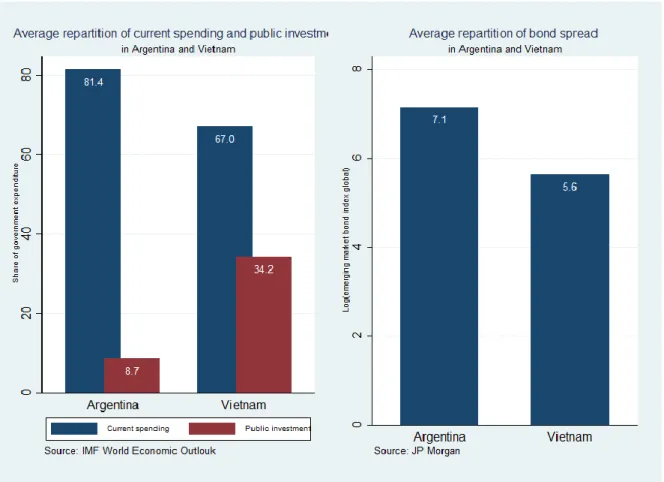
Figure 4: Evolution of emerging market bond index over time and bonds spreads repartition by country group Countries that experience an important part of current spending as share of total spending are those who have the highest bond spreads. The comparison between Argentina and Vietnam (figure 5) give a highlight on this element. In fact, Argentina and Vietnam (both emerging countries) have different evolution in their bond spreads. While the spreads of Argentina reach a value of around 1384 basis point, Vietnam realize a bond spreads of 304 basis point. At the same time, the composition of government expenditure differs in these two countries. Current spending represents 81.4 per cent of total expenditure in Argentina (8.7 per cent for public investment) while it constitutes 67 per cent of total expenditure in Vietnam (34.2 per cent goes to public investment). However, the level of public spending between these two countries is not very different (34 percent of GDP for Argentina and 27 percent of GDP for Vietnam). Then it clearly means that composition of government spending matters for bond spreads amount.
The evolution of emerging markets index and public investment is negative. Bond spreads are high when public investment is low and vis-versa (figure 6). Figure 6 also show that sovereign bonds spreads evolve in the opposite direction with the quality of governance.
Figure 5: Composition of government expenditures and bonds spreads in Argentina and Vietnam (2004-2013)
2. Empirical results
a. Effects of government spending on sovereign spreads
We suspect potential endogeneity in the model that could bias the results of our estimates. Inverse causality is a primary source of endogeneity. For example, a country might change its public spending behavior following an increase in risk premiums on the holding of its bonds issued. Also, some factors are not taken into account (such as the expectations of economic agents) can affect both bonds spreads and public spending of a country.
In order to address these endogeneity problems, we estimate model (1) using a panel data instrumental variable approach. To check for the robustness of our estimation, we run our model using Blundell-Bond method. The implementation of this dynamic method is motivated by inertia in bond spreads. Table 2 presents the results of these estimates.
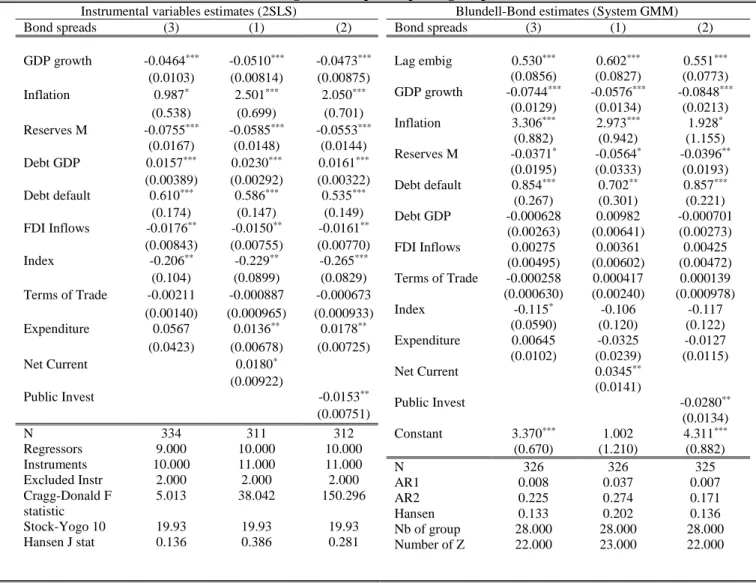
Table 2: Baseline regressions of public spending on spreads
Instrumental variables estimates (2SLS)
Bond spreads (3) (1) (2) GDP growth -0.0464*** -0.0510*** -0.0473*** (0.0103) (0.00814) (0.00875) Inflation 0.987* 2.501*** 2.050*** (0.538) (0.699) (0.701) Reserves M -0.0755*** -0.0585*** -0.0553*** (0.0167) (0.0148) (0.0144) Debt GDP 0.0157*** 0.0230*** 0.0161*** (0.00389) (0.00292) (0.00322) Debt default 0.610*** 0.586*** 0.535*** (0.174) (0.147) (0.149) FDI Inflows -0.0176** -0.0150** -0.0161** (0.00843) (0.00755) (0.00770) Index -0.206** -0.229** -0.265*** (0.104) (0.0899) (0.0829) Terms of Trade -0.00211 -0.000887 -0.000673 (0.00140) (0.000965) (0.000933) Expenditure 0.0567 0.0136** 0.0178** (0.0423) (0.00678) (0.00725) Net Current 0.0180* (0.00922) Public Invest -0.0153** (0.00751) N 334 311 312 Regressors 9.000 10.000 10.000 Instruments 10.000 11.000 11.000 Excluded Instr 2.000 2.000 2.000 Cragg-Donald F statistic 5.013 38.042 150.296 Stock-Yogo 10 19.93 19.93 19.93 Hansen J stat 0.136 0.386 0.281
Blundell-Bond estimates (System GMM)
Bond spreads (3) (1) (2) Lag embig 0.530*** 0.602*** 0.551*** (0.0856) (0.0827) (0.0773) GDP growth -0.0744*** -0.0576*** -0.0848*** (0.0129) (0.0134) (0.0213) Inflation 3.306*** 2.973*** 1.928* (0.882) (0.942) (1.155) Reserves M -0.0371* -0.0564* -0.0396** (0.0195) (0.0333) (0.0193) Debt default 0.854*** 0.702** 0.857*** (0.267) (0.301) (0.221) Debt GDP -0.000628 0.00982 -0.000701 (0.00263) (0.00641) (0.00273) FDI Inflows 0.00275 0.00361 0.00425 (0.00495) (0.00602) (0.00472) Terms of Trade -0.000258 0.000417 0.000139 (0.000630) (0.00240) (0.000978) Index -0.115* -0.106 -0.117 (0.0590) (0.120) (0.122) Expenditure 0.00645 -0.0325 -0.0127 (0.0102) (0.0239) (0.0115) Net Current 0.0345** (0.0141) Public Invest -0.0280** (0.0134) Constant 3.370*** 1.002 4.311*** (0.670) (1.210) (0.882) N 326 326 325 AR1 0.008 0.037 0.007 AR2 0.225 0.274 0.171 Hansen 0.133 0.202 0.136 Nb of group 28.000 28.000 28.000 Number of Z 22.000 23.000 22.000
Following the literature (Fatás and Mihov, 2003; Akitoby and Stratmann, 2008) we instrument different types of government spending by urbanization rate and age dependency ratio. In fact Fatás and Mihov, 2003 use political system, age dependency ratio and the growth rate of population as instruments for government expenditures. Besides these instruments, Akitoby and Stratmann (2008) introduce an electoral dummy (proportional versus majoritarian), an electoral system and a right-wing government indicator variable to instrument government expenditures.
Results show that government current spending has a positive and significant effect on spreads whereas public investment significantly reduces sovereign bonds spreads: a rise in current spending and public investment of 1% of government total expenditure increases and decreases sovereign spreads by 102 basis points and 101 basis points respectively. When public investments are high in a given country, it helps to develop domestic investment. The increase in domestic investment increases tax resources available to pay for the service of its debt, thereby reducing spreads. In addition, public investment by raising the level and efficiency of a country's human capital is valued by capital markets as countries with a high level of human capital have low spreads. In sum, the negative effect of public investment on spreads is consistent from the point of view of endogenous growth (Barro, 1990). This theory teaches us that public investments or "productive" government spending stimulate growth insofar as they provide the private sector with infrastructures necessary for its expansion. However, Barro’s conjecture that government spending (even
productive spending) are financed by distortive taxes show that there is an optimal threshold of tax rate above which an increase in public investment will discourage investors. This can increase sovereign spreads. Investors (sovereign bonds holders) interpret the rise in unproductive expenditures (current spending) as a sign of a poor growth prospect in the future. Therefore, for the holding of these debt securities, they require a higher premium following an increase in current expenditure. The effect of total expenditure on spreads is however insignificant although positive13.
Overall, the effects of government spending on spreads vary from one component to another. The positive effect of current expenditure is the largest in the countries studied. The effectiveness of redistribution policies in these countries is being challenged in financial markets. Countries that are cutting their current spending report to investors their willingness to meet their debt service payment commitments through unpopular policies (while accepting the risks associated with them). Public investment in the countries studied is valued by financial markets. As Gupta et al. (2008), Fouejieu and Scott (2013) and unlike Akitoby and Stratmann (2008) we find that some components of public expenditure (current expenditure) positively affect spreads. It is therefore essential to consider the structure of public expenditure
13The p-values of the J test of Hansen indicate that we cannot reject the null hypothesis of over-identification of all instruments (these p-values
are all greater than 0.10). This means that the instruments used are appropriate. The critical values of Stock and Yogo show us that the model is not weakly identified (because critical values of Stock-Yogo <Cragg-Donald F statistic).
(their composition) in developing countries for their guidance. Focusing on public investment would lead to growth and improve the borrowing conditions of developing countries in financial markets while the opposite would be achieved by focusing on current spending.
b. Functional repartition of government expenditures and sovereign bond spreads
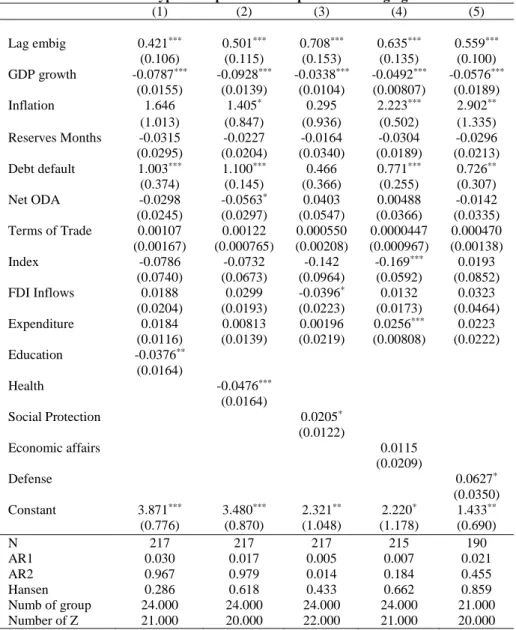
The empirical results of the estimate of the government's functional public spending on spreads are shown in Table 3. The analysis of these results shows a negative and significant effect of public spending on education and health on sovereign spreads. As these categories of public expenditure are considered as investments in human capital, their increase can improve the productivity of the populations in countries studied. With a well-educated and healthy population, international financial markets do not doubt a country's ability to honor its commitments. We explain this confidence by the fact that investors expect an improved economic situation following an increase of such expenditures. The size of health spending is slightly higher than that of education spending. A 1% increase in public health spending reduces spreads by 1.05% while the increase in education spending by 1% reduces them by 1.04%. The results also show that public spending on social protection and military spending increase sovereign spreads in emerging countries. This could be explained by the fact that these expenditures, which are described as "unproductive" by some economists, have a negative effect on private investment. The decline in private investment in a country is not appreciated by international financial markets. Indeed, a 1% increase in social protection spending increases spreads by 1.02%. The increase in spreads is 1.06% for a 1% increase in military spending. Government intervention in economic affairs has no significant effect on sovereign spreads in emerging countries.
Table 3: Effects of different types of expenditure on spreads in emerging markets economies (1) (2) (3) (4) (5) Lag embig 0.421*** 0.501*** 0.708*** 0.635*** 0.559*** (0.106) (0.115) (0.153) (0.135) (0.100) GDP growth -0.0787*** -0.0928*** -0.0338*** -0.0492*** -0.0576*** (0.0155) (0.0139) (0.0104) (0.00807) (0.0189) Inflation 1.646 1.405* 0.295 2.223*** 2.902** (1.013) (0.847) (0.936) (0.502) (1.335) Reserves Months -0.0315 -0.0227 -0.0164 -0.0304 -0.0296 (0.0295) (0.0204) (0.0340) (0.0189) (0.0213) Debt default 1.003*** 1.100*** 0.466 0.771*** 0.726** (0.374) (0.145) (0.366) (0.255) (0.307) Net ODA -0.0298 -0.0563* 0.0403 0.00488 -0.0142 (0.0245) (0.0297) (0.0547) (0.0366) (0.0335) Terms of Trade 0.00107 0.00122 0.000550 0.0000447 0.000470 (0.00167) (0.000765) (0.00208) (0.000967) (0.00138) Index -0.0786 -0.0732 -0.142 -0.169*** 0.0193 (0.0740) (0.0673) (0.0964) (0.0592) (0.0852) FDI Inflows 0.0188 0.0299 -0.0396* 0.0132 0.0323 (0.0204) (0.0193) (0.0223) (0.0173) (0.0464) Expenditure 0.0184 0.00813 0.00196 0.0256*** 0.0223 (0.0116) (0.0139) (0.0219) (0.00808) (0.0222) Education -0.0376** (0.0164) Health -0.0476*** (0.0164) Social Protection 0.0205* (0.0122) Economic affairs 0.0115 (0.0209) Defense 0.0627* (0.0350) Constant 3.871*** 3.480*** 2.321** 2.220* 1.433** (0.776) (0.870) (1.048) (1.178) (0.690) N 217 217 217 215 190 AR1 0.030 0.017 0.005 0.007 0.021 AR2 0.967 0.979 0.014 0.184 0.455 Hansen 0.286 0.618 0.433 0.662 0.859 Numb of group 24.000 24.000 24.000 24.000 21.000 Number of Z 21.000 20.000 22.000 21.000 20.000
3. Additional robustness analysis
We performed multiple controls on the robustness of our results obtained from GMM system (Blundell-Bond method). (See Tables 11-22 in the appendix).
Thus, we control first of all by government revenue (table 17) and the net official development assistance received (table 15). The results of estimates remain unchanged. We then look at the effect of public spending on spreads taking into account, seigniorage variables (table 11, 12, 14), namely base money growth and monetary ratio. The results remain robust to the addition of seigniorage variables.
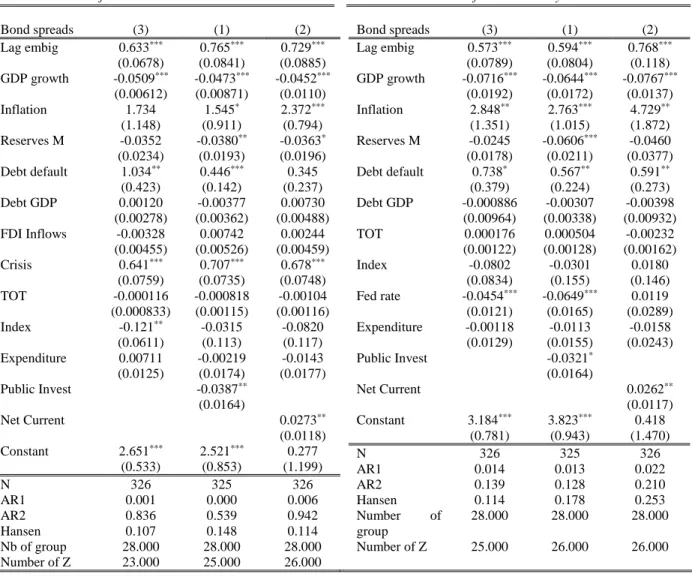
The introduction into the model of compositional and level variables (table 19, 20) reveals that the composition of public expenditure matters on spreads, while the level of public expenditure is not significant. Also, the effect of total spending, whether primary or off-interest, on spreads is identical (table 24). In addition, we control by US Federal Reserve interest rate (see table 6 below) and get robust results. The effect of the composition of public spending on spreads is not sensitive to the abundance of oil reserves
(table 18) and cumulated defaults in the past (table 22). The non-significance of the variable capturing the number of past defaults implies that there are no memory phenomena. Countries that have experienced many shortcomings in the past are not more able to manage their debt and obtain low spreads.
After all, the global financial crisis of 2008 (see table 6 below) does not alter the nature or significance of the link between public spending and spreads in developing countries. This global crisis has, however, significantly increased the spreads in these countries.
Several estimates have been made, using panel data instrumental variable approach in order to test the robustness of our results. We first tested the sensitivity of the results obtained with respect to the combination of control variables. This measure of robustness is motivated by the fact that the results can be affected by the number of explanatory variables in the model. To do this, we estimate three equations for each type of public expenditure using panel data instrumental variable approach. In the first equation we use GDP growth, debt ratio and payment defaults as control variables. The inflation rate is included in the second equation in addition to the first three control variables. The third equation introduces reserves in months of importation and finally we take account terms of trade. These estimates allow us to conclude that our results are robust to the combination of control variables (when using panel data instrumental variable approach). Our estimations are robust to the combination of control variables. The results of panel data instrumental variable approach are reported in Tables 1, 2, 3 and 4 in the appendix.
Another measure of the robustness of our results has been to estimate the effects of government spending on sovereign spreads by subgroups of countries. In particular, we focused on two (2) sub-samples of countries: (i) Latin American countries and (ii) Eastern Europe and Asian countries. The choice of this subdivision is due to the fact that the countries belonging to the same region are relatively more homogeneous in terms of their economic characteristics. Our objective here is to identify the specificities
of each of the two groups and to check the sensitivity of the results to these sub-samples. We disregard the Sub-Saharan Africa and Middle East regions because the number of countries belonging to these regions is low in our sample. The estimates by panel data instrumental variable approach suggest that our results are robust to sample change. Tables 5 (in Appendix) report results of sensitivity test in relation to regional subgroups of countries.The columns in these tables show results of the effect of each type of expenditure on spreads.
Table 6: robustness check for compositional effects of government expenditures on sovereign bond spreads
Control for 2008 world Financial crisis
Bond spreads (3) (1) (2) Lag embig 0.633*** 0.765*** 0.729*** (0.0678) (0.0841) (0.0885) GDP growth -0.0509*** -0.0473*** -0.0452*** (0.00612) (0.00871) (0.0110) Inflation 1.734 1.545* 2.372*** (1.148) (0.911) (0.794) Reserves M -0.0352 -0.0380** -0.0363* (0.0234) (0.0193) (0.0196) Debt default 1.034** 0.446*** 0.345 (0.423) (0.142) (0.237) Debt GDP 0.00120 -0.00377 0.00730 (0.00278) (0.00362) (0.00488) FDI Inflows -0.00328 0.00742 0.00244 (0.00455) (0.00526) (0.00459) Crisis 0.641*** 0.707*** 0.678*** (0.0759) (0.0735) (0.0748) TOT -0.000116 -0.000818 -0.00104 (0.000833) (0.00115) (0.00116) Index -0.121** -0.0315 -0.0820 (0.0611) (0.113) (0.117) Expenditure 0.00711 -0.00219 -0.0143 (0.0125) (0.0174) (0.0177) Public Invest -0.0387** (0.0164) Net Current 0.0273** (0.0118) Constant 2.651*** 2.521*** 0.277 (0.533) (0.853) (1.199) N 326 325 326 AR1 0.001 0.000 0.006 AR2 0.836 0.539 0.942 Hansen 0.107 0.148 0.114 Nb of group 28.000 28.000 28.000 Number of Z 23.000 25.000 26.000
Control for US Treasury bill rate
Bond spreads (3) (1) (2) Lag embig 0.573*** 0.594*** 0.768*** (0.0789) (0.0804) (0.118) GDP growth -0.0716*** -0.0644*** -0.0767*** (0.0192) (0.0172) (0.0137) Inflation 2.848** 2.763*** 4.729** (1.351) (1.015) (1.872) Reserves M -0.0245 -0.0606*** -0.0460 (0.0178) (0.0211) (0.0377) Debt default 0.738* 0.567** 0.591** (0.379) (0.224) (0.273) Debt GDP -0.000886 -0.00307 -0.00398 (0.00964) (0.00338) (0.00932) TOT 0.000176 0.000504 -0.00232 (0.00122) (0.00128) (0.00162) Index -0.0802 -0.0301 0.0180 (0.0834) (0.155) (0.146) Fed rate -0.0454*** -0.0649*** 0.0119 (0.0121) (0.0165) (0.0289) Expenditure -0.00118 -0.0113 -0.0158 (0.0129) (0.0155) (0.0243) Public Invest -0.0321* (0.0164) Net Current 0.0262** (0.0117) Constant 3.184*** 3.823*** 0.418 (0.781) (0.943) (1.470) N 326 325 326 AR1 0.014 0.013 0.022 AR2 0.139 0.128 0.210 Hansen 0.114 0.178 0.253 Number of group 28.000 28.000 28.000 Number of Z 25.000 26.000 26.000
V. Panel Smooth Threshold Regression (PSTR) estimates
In this section, we use PSTR method to model the effects of public spending on the spreads while assuming that these effects depend on the quality of governance.
Like Kaufmann et al. (2010), we define governance as “the traditions and institutions through which
authority is exercised in a country". This includes (i) the process by which governments are trained, monitored and replaced, (ii) the government's capacity to formulate and implement sound policies, and (iii) the respect of citizens and the state for existing institutions. Among indicators of good governance, we retain “government effectiveness” as threshold variable. It measures perceptions of the quality of public services, public service and its independence from political pressures, the quality of policy formulation and implementation, and the credibility of the commitment of government with respect to these policies. The values of this index change from -2.5 to 2.5, higher values indicate more effective government policies. This variable is expected to have a negative effect on bond spreads. This choice is due to the fact that literature on the political underpinnings of fiscal policy highlights quality of governance as indispensable for fiscal transparency. This fiscal transparency would make budgetary policy credible and the increase in public spending would have its expansionary effect (keynesian effect). Good institutions make it possible to limit political budget cycles in a country. Shi and Svensson (2006) show that the existence of political budget cycles depends on factors such as transparency of budgetary rules, low freedom of expression, etc. Institutions also affect the nature of public spending in a country. In the run-up to the elections, ruling governments are trying to influence the outcome of elections by influencing the different types of public expenditure (current or capital). Added to this is the fact that strengthening governance contributes to improve the conditions of investment by reducing risk and increasing profitability. For this purpose,
Rajkumar and Swaroop (2008) show that good governance (measured by the degree of corruption and the quality of Bureaucracy) has a positive impact on the efficiency of public investment expenditure. This efficiency is measured, according to them, by the gain in GDP growth, the increase in public spending on health and education.
1. Short presentation
The Hansen model (1999) assumes a sharp transition from one regime to another. However, instead of being brutal, this transition may be rather smooth. The PSTR method proposed by Gonzales et al. (2005)
makes it possible to model situations where the transition from one regime to another is gradual. Thus, the transition function will be, not an indicator, but rather a continuous function. PSTR models can also be seen as models in which there are two extreme regimes between which there would be a continuum of regimes. We control the robustness of our results by the PSTR method because it is more appropriate to describe the change in the economic behaviors induced by variables of quantitative regimes for two reasons: The PSTR
method makes it possible to take into account heterogeneity of the relationship between sovereign spreads and public spending on the one hand and, on the other hand, it is a generalization of PTR method. We estimate a non-linear equation between composition of public spending and sovereign spreads.
The PSTR model is presented in the following form:
𝑌𝑖𝑡 =µ𝑖+ 𝛼1𝑘𝑖,𝑡 + 𝛼2𝑘𝑖,𝑡 𝐺(𝑞𝑖,𝑡−1; 𝛾, 𝑐) + 𝛼3𝑋𝑖𝑡+ 𝜀𝑖𝑡 (2)
Where µ𝑖 represents the individual fixed effects, 𝜀𝑖𝑡 the error term which is independent and identically
distributed, 𝑌𝑖𝑡 is the sovereign spread, 𝑞𝑖,𝑡−1 is the transition variable, we considered here government
effectiveness and 𝑋𝑖𝑡 a vector of control variables. 𝑘𝑖,𝑡 represents government expenditure. We suppose,
like Granger and Terasvirta (1993), Gonzàlez et al. (2005), then Villieu and Eggoh (2013) a logistic transition function 𝐺(𝑞𝑖,𝑡−1; 𝛾, 𝑐) with a single threshold.
𝐺(𝑞𝑖,𝑡−1; 𝛾, 𝑐)= [1 + 𝑒𝑥𝑝(−𝛾𝜋𝑗=1𝑚 (𝑞𝑖,𝑡−1; 𝛾, 𝑐𝑗))]−1 𝜖 [0 ; 1] avec 𝛾 > 0 , 𝑐1< ⋯ < 𝑐𝑚
Where (𝑐1 ,𝑐2,… 𝑐𝑚 ) is a dimension vector 𝑚 grouping the threshold parameters and the parameter γ
makes it possible to characterize the slope of the transition function. When 𝛾 → ∞ the transition becomes abrupt and the PSTR converges to a PTR with two regimes (to the left, respectively to the right of 𝑐). On the other hand, for 𝛾 →0, 𝐺(. ) → 1/2 PSTR estimates correspond to that of a panel with individual fixed effects. For values of γ between these two extremes, the transition is smooth between the two regimes.
Compared to a model with a sharp transition (PTR), the PSTR method identifies an infinity of regimes, each describing a different effect of public spending on sovereign spreads, as a function of (𝑞𝑖,𝑡−1; 𝛾, 𝑐). The effect of public spending on spreads for (𝑞𝑖,𝑡−1; 𝛾, 𝑐) ≪ 𝑐 is equal to 𝛼1 and the effect
for 𝑐 ≪ (𝑞𝑖,𝑡−1; 𝛾, 𝑐) is equal to ( 𝛼1+ 𝛼2). The two extreme regimes of the PTR are thus found. For any
other value of 𝑞𝑖,𝑡−1; 𝛾, 𝑐 between these two extremes, the impact of public spending on sovereign spreads
is given by the following expression:
𝑑𝑌𝑖𝑡
𝑑𝑘𝑖,𝑡=
𝛼
1+𝛼
2𝐺(𝑞
𝑖,𝑡−1; 𝛾, 𝑐)
Three major steps are typically used in a PSTR model.
The first step is to find the number of possible regimes or equivalently the number of transition functions necessary to capture all heterogeneity and non-linearity of the data. It is a question of first testing the linear model without introducing the transition function (𝐻0: 𝑟 = 0) against a model with threshold
effects with a minimum of a transition function (𝐻1: 𝑟 = 1 ). If the linear model is rejected, the next step
is to find the number of transition functions to be admitted in the model. We test in an iterative way the number of possible significant regimes and the procedure stops when the null hypothesis is accepted (𝐻0: 𝑟 = 𝑖 𝑣𝑒𝑟𝑠𝑢𝑠 𝐻1: 𝑟 = 𝑖 + 1) with (𝑖 = 1, . . . , 𝑟 ). Transition functions or transition variables are
In the second step, we determine the number of thresholds (𝑚) to be admitted in the transition variable 𝑞𝑖,𝑡−1 such that 𝑐𝑗,𝑚𝑖𝑛 > 𝑚𝑖𝑛𝑖,𝑡{𝑞𝑖,𝑡−1} and 𝑐𝑗,𝑚𝑎𝑥 < 𝑚𝑎𝑥𝑖,𝑡{𝑞𝑖,𝑡−1}, 𝑗 = 1, … , 𝑚. Colletaz and Hurlin (2006) propose to retain the value of 𝑚 for model which minimizes Residual Sum of Squares (RSS), Akaike Information Creterion (AIC), Bayesian Information Creterion (BIC). However, Gonzalez et al. (2005) considers that in practice it is usually sufficient to consider 𝑚 = 1 𝑜𝑟 𝑚 = 2, since these values generally allow to capture the variations in the parameters to be estimated.
Finally, in the third step we estimate the parameters of the PSTR model using nonlinear least squares (NLS) method.
2. Results
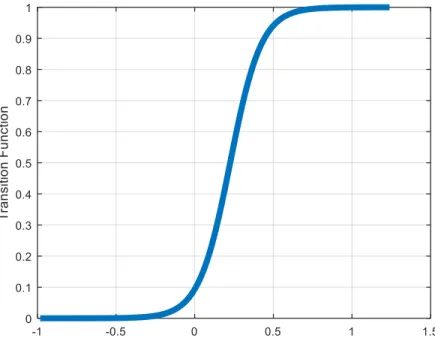
Figure: Transition function for current expenditures
Table 5. Estimation of parameters for PSTR model14
Threshold Variable=Government effectiveness
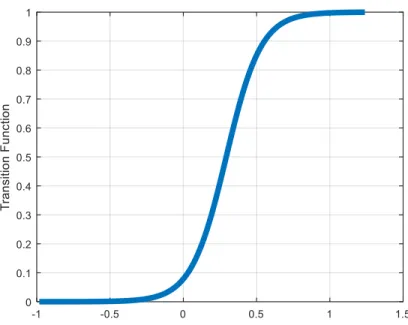
Net Current spending Total expenditure
Parameter 𝛼1 0.0083(0.0069) 0.0179(0.0090)*
Parameter 𝛼2 -0.0339(0.0088)*** -0.0751(0.0264)**
Parameter 𝑐 0.2254 0.2927
Parameter 𝛾 10.0802 8.4098
Figure: Transition Function for total expenditures
Table 5 above presents results of the model estimation by the PSTRs. The LMF test allows us to reject the null hypothesis of the absence of a non-linear effect between public expenditure and spreads conditioned by the quality of governance. Thus, the effect of public spending on sovereign spreads depends on the quality of governance.
The analysis of the results shows us that the coefficients associated with different types of public expenditures are positive first and above a certain level of government effectiveness these coefficients become negative and significant15. For low levels of government effectiveness, public spending increases
sovereign spreads in emerging countries. However, this relationship is reversed and becomes negative when the level of government effectiveness exceeds a certain threshold.
The low values of 𝛾 indicate that the PSTR structure is well suited for modeling non-linearity when transition is provided by governance quality as measured by government effectiveness.
Figure 8 shows the sensitivity of the sovereign spread to public spending according to the indicators of governance quality. This figure describes well the flexibility in the evolution of the elasticity according to the variables of quality of governance. It shows that the sensitivity of the sovereign spread is a decreasing function of the governance quality variable. Levels of high government effectiveness are associated with negative elasticities. When government effectiveness is low, the spread elasticity is high and changes between the values 0.01 and -0.005. Beyond a certain threshold (0.1824 or 0.2927 according to the type of
15 The median value of government effectiveness is -0.11933 slightly. In ours sample, 11 countries are below this median value while 11 other countries are above (see the appendix for details).
expenditure), the PSTR model shows a change of slope in the relationship between public expenditure and sovereign spread. From this threshold, the sensitivity of sovereign spread begins to decrease, before decreasing considerably. The sign of the relationship between public spending and sovereign spread becomes negative above this threshold.
VI. Conclusions and Implications of Economic Policies
The objective of this paper was to study the effects of different components of public spending (current spending, public investments, total expenditures, spending on education, spending on health, social protection, economic affairs, spending on defense) on sovereign spreads and the nonlinear effects existing between these variables in emerging developing countries. Working on a sample of 30 emerging countries over the period 2000 and 2013, several conclusions and implications can be drawn from this study.
First, we find that current spending (including social protection and spending on defense) significantly increases sovereign spreads in these countries. This implies that developing countries can improve their borrowing conditions on international capital markets by controlling their current expenditures (wage, social transfers, etc.). They must be able to carry out “unpopular” policies of contraction of current expenditure because these are valued in the financial markets.
Secondly, public investment (which encompass spending on education and health) significantly reduces bonds spreads in emerging markets. The quantity as well as the quality of public investment deserves to be improved in these countries in order to have investors’ confidence.
The effects of country-specific factors are also important in determining sovereign spreads in developing countries. For example, in order to convince investors that it will not fail, a country must demonstrate strong and sustained growth, price stability and strict compliance with its commitments vis-à-vis its lenders (bondholders, etc.).
However, the existence of non-linearity in the appearance of the positive or negative effects of some components of public spending on sovereign spreads leads to nuance the implications of economic policy resulting from this study.
Finally, we have highlighted the existence of a threshold effect between current spending, total spending, and sovereign spreads in emerging countries. This threshold is highlighted in relation to the quality of governance measured by government effectiveness, political stability and Quality. Improved government effectiveness allows public spending to regain its expansionary effects. Thus, developing countries will improve their borrowing conditions by strengthening the quality of their governance.
Bibliography
Afonso, A., Strauch, R., 2007. Fiscal policy events and interest rate swap spreads: Evidence from the EU. Journal of International Financial Markets, Institutions and Money 17, 261–276.
Akitoby, B., Stratmann, T., 2010. The value of institutions for financial markets: evidence from emerging markets. Review of World Economics 146, 781–797. doi:10.1007/s10290-010-0073-7
Akitoby, B., Stratmann, T., 2008. Fiscal policy and financial markets. The Economic Journal 118, 1971– 1985.
Alesina, A., Ardagna, S., Perotti, R., Schiantarelli, F., 2002. Fiscal Policy, Profits, and Investment. American Economic Review 92, 571–589. doi:10.1257/00028280260136255
Alesina, A., Broeck, M.D., Prati, A., Tabellini, G., Obstfeld, M., Rebelo, S., 1992. Default Risk on Government Debt in OECD Countries. Economic Policy 7, 427. doi:10.2307/1344548
Alfaro, L., Kalemli-Ozcan, S., Volosovych, V., 2007. Capital flows in a globalized world: The role of policies and institutions, in: Capital Controls and Capital Flows in Emerging Economies: Policies, Practices and Consequences. University of Chicago Press, pp. 19–72.
Antonio, F., Mihov, I., 2012. Fiscal Policy as a Stabilization Tool. The BE Journal of Macroeconomics 12, 1–68.
Arbatli, E., Escolano, J., 2015. Fiscal transparency, fiscal performance and credit ratings. Fiscal studies 36, 237–270.
Ardagna, S., 2009. Financial markets’ behavior around episodes of large changes in the fiscal stance. European Economic Review 53, 37–55.
Ardagna, S., 2004. Fiscal stabilizations: When do they work and why. European Economic Review 48, 1047–1074. doi:10.1016/j.euroecorev.2003.09.010
Arezki, R., Ramey, V.A., Sheng, L., 2016. News Shocks in Open Economies: Evidence from Giant Oil Discoveries. The Quarterly Journal of Economics qjw030. doi:10.1093/qje/qjw030.
Arezki, R., & Brückner, M. (2012). Commodity windfalls, democracy and external debt. The Economic Journal, 122(561), 848-866.
Arezki, R., & Brückner, M. (2012). Resource Windfalls and Emerging Market Sovereign Bond Spreads: The Role of Political Institutions. The World Bank Economic Review, 26(1), 78-99. doi: 10.1093/wber/lhr015
Aschauer, D. A. (1989). Is public expenditure productive? Journal of monetary economics, 23, 177–200. Aschauer, D. A. (1989). Public investment and productivity growth in the Group of Seven. Economic
perspectives, 13, 17–25.
Baldacci, E., Mati, A., Gupta, S., 2008. Is it (Still) Mostly Fiscal? Determinants of Sovereign Spreads in Emerging Markets. IMF Working Papers 08, 1. doi:10.5089/9781451871173.001
Balima, W.H., Combes, J.-L., Minea, A., 2017. Sovereign debt risk in emerging market economies: Does inflation targeting adoption make any difference? Journal of International Money and Finance 70, 360–377. doi:10.1016/j.jimonfin.2016.10.005
Barro, R.J., 1990. Government spending in a simple model of endogeneous growth. Journal of political economy 98, S103–S125.
Bellas, D., Papaioannou, M. G., & Petrova, I. (2010). Determinants of emerging market sovereign bond spreads. Sovereign debt and the financial crisis. IMF, Washington, DC, 77-101.
Blanchard, O., Perotti, R., 2002. An empirical characterization of the dynamic effects of changes in government spending and taxes on output. The Quarterly Journal of Economics 117, 1329–1368. Block, S.A., Vaaler, P.M., 2004. The price of democracy: sovereign risk ratings, bond spreads and political
business cycles in developing countries. Journal of International Money and Finance 23, 917–946. doi:10.1016/j.jimonfin.2004.05.001
Cabezon, E., Prakash, T., 2008. Public financial management and fiscal outcomes in sub-Saharan African heavily-indebted poor countries. International Monetary Fund.
Chakroun, M., 2012. Les Effets Non Lineaires De La Sante Sur La Croissance. Revue Tunisienne d’Economie et de Gestion 31, 121–151.