HAL Id: inserm-00787846
https://www.hal.inserm.fr/inserm-00787846
Submitted on 13 Feb 2013
HAL is a multi-disciplinary open access
archive for the deposit and dissemination of
sci-entific research documents, whether they are
pub-lished or not. The documents may come from
teaching and research institutions in France or
abroad, or from public or private research centers.
L’archive ouverte pluridisciplinaire HAL, est
destinée au dépôt et à la diffusion de documents
scientifiques de niveau recherche, publiés ou non,
émanant des établissements d’enseignement et de
recherche français ou étrangers, des laboratoires
publics ou privés.
Empirical Optimization Of Frequency Parameters In
Chirp Inversion Imaging
Amira Zaylaa, Sébastien Ménigot, Jean-Marc Girault, J. Charara
To cite this version:
Amira Zaylaa, Sébastien Ménigot, Jean-Marc Girault, J. Charara. Empirical Optimization Of
Fre-quency Parameters In Chirp Inversion Imaging. Acoustics 2012, Apr 2012, Nantes, France.
pp.2889-2893. �inserm-00787846�
Empirical Optimization Of Frequency Parameters In Chirp Inversion
Imaging
Amira Zaylaa, S´ebastien M´enigot, Jean-Marc Girault and Jamal Charara
April 26, 2012
Contrast ultrasound imaging has become a significant imaging technique for the last ten years. Physiological and pathological information are accessible thanks to microbubble injection and nonlinearity detection. To improve resolution and penetration, frequency modulated signals called chirps combined with compression filter have been utilized by radar technology. Recent studies applied the use of chirps in harmonic imaging. And since the setup parameters of the chirp are important to enhance the microbubble nonlinearities and thus the contrast; yet their full potential is not tapped. The present study aimed to empirically optimize the harmonic energy backscattered by microbubbles through a polynomial frequency modulation law of order three. Two imaging techniques were con-sidered: harmonic chirp imaging and chirp inversion imaging. In simulation, the frequency parameters of chirps were sought for microbubbles of different sizes (1 µm and 2.5 µm). It was beneficial to increase the order of the polynomial chirp to improve the contrast. Chirp Inversion Imaging was preferable over harmonic chirp imaging using a polynomial chirp for contrast enhancement. Moreover, optimal frequency parameters were selected manu-ally. Optimization of polynomial chirps was empirically capable of enhancing the contrast in images however, this study is paramountly conceived by an automatic technique.
1
Introduction
Contrast Ultrasound Imaging (CUSI) is a significant imag-ing technique requirimag-ing the injection of a gas-containimag-ing con-trast agent; it is possible because microbubbles resonate when impinged upon by ultrasound and emit ultrasound at har-monic frequencies. Ultrasound harhar-monic images are pro-duced by anatomic structures that contain these agents. Tis-sues that do not contain gaseous contrast agents presumably produce negligibal harmonic signals. The contrast between the medium infused with microbubbles and the surrounding tissues is given by the contrast-to-tissue ratio (CTR) [1, 2].
Ultrasonic Contrast agents (UCA) are used in ultrasound imaging to increase the sensitivity of the imaging technique by altering the image contrast between different structures. A dramatic increase in scattering which can be achieved with this microbubble has made it useful both in difficult-to-image patients and in areas for which the ultrasound signal is re-duced. Injection of the contrast microbubbles and observa-tion of their real-time passage in an ultrasound image can significantly improve the sensitivity and diagnostic power of ultrasonic imaging. Basically, Harmonic Imaging can be achieved by various aquisition techniques such as second har-monic aquisition and pulse inversion.
Most applications of harmonic imaging implicates that the spectrum of the backscatter contains not only the fun-damental but also the harmonics. Therefore, by second har-monic imaging a bandpass filter selects the second harhar-monic, however, the bandpass filter cannot avoid totally the spectral overlap between the fundamental and the harmonics. Con-versely, by pulse inversion imaging the folobe is suppressed
totally and we are left with the harmonics and/or subharmon-ics [3]. Regardless of the imaging technique, whether sec-ond harmonic or pulse inversion imaging, one of the major problems that ultrasonic images suffer from is bad contrast, low resolution and small penetration. To improve both
res-olution and penetration, frequency modulated signals known as ”Chirps” often utilized in Radar technology were recom-mended in CUSI [1, 4]. Although the use of these chirps is capable of providing clinicians with images having good resolution and penetration in the future, the question remains what about the CTR?
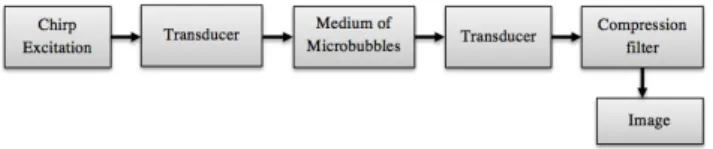
Chirp imaging constitutes of sending frequency modu-lated signal, chirp excitation, into the medium under explo-ration, receiving the backscattered signal and filtering it in order to produce the image (Figure 1). The chirp could be linear or nonlinear; it depends on the frequency modulation profile or law. Traditional harmonic chirp imaging (HCI) has been utilized to reconstruct images at the second harmonic after transmitting chirps to the medium in order to improve the resolution and contrast.
Recent studies have utilized pulse inversion imaging to improve the CTR by using conventional pulses [5], however, conventional pulses have led a tradeoff between resolution and penetration. Others have used chirp inversion imaging (CII) based on a linear chirp to improve the signal-to-noise ratio (SNR) and solve the tradeoff between resolution and penetration [1, 6]. Exponential chirp was utilized to investi-gate nonlinear systems in audio signaling [7] and hasn’t yet been investigated in CUSI. Nonlinear chirp of order two has been optimized by HCI [5] merely. For that, optimization of the chirp’s frequency law became profoundly essential gen-erally due to the relative safety of UCA and particularly due to the robustness of chirp imaging in enhancing penetration, resolution and the CTR of medical images. The optimiza-tion of such chirps in diagnostic and theraputic ultrasound imaging is still flourishing and not until now did anyone in-vestigated their full potential of chirps.
In this paper we aimed to empirically optimize the fre-quency modulation parameters of a third order polynomial chirp using Chirp Inversion Imaging (CII) in contrast media, i.e. instead of pulses in [8] we used chirps, with a small
Figure 1: Block Diagram of Contrast Ultrasound Imaging using chirp excitation.
overview on harmonic chirp imaging (HCI) in order to en-hance the contrast of contrast ultrasound images. We pro-posed an algorithm for CII and implemented HCI, in addi-tion, we employed the compression filter in the two imaging techniques. Furthermore, since the energy or the power of the signal is related to the CTR, we computed the energy of the signal backscattered by 1 µm and 2.5 µm micro-bubbles during their nonlinear response and focused our study on im-proving these energy outcomes i.e. imim-proving indirectly the CTR. Under this condition we anticipated that we not only get an image with good resolution and penetration but also with enhanced contrast that is capable of providing amended clinical diagnosis in the future. We tended to optimize a poly-nomial chirp of order higher than currently optimized chirps. The novelty of our approach was based on utilizing a poly-nomial chirp of order three and employing chirp inversion imaging in CUSI to obtain primary ultrasonic medical im-ages of high contrast and consequently discriminate between regions that were not easily differentiated.
2
Methods And Materials
We simulated chirp imaging with Matlab (Mathworks, Natick, MA, USA). First, frequency modulated (FM) signals having the form of Eq. (1) were transmitted into the medium infused with contrast bubbles by means of a transducer using HCI and/or CII.
C(t)= G(t). cos((2π( fi(t))t), (1)
where fi is the instantaneous frequency, t the time and
G(t) the gaussian envelope defined by:
G(t)= A exp(−(
(α)2
2(σ)2)). (2)
where A is the normalized amplitude of the chirp, α the shift of the envelope from the center and σ the width of the gaus-sian’s envelope.
The instantaneous frequency we used in Eq. (3) also known as FM law was governed by a polynomial of order three:
fi(t)= fot+ β1t2+ β2t3 (3)
where fois the starting frequency of the chirp in (MHz) and
(β1, β2) were the modulation indices in (THz/s) and (THz/s2)
respectively. In particular, when (β2=0) the chirp is said to be
a Quadratic FM, otherwise it is a Polynomial FM [9, 10, 11]. Second, chirps made their way towards the medium. This resulted in backscattered signals which were further detected by the same transducer and fed into a compression filter to be finally interpreted and transformed into an energy image. Third, for different microbubble sizes and chirp types several simulations were carried out to optimize the frequency pa-rameters of chirps. We implemented the compression filter
as proposed in [12]. As compared to a regular compression filter, this harmonic compression filter has twice the instan-taneous frequency at every time point. The actual chirp C(t) was given by Eq. (1), the filters’ impulse response was de-fined by :
h(t)= [G(t)]4. cos((2π(2 fi(t))t) (4)
with fi(t) given by Eq. (3) and the output of the filter was
given by y(t):
y(t)= C(t) ∗ h(t) (5) which described the compressed echo with good axial res-olution and a central frequency situated at the second har-monic of the transmitted chirp. Also we looked up for the highest energy values in order to enhance the contrast since the energy is directly proportional to the CTR and is more accessible
2.1
Harmonic Chirp Imaging
It is a classical technique that permits the selection of the backscattered signal whose central frequency lies within the bandwidth of the transducer and is equal to the second har-monic value. This is equivalent to bandpass filtering. The backscattered signal is bandpass filtered such that the sec-ond harmonic is selected and the image is ready to be recon-structed at 2 fo[2].
In HCI algorithm we:
• Specified the bandwidth of the transducer • Fired a quadratic chirp C(t) given by Eq. (1)
• Simulated the backscatter e(t) = Echo{C(t)}, by solv-ing the Modified Rayleigh-Plesset differential equation • Fed e(t) into the compression filter and computed the energy image of the compression filter’s output y(t) for different frequency values foas a function of β1
• Selected manually the optimum foand its
correspond-ing β1
We further extended the algorithm to send a polynomial chirp (β2, 0), receive the backscattered signal, feed it into
the compression filter and compute the energy image of the backscattered signal, but here, for different β2 values as a
function of β1. We finally selected the best β2and its
corre-sponding β1manually from the image.
2.2
Chirp Inversion Imaging
It is the process of transmitting two pulses 1800 out of phase sequentially into the medium infused with microbub-bles. The received echoes are summed up such that echoes at the fundamental frequency will cancel out yet those at the harmonic frequencies will show up [2].
In CII algorithm we proposed that:
• Two quadratic chirps C1(t) and C2(t) having the form
of Eq. (1) with C2 satisfying equation (6) are sent in
such a way that a chirp was transmitted into the medium of micro-bubbles and, after a suitable delay t0, a
sec-ond pulse was transmitted that is an inverted copy of the first pulse.
where C1(t) and C2(t) represents the acoustic pressure
of the first and second pulses as a function of time, t. • These signals were backscattered separately by
micro-bubbles. The echo of each firing was then simulated: (
e1(t)= Echo{C1(t)}
e2(t)= Echo{C2(t)}
(7)
• Then the following pulse inversion detection signal was manipulated:
s(t)= e1(t − t0)+ e2(t) (8)
• s(t) was fed into the compression filter and the energy of its output y(t) was computed for various central fre-quency values as a function of β1
Figure 2: The transmitted polynomial Chirp.
• The optimum fois selected manually
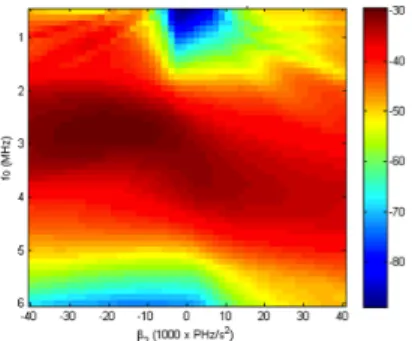
Figure 3: The energy of the compressed polynomial FM backscatter in HCI for 2.5 µm bubble.
Moreover, the previous quadratic chirp was extended to a polynomial one having (β2 , 0) and a fixed fo value, as
previously described, the resultant backscattered signal was computed and led to a specific energy image and optimum β2
and β1values after filtering.
3
Results and Discussion
In this part we will show the simulation results of the emitted quadratic and polynomial FM, particularly, the en-ergy of the backscattered signal during the nonlinear response of micro-bubbles by traditional HCI and CII. We will show also the effect of the chirp’s frequency parameters as well as discuss the results of the energy backscattered from 1 µm and 2.5 µm bubbles in HCI and CII .
3.1
Simulated Emitted Chirp
The chirp excitation given by Eq. (1) was depicted in Fig-ure 2, the upper plot manifested the temporal representation of the third order polynomial chirp insonating the medium of micro-bubbles, the image exhibited its spectrogram with the energy indicated by the colorbar in an ascending order and the left plot represented merely its spectrum. The spectro-gram topologically represented a small region having signif-icant energy values. The highest energy value occured at t=1 µs when the chirp attained its maximum amplitude.
3.2
The Influence of Chirp’s Frequency
Param-eters
In concern of the effect of the frequency parameters we simulated Figure 3 and Figure 4. Figure 3 represents the en-ergy of the signal backscattered from 2.5 µm bubble by HCI and Figure 4 represeants the energy of the resultant signal backscattered by the same bubble by CII. For 2.5 µm bubble when insonifying the medium by a polynomial chirp of or-der 3 with (β1=0) it was vivid that the backscattered energy
relied on both β2and f0in HCI and CII.
Figure 4: The energy of the compressed and backscattered polynomial FM in CII for 2.5 µm bubble.
Table 1: The variation of the maximum energy by CII and HCI of a= 2.5µm bubble as a function of the frequency parameters β1and β2in the frequency range f=[0.5 MHz,6
MHz].
Frequency Parameters β1=0 ∀β1 β1=0 ∀ β1=0
β2=0 β2=0 ∀β2 ∀β2
Max(E)-CII (dB) -31.6 -31.5 -30 -29.2 Max(E)-HCI (dB) -37.0 -36.4 -37.0 -36.3
In the range tested, optimal values of β2 and f0 existed
in the regions where the best backscattered energy occured (dark red color). These optimal values were different in HCI and CII. The highest backscattered energy was attained in CII. The same remark was valid when transmitting a quadratic chirp, and studying the variation of ( f0) as a function of β1
in HCI and CII techniques. Moreover, we noticed that lines β1=0 and β2=0 in (Figures 3, 4) were not the axis of
sym-metry this implied that the frequency parameters were asym-metric.
Many believed that nonlinear chirp signals were designed to minimize the peak range sidelobe level by optimizing its
frequency sweep rate and time duration [6]. The major find-ing of our study manifested the strong impact of the FM law which could be quadratic or polynomial on the energy of the backscattered signal. Our data (see Table 1) exhibited that the higher the degree of the polynomial in FM law, the higher the energy was carried by the backscattered signal. In other words, as the FM law was more curved the energy received was dramatically higher.
From Table 1 we inferred that by increasing the degree of the FM law from: 1 to 2 an improvement of 0.1 dB for CII and 0.6 dB for HCI was observed, from: 1-3 an improvement of 1.6 dB for CII yet 0.0 dB for HCI was obtained and from: 2-3 (β1, 0 , β2, 0) 2.3 dB for CII and 0.1 dB for HCI was attained. The best results were those governing a third order polynomial governed by equation (2) using CII. However, in HCI the improvement of the Energy-to-complexity ratio was low as compared to that obtained for CII.
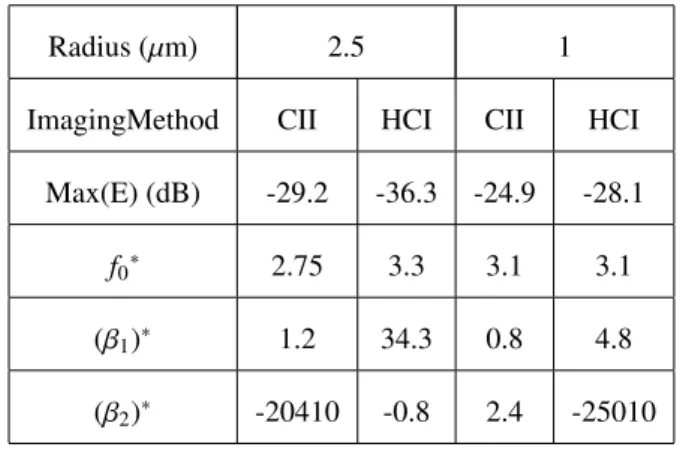
Table 2: The variation of the maximum energy and the modulation indicies as a function of the radius (2.5µm,1µm)
of bubbles and the imaging method (HCI,CII) in the frequency range f=[0.5 MHz,6 MHz].
Radius (µm) 2.5 1 ImagingMethod CII HCI CII HCI
Max(E) (dB) -29.2 -36.3 -24.9 -28.1 f0∗ 2.75 3.3 3.1 3.1
(β1)∗ 1.2 34.3 0.8 4.8
(β2)∗ -20410 -0.8 2.4 -25010
3.3
The Influence of Microbubble’s Size
We impinged two bubbles of radius 2.5 µm and 1 µm respectively by a third oder polynomial chirp and summa-rized the results in Table 2. Table 2 represented the optimum frequency parameters f0∗, (β1)∗ and (β2)∗in the twoimag-ing modalities utilized and for 2.5 µm and 1 µm bubbles. In summary, the maximum energy values, when the signal was backscattered by 1µm bubble, were much imperative than those when the signal was backscattered by 2.5 µm bubble. In addition, it was advantageous to use CII over CHI, since the backscattered energy obtained with CII is always superior of 7 dB as compared to CHI technique.
The optimal values depicted in Table 2 led to the best backscattered energy that were not only dependent on the de-gree of the FM law but also on the imaging technique. Con-sequently, searching for the best imaging technique and the best FM law are crucial. Note however that the optimal value of the frequency parameters varied with both the transmits’ frequency ( f0) and the size of the microbubble. Nevertheless,
it was not empirically demonstrated in this study, it was ob-vious that the optimal value of each parameter depended not only on the transmits’ frequency ( f0) and the size of the
mi-crobubble but also on other parameters such as the bandwidth of the transducer and the initial pressure level.
4
Conclusion
Our study manifested that accounting for both the chirp type and the size of the micro-bubble it was necessary to in-vestigate the frequency parameters that govern the behaviour of time-frequency transmit signal to optimize the energy re-flected by microbubbles and indirectly the CTR. The third order Polynomial chirp insonation using CII have provided the optimal and most promising results as compared to CHI during the nonlinear response of microbubbles. Using the robust CII algorithm and a third order polynomial several optimum frequency parameters that tended to enhance the CTR were selected manually. Indeed the improvement of the CTR opened the door for high quality images and con-sequntly amanded diagnosis. Future step could be the vali-dation of our findings experimentally for improving clinical diagnosis. And since the selection of the optimum parame-ters in our empirical study was done manually, we ought to consider an advanced automatic technique.
Acknowledgements
This research has been supported by the National Council for Scientific Research in Lebanon and the Lebanese Univer-sity.
References
[1] T. Misaridis and J. A. Jensen, ”Use of modulated ex-citation signals in medical ultrasound. part I:basic con-cepts and expected benefits”, IEEE Trans. on Ultrason., Ferroelectr and Freq. Control 52,(2)177-191(2005) [2] P. R. Hoskins, K. Martin, and A. Thrush, ,
Di-agnostic Ultrasound: Physics and Equipment (bridge Medicine), Cam(bridge University Press, Cam-bridge,UK(2010)
[3] K. K. Shung, Diagnostic Ultrasound: Imaging and Blood Flow Measurements, CRC Press, Boca Raton, FL, USA(2005)
[4] R. Y. Chiao and X. Hao, ”Coded excitation for diag-nostic ultrasound: a system developer’s perspective”, IEEE Trans. on Ultrason., Ferroelectr and Freq. Con-trol 52,(2)160-170(2005)
[5] M. Pasovic, M. Danilouchkine,T. Faez, P.L.M.J. van Neer, C. Cachard, A.F.W. van der Steen, O. Basset, N.D. Jong, ”Second harmonic inversion for ultra-sound contrast harmonic imaging”, Phys. Med. Biol. 56(11),3163-3180(2011)
[6] J.A. Song, J. H. Chang,T. k. Song, and Y. Yoo, ”Coded tissue harmonic imaging with nonlinear chirp signals”, Ultrasonics 51(4),516-521(2011)
[7] A. Novak, L. Simon, F. Kadlec and P. Lotton, ”Nonlinear System Identification Using Exponential Swept-Sine Signal”, IEEE Trans. on Instrum. Meas. 59(8),2220-2229(2010)
[8] D. H. Simpson and P. N. Burns, ”Pulse inversion doppler: a new method for detecting nonlinear echoes
from microbubble contrast agents”, In Proc. IEEE Ul-trasonics Symp. 2,1597-1600(1997)
[9] E. Barlow, A. J. Mulholland, A. Gachagan, and A. Nor-don, ”A theoretical investigation of chirp insonification of ultrasound contrast agents”, Ultrasonics 51(6),725-733(2011)
[10] V. Sboros, S. D. Pye, C. A. MacDonald, J. Gomatam, C. M. Moran, and W. N. McDicken, ”Absolute mea-surement of ultrasonic backscatter from single mi-crobubbles” Ultrasound in Med.& Biol. 31(8),1063-1072(2005)
[11] T. X. Misaridis, K. Gammelmark, C. H. Jørgensen, N. Lindberg, A. H. Thomsen, M. H. Pedersen, and J. A. Jensen, ”Potential of coded excitation in medical ultra-sound imaging” Ultrasonics 38(1-8),183-189(2000) [12] J. M. G. Borsboom, C. T. Chin, A. Bouakaz, M.
Ver-sluis, and N. de Jong, ”Harmonic chirp imaging method for ultrasound contrast agent” IEEE Trans. on Ultrason., Ferroelectr and Freq. Control 52(2),241-249(2005)