COMPOSITION AND ENGINEERING PROPERTIES OF SOME VERMICULITIC PRODUCTS OF WEATHERING
by
ROBERT M. QUIGLEY
B.A.Sc., University of Toronto
(1955)
M.A.Sc., University of Toronto
(1956)
SUBMITTED IN PARTIAL FULFILLMNT OF THE REQUIREMENTS FOR THE
DEGREE OF DOCTOR OF PHILOSOPHY
at the
MASSACHUSETTS INSTITUTE OF TECHNOLOGY
September, 1961
Signature of Author
Department of Geology an:' Gee/physics, Aug. 21, 1961
Certified by
Thesis Supervisor
Accepted by
Chairman, Departmental Committee on Gr f/ate Students
Submitted to the Department of Geology and Geophysics on August 21, 1961 in partial fulfillment of the requirements for the degree of Doctor of Philosophy.
The clay mineral weathering products, taken from a Podzolic soil profile developed in a New England glacial till, consist of variable amounts of illite, vermiculite, swelling clay, randomly interlayered minerals, and chlorite. Clay soils of this type are usually deficient in potassium and may fix potassium and change in mineralogy if they enter a marine environment. Potassium fixation,
which was expected to produce pronounced changes in the mineralogy and engineering properties of this soil, occurred to a minor degree or not at all. Aluminum and iron, which are relatively mobile in low pH ground water, replaced the stripped-out potassium resulting in the chloritization of the previously existing 2:1 layer clays. X-ray analyses, differential thermal analyses, glycol retentions, cation exchange capacity determinations, total potassium analyses, and extractable aluminum and iron determinations were performed on the clay.
Engineering tests were run on the clays to study the relative effects of ordinary cation exchange and potassium fixation. The effects of potassium fixation were minor and usually were swamped
by the effects of cation exchange. All clays were sedimented in
NaCl and leached with either NaCl or KCl. Differences in the
consolidation, permeability, and strength characteristics of the Na and K clays were measured.
In general, the K clays existed at a higher void ratio at any given consolidation pressure within the range studied. The K clays were as permeable or more permeable than the Na clays at any consolidation pressure or void ratio within the range studied. At a given water content, the K clays were stronger than the Na clays in both drained and undrained shear. The drained friction angles were greater for the K clays than the Na clays. For example, in one of the test batches, the Na and K clays had drained friction angles of 20 and 26 degrees respectively. In most of the tests, the K:Na
ratio in the pore water was found to play an important role. The changes are consistent with either Rosenqvist's concepts of cation
polariz-ability or concepts of ionic potential and the size of the hydrated radii of the adsorbed cations.
and undrained triaxial specimens were identified by measuring changes in clay particle orientation. These and additional test results were used to interpret some of the engineering test data.
Thesis Supervisor: Professor T. William Lambe Title: Professor and Head of the Soil
Engineering Division,
Department of Civil and Sanitary Engineering.
of the work. Professor LambeTs interest and ideas contributed greatly to the engineering and fabric studies and to the manner in which the overall research program is presented.
Dr. R. Torrence Martin's continued encouragement and help in developing the chemical test procedures is gratefully acknowledged. His suggestions aided greatly in the development of the mineralogical study.
Dr. John Hower introduced the author to x-ray spectrographic analysis procedures. His interest and invaluable assistance in the spectrographic determinations enabled the author to extend his work and interests much further than would otherwise have been possible.
Much of the work presented in this thesis was performed under a research contract from the Office of Naval Research. This
1 Abstract 2 Ackmowledgements
4
Table of Contents5
List of Figures 11 List of Tables 17List
of Abbreviations and Symbols 18Preface 19
Summary 21
PART ONE
MINERALOGICAL ANALYSES 27
I. INTRODUCTION 27
II. PREVIOUS WORK 28
A. General Discussion 28
B. Potassium Release and Fixation in 1licaceous Soils 28
C. Marine Clay Mineral Diagenesis 31
D. The Role of Aluminum 34
III. METHODS OF NINERALOGICAL ANALYSIS 35
A. X-Ray Analyses 35
B. Differential Thermal Analyses 36
C. Cation Exchange Capacities 36.
D. Potassium Analyses 37
E. Glycol Retentions 37
IV. LOCATION OF SOIL PROFILE 38
V. RESULTS AND DISCUSSION 38
A. Soil p1H, Total Potassium, and Cation 39 Exchange Capacity Results
B. X-ray Analyses 41
1. Typical Diffraction Traces 41
2. KCl Treatments 43
3. Heat Treatment 44
C. Differential Thermal Analyses 46
D. Glycol Retentions 47
E. Aluminum and Iron Extractions 47
F. Discussion 49
VI. RELATIONSHIP OF CLAY MINERALOGY TO THE SOIL PROFILE 51
VII. CONCLUSIONS 53
BIBLIOGRAPHY
55
PART TWO
ENGINEERING ANALYSES 74
I. INTRODUCTION 74
II. SCOPE OF THIS INVESTIGATION 74
A. Purpose 74
B. Previous Work 75
C. Clay Soils Studied 80
D. Engineering Tests and Experimental Methods 83
III. ENGINEERING TEST RESULTS 86
TABLE OF CONTENTS (continued) Page B. Consolidation Tests 87 1. M21, Batch 2 87 2. M21, Batches 3 and 4 91 3. California IlIite-Montmorillonite 93 C. Permeability Tests 94 D. Strength Tests
96
1. M21, Batches 1 and 2 - Undrained Shear 96 2. M21, Batches 1 and 2 - Drained Shear 99
3. M21, Batch 3 101
IV. CONCLUSIONS L104
A. M21, Batches 1 and 2 104
B. M21, Batches 3 and 4 1o6
C. California Illite-Montmorillonite 1o8
BIBLIOGRAPHY 110
PART THREE
MEASUREMENT OF SOIL FABRIC USING X-RAY TECHNIQUES 147
I. INTRODUCTION 147
II. PREVIOUS WORK 148
III. EXPERIMENTAL PROCEDURE 151
A. Equipment 151
B. Preparation of Fabric Extremes 151
C. Preparation of Soil Samples for X-ray 152
B. Fabric of Clay 'Flocs (M21, Batch 3) 154 C. Fabric of Anisotropically Consolidated Clays
(M21, Batch 3) 155
D. Fabric Within Direct Shear Specimens 156 E. Fabric in the Failure Zone of a Triaxial Sample 158
F. Additional Fabric Studies 159
VI. CONCLUSIONS 160
BIBILTOGRAPHY 162
RECOMIMEND ATIONS FOR ADDITIONAL WORK 175
BIOGRAPHICAL SKETCH OF THE AUTHOR 178
APPENDIX A
DETAILS OF MINERALOGICAL TEST PROCEDURES 180
I. FRACTIONATION PROCEDURES 180
A. M21, Batches 1 and 2 180
B. M21, Batch 3 180
C. M21, Batch 4 181
II. X-RAY ANALYSES 181
III. DIFFERENTIAL THERMAL ANALYSES 183
IV. CATION EXCHANGE CAPACITY DETERMINATIONS 184
A. Experimental Procedure 184
B. Preparation of Standards 185
TABLE OF CONTENTS (continued)
Page
V. TOTAL POTASSIUM DETERMINATIONS 186
VI. GLYCOL RETENTIONS 187
VII. EXTRACTION OF ALUMINUM AND IRON 187
APPENDIX B
DETAILS OF MINERALOGY - M21, BATCHES 1 and 2 192
I. COMPOSITION 192
II. X-RAY ANALYSES 192
III. CATION EXCHANGE CAPACITY DETERMINATIONS 194
IV. DIFFERENTIAL THERMAL ANALYSES 195
V. GLYCOL RETENTIONS 196
APPENDIX C
DETAILS OF MINERALOGY - N21, BATCH 3 202
I. HYPOTHESIS 202
II. RESULTS OF TRIAL RUNS 203
III. COMPOSITION 204
IV. X-RAY ANALYSES 205
A. Typical Patterns 205
B. Heat Treatment 206
C. Potassium Treatments 207
V. CATION EXCHANGE CAPACITY DETERMINATIONS 209
VI. DIFFERENTIAL THERMAL ANALYSES 209
VII. GLYCOL RETENTIONS 210
TABLE OF CONTENTS (continued)
Page APPENDIX D
DETAILS OF MINERALOGY - 1421, BATCH 4 216 I. CATION EXCHANGE CAPACITY, TOTAL POTASSIUM,GLYCOL 216
RETENTION
II. X-RAY ANALYSES 217
III. DIFFERENTIAL THERMAL ANALYSES 218
APPENDIX E
RESULTS OF PILOT RUNS ON CLAY 221
I. PRELIMINARY TESTS ON 121, BATCH 2 221
II. PILOT RUN ON M21, BATCH 3 222
A. Cation Exchange Capacity and Total Potassium 223
B. Glycol Retention 223
C. Differential Thermal Analyses 224
D. X-Ray Analyses 224
APPENDIX F
LIST OF FIGURES Title
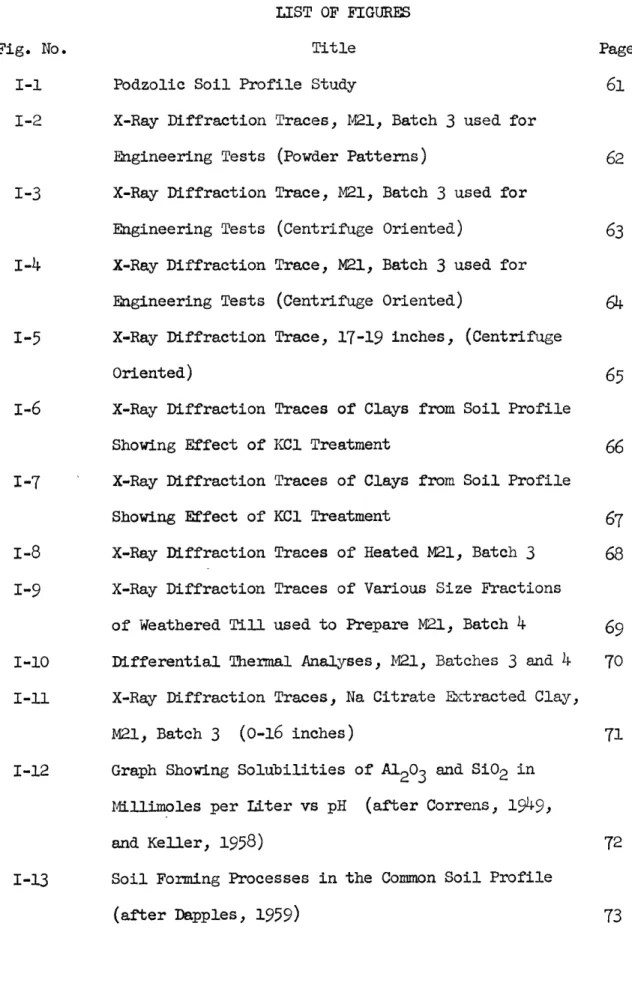
Podzolic Soil Profile Study
1-2 1-3 1-4 1-5 X-Ray Diffraction Engineering Tests X-Ray Diffraction Engineering Tests X-Ray Diffraction Engineering Tests X-Ray Diffraction Oriented) X-Ray Diffraction Showing Effect of X-Ray Diffraction Showing Effect of X-Ray Diffraction X-Ray Diffraction of Weathered TillDifferential Thermal Analyses, M21, Batches 3 and 4 X-Ray Diffraction Traces, Na Citrate Extracted Clay, M21, Batch 3 (0-16 inches)
Graph Showing Solubilities of Al 203 and S102 in
Millimoles per Liter vs pH (after Correns, 1949, and Keller, 1958)
Soil Forming Processes in the Common Soil Profile (after Dapples, 1959)
Fig. No.
I-1
Page 61 Traces, 1421, Batch 3 used for
(Powder Patterns)
Trace, N21, Batch 3 used for (Centrifuge Oriented)
Trace, M21, Batch 3 used for (Centrifuge Oriented)
Trace, 17-19 inches, (Centrifuge
Traces of Clays from Soil Profile KCl Treatment
Traces of Clays from Soil Profile KCl Treatment
Traces of Heated M21, Batch 3 Traces of Various Size Fractions used to Prepare M21, Batch 4 1-7 1-8 1-9 I-10 I-11 1-12 1-13
Fig. No. II-1 II-2 11-3
II-4
II-5
Photograph of
Consolidation
Consolidation
Consolidation
Consolidation
Consolidation
Consolidation
Vane Strength Testing Apparatus
Curves (M21, Batch 2)
Curves (M21, Batch 2 - collapsed) Curves (M21, Batch 2)
Curves (M21, Batch 3)
Curves (M21, Batch 4)
Curves (M21, Batches 2, 3 and 4)
Page
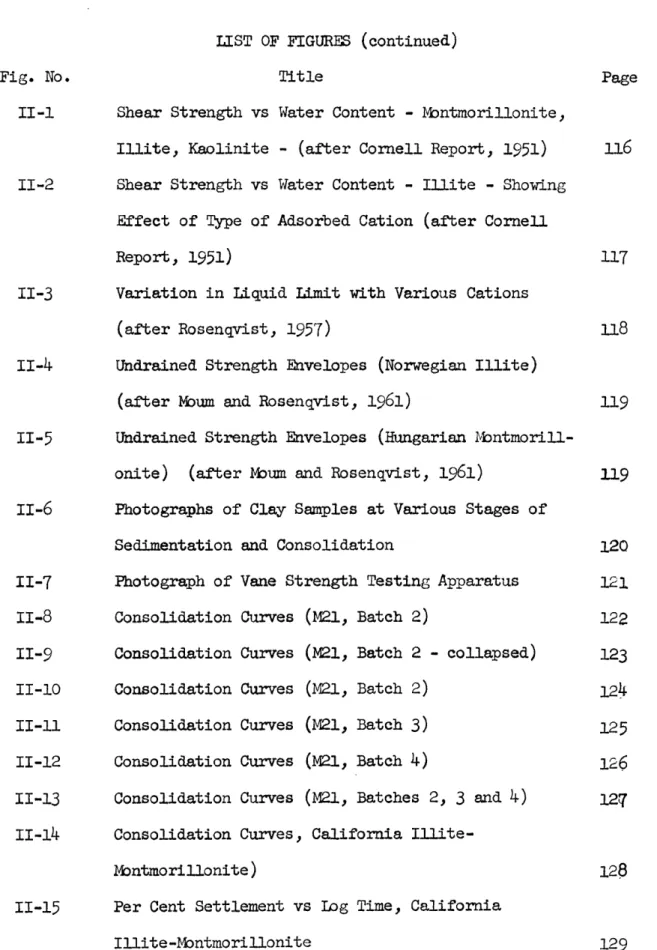
TitleShear Strength vs Water Content - Mbntmorillonite, Illite, Kaolinite - (after Cornell Report, 1951) Shear Strength vs Water Content - Illite - Showing Effect of Type of Adsorbed Cation (after Cornell
Report, 1951)
Variation in Liquid Limit with Various Cations (after Rosenqvist, 1957)
Undrained Strength Envelopes (Norwegian Illite)
(after Moum and Rosenqvist, 1961)
Undrained Strength Envelopes (Hungarian
Motntmorill-onite) (after Mbum and Rosenqvist, 1961)Photographs of Clay Samples at Various Stages of
Sedimentation and Consolidation
Consolidation Curves, California
Illite-Montmorillonite
)
Per Cent Settlement vs Iog Time, California
Illite-bntmori onited
Permeability vs Consolidation Pressure (M21, Batch 2)
128
129
130
117 118 119119
120
121 122123
124 125 126127
II-7
11-8
11-9
II-10
II-11
11-12
11-13
11-14
11-15LIST OF FIGURES (continued)
Fig. No. Title Page
11-17 Permeability vs Voia Ratio (M21, Batch 2) 131
11-18 Permeability vs Consolidation Pressure (M21, Batch 3) 132
11-19 Permeability vs Void Ratio (M21, Batch 3) 133
11-20
Permeability vs Consolidation Pressure, California
134
Illite-Montmorillonite
11-21
Permeability vs Void Ratio, California
Illite-Montmorillonite
135
11-22
Undrained Shear Strength vs Maximum Past Pressure
(M21, Batches 1 and 2)
136
11-23
Undrained Shear Strength vs Water Content
(M21, Batches 1 and 2)
137
11-24
Undrained Shear Strength vs Maximum Past Pressure
(M21, Batches 1 and 2)
138
11-25
Shear Strength Envelopes (M21, Batch 2)
139
11-26
Shear Strength vs Water Content (1421, Batch 2)
140
11-27
Shear Strength and Consolidation Pressure vs Water
Content (M21, Batch 2)
141
11-28
Shear Strength Envelopes (M21, Batch 3)
142
11-29
Drained Shear Strength vs Water Content (M21, Batch 3)143
11-30
Shear Strength vs
Water Content (H21,
Batch 3)
144
11-31
Drained Strength and Effective Stresses vs Water
Content (M21, Batch 3)
145
Fig. No. Title
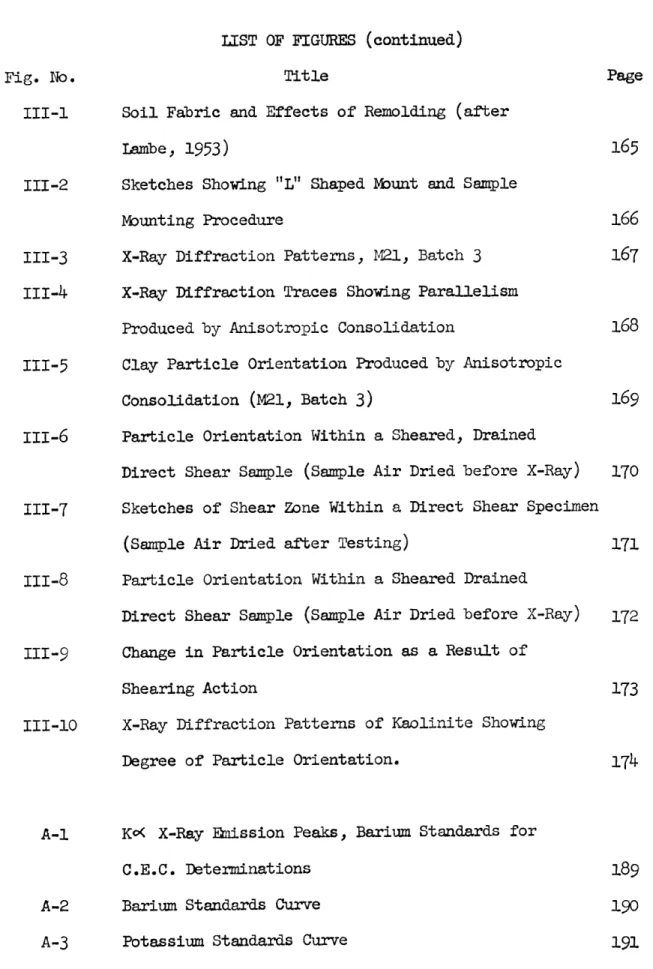
III-1 Soil Fabric and Effects of Remolding (after
Lambe, 1953) 165
111-2 Sketches Showing "L" Shaped Mount and Sample
Mounting Procedure 166
111-3 X-Ray Diffraction Patterns, M21, Batch 3 167 III-4 X-Ray Diffraction Traces Showing Parallelism
Produced by Anisotropic Consolidation 168
111-5 Clay Particle Orientation Produced by Anisotropic
Consolidation (M21, Batch 3) 169
III-6
Particle Orientation Within a Sheared, DrainedDirect Shear Sample (Sample Air Dried before X-Ray) 170
111-7 Sketches of Shear Zone Within a Direct Shear Specimen
(Sample Air Dried after Testing) 171
111-8 Particle Orientation Within a Sheared Drained
Direct Shear Sample (Sample Air Dried before X-Ray) 172 111-9 Change in Particle Orientation as a Result of
Shearing Action 173
III-10 X-Ray Diffraction Patterns of Kaolinite Showing
Degree of Particle Orientation. 174
A-1 KC X-Ray Emission Peaks, Barium Standards for
C.E.C. Determinations 189
A-2 Barium Standards Curve 190
LIST OF FIGURES (continued)
Fig. No. Title Page
B-1 Light Intensity Traces of X-Ray Film Patterns
(M21, Batch 2) 198
B-2 X-Ray Diffraction Patterns (M21, Batch 2) 199
B-3 Light Intensity Traces of X-Ray Film Patterns
(1421, Batch 2) 200
B-4 Differential Thermal Analyses (1421, Batch 2) 201
C-1 X-Ray Diffraction Traces, M21, Batch 3 used for
Engineering Tests (Centrifuge Oriented) 213
C-2 X-Ray Diffraction Traces, M21, Batch 3 used for
Engineering Tests (Centrifuge Oriented) 214
C-3 Differential Thermal Analyses, v21, Batch 3 used
for Engineering Tests 215
D-1 Differential Thermal Analyses, Various Size Fractions of Weathered Till used to Prepare
M21, Batch 4 220
E-1 Barium K-< Peaks, 1421, Batch 2, C.E.C. Determinations
Two Size Fractions 229
E-2 Differential Thermal Analyses, 121, Batch 2,
Showing Effect of Fractionation 230
E-3 Differential Thermal Analyses, M21, Batch 3,
Three Size Fractions 231
E-4 X-Ray Diffraction Traces, Centrifuge Oriented
Fig. No. Title Page
F-1 Glycol Retention vs Water Peak Area 236
F-2 Cation Exchange Capacity vs Glycol Retention 237 F-3 Cation Exchange Capacity vs Water Peak Height 238
LIST OF TABLES Table No. I-I I-II II-I II-II II-III II-IV II-V III-I B-I C-I C-II C-IIIl D-I E-II E-III E-III F-I Page
59
6o
TitleMineral Data for Soil Profile
0 o
14A:lOA Peak Height Ratios (Showing Effect of 24 hour KCl Treatments)
Unconfined Compression Strength Data (M,21, Batches 1 and 2)
Vane Shear Strength Data (M21, Batches 2 and 3) Drained Direct Shear Strength Results (M21, Batch 2) Drained Direct Shear Strength Results (121, Batch 3) Index Tests on Test Clays
Fabric o' Anisotropically Consolidated Clays
M21, Batch 2, Mineralogical Data (90o <2 microns) M21, Batch 3, Mineralogical Data (Smaller than
0.4
microns)
o 0
Ratio 14A:lOA Peak Heights Ratio 14A:lOA Peak Heights
M21, Batch 4, Mineralogical Data (Whole Soil) Pilot Run, M21, Batch 2, Mineralogical Data Pilot Run, M21, Batch 3, Mineralogical Data
o 0
Ratio 14A:lOA Peak Heights (Pilot Run, Batch
3)
Relation of Water Peak Area and Height to Glycol Retention and Cation Exchange Capacity (M21, Batches2, 3 and 4)
235 111 112 113 114 115 164 197 211 212 212 219 226 227 228 2350 =
-8cm
A angstr8m unit = 10 cm.C.E.C. cation exchange capacity (m.eq./lOOg.) D.T.A. differential thermal analysis
G.P.O. glycerol saturated, pressure oriented samples for x-ray film studies, and glycol saturated, centrifuge oriented
samples for x-ray diffraction studies.
ef final void ratio
Wf final water content
St sensitivity
KoC K9( energy level x-ray emission quantitatively measured for Ba, K, Al and Fe determinations using x-ray spectro-meter.
C< cation polarizability as discussed by Rosenqvist
/P
parts per thousand (solution concentration)micron = 10-3 mm.
0cu undrained friction angle obtained from vane shear tests d drained friction angle obtained by direct shear tests
vertical consolidation pressure
effective stress on the failure plane at failure in direct shear tests
particle to particle contact stress t'max maximum shear stress
PREFACE
It has been known for some time that potassium deficient or degraded clays tend to fix potassium when they enter the marine environment. This fixation results in a layer lattice contraction
and an expulsion of the interlayer water. These reactions have been called clay mineral "diagenesis" (change in mineralogy after deposition) by some writers and cation exchange with fixation by other writers.
The object of the research in this' thesis was to determine the effects of potassium fixation and cation exchange on the
engineering properties of degraded illite or vermiculite in saline environments. Existing data on the effects of cation exchange are fairly abundant but frequently difficult to assess. The effects of rapid mineralogical change resulting from potassium fixation were largely a matter of speculation.
Most of the research was done on a potassium deficient soil developed in a New England glacial till under conditions of Podzolic weathering. Initial engineering tests were run on clay batches
containing about
15
per cent of collapsible vermiculite. The results were very encouraging; so a pilot run was made to see if the vermicu-litic component could be increased by fractionation. The results of this run suggested that this could be done; so two more batches of fine clay were prepared. When these two batches did not fix potassium as expected, extensive mineralogical analyses were performed to find out why. These studies led to an analysis of the soil profile and some of the weathering conditions existing therein.The thesis is divided into three parts to facilitate reading. Although somewhat related, each part is more or less a distinct unit. Part One, which is the geological part of the thesis, briefly describes
the mineralogical analyses performed on the batches of clay. The relationship of the clay mineralogy to the soil profile and weathering conditions is discussed. Part Two describes the engineering analyses performed on the clays and Part Three contains the preliminary
results of an x-ray diffraction study of soil fabric.
A summary of the results of all three parts may be found at
the beginning of the thesis. The relationship between the three parts is brought out in this summary.
SUMMARY
The purpose of the research described in this thesis was to determine the relative effects of potassium fixation and ordinary cation
exchange on the engineering properties of clays in controlled salt
en-vironments consisting of NaCl and KCl.
It has been known for some time
that degraded illites and vermiculites tend to fix potassium and alter
to illite when they enter the marine environment.
This change has been
called "diagenesis" by some writers and cation exchange with fixation
by other writers. It is hoped that the work in Parts One and Two ofthis thesis
will
help clarify the role that potassium fixation plays
in the engineering properties of marine clays.
Part One of the thesis discusses the geological and mineralogical
characteristics of the clays subjected to engineering testing.
The
clays were obtained from the upper part of a Podzolic soil profile
developed in a New England glacial till.
Acid weathering had been
fairly extensive, reducing the potassium content of the clays to a
low level.
Unfortunately, the potassium fixation properties of the
clays were not very pronounced despite the potassium deficiency.
The
reason for this is the presence of interlayer aluminum and iron which
replaced the potassium.
In the upper portion of the soil profile,
this resulted in the chloritization of the 2tl layer clays.
This
chloritized or partially chloritized clay will not fix much potassium,
as the charge deficiency has already been balanced by the aluminum
and iron,
The clay products of weathering developed in this type of soil
profile are very complex, consisting in this case of illite,
vermicu--lite, swelling clay, randomly interlayered minerals, and a variable
amount of chlorite.
Most of the minerals were probably developed
from a primary mica which had much of its potassium striped out during
weathering and replaced by variable amounts of aluminum and iron.
Clay mineral assemblages very similar to this have been described
recently by a number of agronomists and clay mineralogists.
Some
noteworthy contributions are by: Rich and Obenshain (1955),
Rich (1960), Tamura (1956
and 1958), Sawhney (1958), and Brydon et al.
(1961).
Long-term KCl treatments performed
in an attempt to diffuse
in potassium appear to have increased the cation exchange capacity by
replacing some of the fixed aluminum.
Only in Batches 1 and 2, which
were the coarsest clays, was any permanent fixation of potassium
observed.
Part Two describes the engineering tests performed on the
clays analyzed in Part One.
The effects of potassium fixation and clay mineral collapse
were picked up only in M21, Batches 1 and 2, and to some extent in an
interlayered illite-montmorillonite from the Santa Monica region of
California.
Generally speaking, cation exchange (Na replaced by K
during leaching) had the greatest effect on the clay. When deposited
in an expanded form, the KCl and NaCl leached clays from M21,
former existed at a higher void ratio at any given consolidation pressure. When deposited in a semi-collapsed state, the curves of the K and Na clays came much closer together. Although it is
believed that potassium fixation is responsible for the differences in the two sets of results, the effect may be an indirect one.
Differences in the soil structure caused by differences in the flocculated fabric may be the primary control.
In the clays of M21, Batches 3 and
4,
which did not fixpotassium, the KCl leached clays invariably existed at a higher void ratio at a given pressure than the NaCl leached clays. The greater the K:Na ratio, the greater was the spread between curves.
The permeability differences were not large, but at either a given void ratio or consolidation pressure, the potassium clays were never less permeable than the sodium clays, and often more permeable. The differences in permeability were largest for clays with the
highest K:Na ratios,
Although the undrained strengths of the sodium and potassium clays were nearly the same, small interesting differences were noticed. At a given water content, the potassium clays were always stronger in undrained shear. This strength difference appeared to be larger when the clay was collapsed before sedimentation. At a given consolidation pressure, the strength relationship depended on the form of the clay when deposited. When deposited in an expended form and then KC1 leached, the Na clays were stronger than the K clays.
When deposited in a collapsed state, the K clays were the stronger. It is thought that differences in the flocculated structure accompanied
by different degrees of particle reorientation during consolidation
are the explanation. The effects of layer lattice collapse are believed to be minor for this clay.
The effect of simple ion exchange was to increase the strength of the K clay at any consolidation pressure or water content. The effect of potassium fixation was to reverse this trend. For the clays studied here, fixation effects were minor because 1) only a small amount of the clay fixed potassium and 2) the clays were consolidated after KCl leaching.
The drained shear strengths showed that the potassium clays had much higher friction angles than the sodium clays. For instance, in one batch of clay, friction angles of 200 and 260 were obtained for the sodium and potassium leached clays respectively. Plots of drained shear strength versus water content at failure showed that the potassium clays were much stronger than the sodium clays at any given water content within the range studied. These plots also showed that the strengths were greatly dependent on the K:Na ratios.
Indeed, the K:Na ratio, which is a measure of the completeness of KCl leaching, had a large effect on the separation of consolidation curves, permeability plots, and the strength results.
The effects of KCl leaching on the engineering properties of
the clays are consistent with either Rosenqvist
ts concepts of cation
polarizability or concepts of ionic potential and the size of thehydrated radii of the adsorbed cations. Either theory indicates
that the potassium clays should be stronger than the sodium clays,
provided no interlayer wateris forced out by the fixation of
potassium. The role of the interlayer water was obscured by the
effects of cation exchange in most of the tests. However, the un.
drained strengths of M21, Batches 1 and 2 showed some indirect
effects of this collapse as did the liquid limit results on the California clay.It is observed in Part One that KCl leaching actually tended to increase the exchange capacity of some of the clays, probably by removing some adsorbed aluminum. For this reason the clay was used only once, if possible, for engineering testing. Consolidation
34,
which was run on clay already used in Consol. 33 appears to have theonly misplaced consolidation curve.
Some of the effects of cation exchange were also picked up in the fabric study and applied to the engineering test results. For example, the sodium clays of M21, Batch 3 existed at a lower void
ratio than the potassium clay at any given consolidation pressure.
The fabric study showed that the platelets of clay were more nearly
parallel (horizontally) than the potassium clays, hence their lowervoid ratio (i.e., the Na clays were more easily reoriented from their
original fabric during consolidation).
The fabric study in Part Three showed that x-ray diffraction
methods could be used to determine average particle-to-particle
arrangements.
For instance, failure planes in triaxial and direct
shear specimens were picked up by measuring changes in particle
orientation brought about by shear.
Appendices containing the details of the mineralogical
analyses and the details of some of the testing procedures may be
found at the rear of the thesis.
PART ONE
MINERALOGICAL ANALYSES
I. INTRODUCTION
During acid weathering, previously existing soil micas and
illities have some of their interlayer potassium removed.
These
"degraded" minerals generally expand to around 14A and have x-ray
characteristics somewhat similar to vermiculite.
When treated with
0
KC1 solutions, they collapse back to 10A illite or mica by fixing
potassium and expelling the interlayer water.
When degraded illites enter the marine environment, potassium
is selectively adsorbed from the sea water and fixes in
the interlayer
position. This reaction has been called "diagenesisu (mineral
altera-tion after deposialtera-tion) by some writers, and caaltera-tion exchange with
fixation by other writers.
The purpose of Parts One and Two of this thesis is to study
the effects of potassium fixation and
ordinary cation exchange on
the engineering properties of degraded illites or vermiculites.
The
mineralogical analyses in Part One were originally intended to
supplement the engineering test data presented in Part Two.
Wen
the degraded soils did not
fix
potassium as expected, extensive
mineralogical tests were
run to
find out why. This led to a study
of the soil profile and the weathering conditions existing
in it.
These studies proved to be very interesting and informative, and are
presented in this part of the thesis, separately from the engineering
The mineralogical data from the clay batches are summarized
and brought together with the soil profile data.
The details of the
mineral work on the four batches of engineering test clay are
presented in Appendices B, C, and D.
The clay mineral assemblage is related to the weathering condi-4
tions and position within the soil profile.
Extensive potassium
treatments are described.
The reason little or no fixation occurred
has been determined and explained.
II.
PREVIOUS W)RK
A. General Discussion
The release and fixation of potassium in micaceous soils has
been a subject of much study by agronomists for many years. Many
laboratory and field studies have been performed and reported in the
literature.
The geological significance of potassium fixation,
however, was not fully realized until recently when a great controversy
arose over the causes and extent of clay "diagenesis" in the marine
environment.
B, Potassium Release and Fixation in Micaceous Soils
According to Kunze and Jefferies (1953), potassium fixation in
degraded soils was first recognized by Dyer in 1893. In 1934, Volk
recognized more mica in potassium fertilized plots of ground and
attributed the increase to potassium fixation. The work of Barshad
(1948 and
1950)
did much to explain the interrelationship between
soil micas and vermiculites and the release and fixation of interlayer
cations. By leaching a biotite with 1 Normal MgCl
2for about three
months, Barshad
(1948) was
able to displace much of the interlayer
0
potassium and induce a layer lattice swelling from 10.3 to
14.5
A.
'When potassium was added to this biotite and to vermiculites, they
0
collapsed down to around
10A.
He also found that the type of cation
present greatly affected the differential thermal curves.
This is
discussed later.
Dyal and Hendricks (1952) produced a mixed layer assemblage
by addaig potassium
to a montmorillonitic soil. They noticed a drop
in glycol retention resulting from potassium fixation and layer
lattice contraction.
Kunze and Jefferies (1953) measured basal spacing shifts in
potassium treated soils and attributed the changes to fixation.
Williams and Jenny (1952) report carbonic acid leaching studies
in which they removed fixed potassium at pH values less than
3
and
exchangeable potassium only at higher pH
values.
Recently (since 1957), a great deal of work has been reported
on potassium release and fixation in micaceous soils.
The kinetics
of potassium release from mica has been reported
in
a number of
articles by Mortland and Ellis. Ellis and Mortland
(1959)
report
that potassium is released more rapidly from weathered than un~
weathered biotite.
They suggest that there is a loss of charge
during weathering which enables easier release of potassium.
This
loss of charge is probably related to oxidation of ferrous iron in the
particles lost their potassium before larger particles.
Similar
results
are reported by Reed and Scott (1960). Other articles on
the release and fixation of potassium are: Mortland and Ellis
(1959),
Mortland (1961), DeMumbrum (1958 and 1959), Sawhney, Jackson, and
Corey (1959).
Jonas and Thomas (1960) conducted a series of
experiments on
a
less than 2 micron clay having a cation exchange capacity of
70 m.eq./100 g.
They found that the clay collapsed completely at
high KCl concentrations (1 Normal).
At very low concentrations the
clay was fully expandable and at intermediate concentrations the
clay would expand in glycol but not in water. At a threshold
con-centration of about tx10~
3N KCl, a sudden marked collapse was observed.
This effect of pore fluid concentration on the amount of layer lattice
collapse would markedly affect any studies on the role of interlayer
water on the engineering properties of a clay.
This effect was
noticed on the California
illite-montmorillonite discussed in
Part Two of this thesis.
Jonas and Roberson (1960) studied the effects of particle size
on clay mineral expansion.
They found that particles of very high
charge deficiency would
expand
if the particles were
fine enough.
They hypothesized that size has little effect on the expansion
properties of particles of low charge density. A large particle with
a high charge, however, would be very difficult to expand. The
previous two studies indicate that both the grain size of the clay
fractions and the concentration of the KCl solutions will affect the
C. Marine Clay Mineral Diagenesis
Clay mineral diagenesis means a change in mineralogy during and
after deposition but before any lithification takes place. Thesignificance of the term diagenesis depends in large measure on how
the clay minerals are identified.
The effects or ordinary cation
exchange are excluded from diagenesis.
The effect of cation fixation
on
the (0OX) spacing of clay minerals forms the basis
of current
con-troversy on diagenesis.
Some authors consider potassium fixation an
exchange reaction only, despite its effect on degraded illites and
vermiculites.
They say that the 2:1 layer crystal units and the
charge deficiency within these units have not changed, and we do not have diagenesis. Others consider the change in (001) spacing from0 0
14
A to 10 A to be a mineralogical change and hence diagenesis.The widespread concept of diagenetic alteration of most clay minerals to illite under marine conditions (e.g., Taylor, 1952) has
been strongly criticized
recently and today much less importance is
attached to it. Recent field and laboratory work has shown that diagenesis of clay minerals is a very slow and incomplete process
and that only certain types of expandable clays are really susceptible
to change.
In general, the clay minerals found in a basin of deposition
are the same as those formed in the source region.
Laboratory studies by Witehouse and McCarter (1958) showed
that their montmorillonite changed slowly with time to illite and
modification to illite and chlorite. The changes they observed were more dependent on the Mg:K ratio than the total salinity of their
artificial sea water. The most effective Mg:K ratio was about 9.h for a chlorinity range from 7.2 to 19.4 g./kilogram and potassium content not less than 0.005 molar. These values varied somewhat
depending on the grain size of the montmorillonite. Below a chlorinity of 7.2 and a potassium concentration of 0,003 to 0.005 molar, the
amount of alteration was greatly reduced. No diagenetic alterations were observed in either kaolinite or illite.
It is interesting to note that the limiting potassium contents of 0.003 to 0.005 molar are about the same as Jonast and Thomas'
threshold KC1 concentration above which they got pronounced collapse 0
to 10 A. Jonas and Thomas used pure KC1 solutions whereas Whitehouse and McCarter used artificial sea water so the two systems are not necessarily comparable. It seems to this writer that the charge deficiency on the montorillonites studied may have been such that potassium fixation and chloritization progressed slowly with time.
Powers (1953) found a progressive decrease in expandable clay minerals seaward from the Patuxent River, Maryland. He found more
illite and c%lorite towards the sea and attributed the changes to diagenesis.
Nelson (1958) attributed changes in the bottom sediments of the Rappahannock River to diagenesis. He observed a progressive decrease in the amount of collapsible clay seaward. Nelson (1960)
modified this interpretation after he observed what he considered
authiginic
feldspar in some of his downstream samples.Weaver (1958 (a) and (b) ) suggests that diagenetic changes are nearly nonexistent. His argument is based on a careful x-ray study of the variations in the morphology of illite and chlorite. He concludes that most ancient illites are of the 2M variety and
are elastic fragments of muscovite formed at high temperature. The other varieties (1M and lMd illite) represent low temperature forms produced by weathering and possibly diagenesis. He further states that most chlorites are trioctahedral and thus probably detrital. Diagenetic chlorites should be chiefly dioctahedral if derived from montmorillonites which are chiefly dioctahedral. One must be cautious here, however, because recently a large number of pseudo--chlorites produced from dioctahedral mica have been observed
in soil profiles and aqueous sediments. These are discussed later. Diagenetic modifications are suggested as a mechanism of
glauconite formation by Burst (1958 a,
1958
b) and Hower (1961). Old glauconites contain more collapsed layers and fixed potassiumthan recent glauconites. Both Burst and Hower hypothesize that ferrous iron replaces aluminum in the octohedral position of the expandable clay layers, thus increasing their charge deficiency. With the increased charge deficiency, the tendency is to fix potassium and collapse to 10
A.
the
deficiency of 2:1 layer units. It is this writerts opinion that thisV A change is not truly diagenetic. The structural modifications of glauconite hypothesized by Hower (1961) and Burst (1958a, 1958b) are truly diagenetic changes. It is probable that similar changes occur in clay minerals other than glauconites and that illite-like minerals tend to develop from expandable 2:1 layer clays with time. These changes progress very slowly even on a geological scale, and certainly do not affect the engineering properties of sediments. On the other hand, clay mineral collapse produced by potassium fixation is a
fairly rapid process which may have a large effect on the engineering properties of a clay deposit.
D. The Role of Aluminum
It has been known for some time that most clays contain some adsorbed aluminum. For example, Carroll and Starkey (1960) suggest that acid treatment of their clays resulted in the adsorption of Al which was not exchangeable by Ca, Mg, and Na in their titration experiments. The role that aluminum plays in restricting both expansion and collapse of clay minerals is described later in the discussion of the experimental results.
III. METHOIS OF MINERALOGICAL ANALYSIS
Consistent methods of analysis have been developed for the mineralogical investigations of the vermiculitic soils under con-sideration. The following tests have been runt
1. X-ray analyses by film patterns and diffraction traces.
2. Differential thermal analyses.
3.
Cation exchange capacities by x-ray spectrometer.4.
Total potassium by x-ray spectrometer.5.
Glycol retentions.6. Extractable aluminum and iron determinations.
The methods of analysis are briefly described below. The reader is referred to Appendix A for any additional details. Enphasis is placed on a "barium x-ray spectrographic analysis" used for determining the cation exchange capacities.
A. X-Ray Analyses
Most of the x-ray work presented in the thesis was performed with an x-ray diffractometer complete with geiger scaler and
automatic recorder. Copper radiation generated at 40 kilovolts and 15 milliamps was used for all of this work, The diffraction
equipment is located in the Department of Geology and Geophysics. Oriented samples were prepared by dispersing a sample in distilled water, using an ultrasonic vibrator and then centrifuging the suspension for about twenty minutes at 2000 r.p.m. over a
porous ceramic plate. During this time, all of the water was drawn through the plate leaving a highly oriented, glossy layer of clay. The sample can be x-rayed wet, air dry, or glycol saturated.
Powder patterns were obtained by x-raying a level surface of
clay powder.
A rectangular depression cut in a ceramic plate was
filled with powder, scraped off level, and x.-rayed.
Some of the initial x-ray analyses were performed using a film
camera in the Soil Engineering Division, Department of Civil Engineering.
Some of the films were run through a light intensity meter forpresentation as an x-ray trace. (See M21, Batches 1 and 2, Appendix B.) B. Differential Thermal Analyses (D.T.A.)
Clay samples to be thermally analyzed were air dried and ground down to 100 mesh. The clays were then brought into equilibrium with an atmosphere of about
50
per cent relative humidity. This was doneby placing the clay over a saturated solution of hydrous calcium
nitrate for at least seven days. The relative humidity of the oven
was not controlled.
Additional equipment data are given in Appendix A.
The purpose of equilibrating the clays with an atmosphere at
50
per cent relative humidity is to get a water peak of some
significance. Unpublished data by Martin (M.I.T.) indicates thatthe size of the water peak is related to the cation exchange capacity and glycol retention of the clay. Any changes in cation exchange capacity due to cation fixation should be reflected in the size of the water peak.
C.. Cation Exchange Capacities (C.E.C.)
Clay minerals having high charge deficiencies tend to fix certain sized cations. Degraded micas and illites, similar to the
soil being studied, have the greatest fixing powers because of their
high charge deficiency. The ammonium cation fixes in this type of soil, so that if the usual ammonium exchange capacity method is used,
cation exchange capacity values which are too low are obtained.
Sawhney, Jackson, and Corey (1959) discuss the relationship between
exchange capacity and fixation of certain cations.
For this reason, it was decided that a barium x-ray
specto-graphic method of analysis should be used. The method involves washing the clay in barium chloride until it is homoionic in Ba+.The sample is washed free of excess salt and placed in an x-ray
spectrometer. The amount of adsorbed barium is determined by comparing
the size of the barium Ko peak with peaks obtained on previously
prepared standards.
The cation exchange capacity is expressed in
milliequivalents of barium per 100 grams of clay (m.eq./100g.).
The details of this technique are given in Appendix A.
The procedure was worked out with the assistance of Dr. Martin of
the Soil Engineering Division and Dr. Hower of the Department of
Geology and Geophysics.
D. Potassium Analyses
Total potassium was determined using the same x-ray spectrometer
that was used for
the cation exchange capacity determinations.
The
details of the method are described in Appendix A.E. Glycol Retentions
The retention of ethylene glycol by clays is a useful indicator of soil properties and possibly surface area. The method used was that of Dyal and Hendricks (1950) as modified by Martin (1955). The method will not be discussed further in this report.
F.
Extraction of Aluminum and Iron
Interlayer aluminum
and iron were extracted by the sodium
citrate method of Tamura (1958).
The method involved boiling a clay
sample several times in one Normal sodium citrate and decanting the
supernatant after centrifuging.
Aluminum and iron were determined
spectrographically from strips of filter paper immersed in the
extracts and air dried.
An
earlier method of extraction involved washing a clay sample
in one Normal NaCl brought to pH
3
with HCl.
Aluminum and iron were
determined colorometrically.
This extraction procedure was
un.-successful.
IV. LOCATION OF SOIL PROFILE
The clay used for engineering testing was obtained from the
upper sixteen inches of a soil profile developed in a New England
glacial till.
The soil profile itself, which is typical of the
"Brown Podzolic Group",
was studied mineralogically
to a depth of
55
inches. The profile occurs about ten feet down the side of a
large drumlin known as Orient Heights, located in Northeast Boston,
Massachusetts. The slope of this point is free of an organic cover.
V.
RESUL
TS AND DISCUSSION
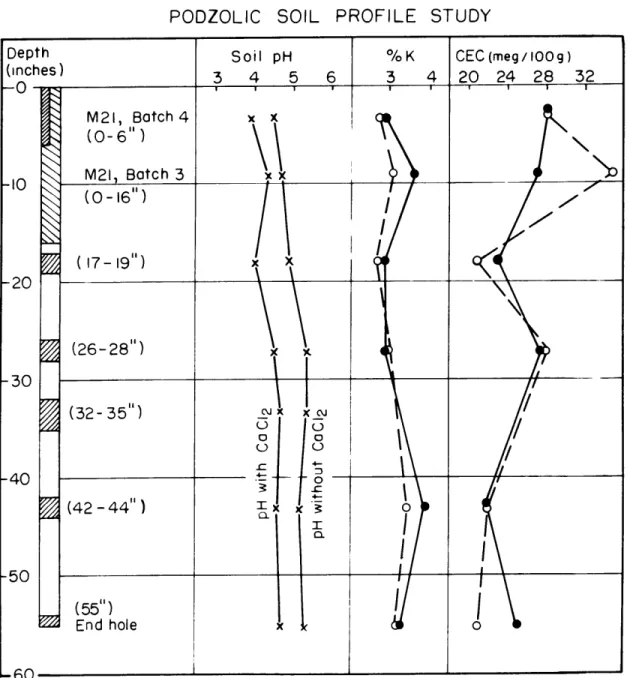
The locations of the samples taken from the soil profile and
fractionated for testing are shown in Fig. I-l. Although the samples
are not all of the same equivalent grain size, it is felt they are
comparable with one another.
A. Soil pH, Total Potassium, and Cation Exchange Capacity Results
Visual inspection of the soil profile indicated that the soil
was brown and completely oxidized throughout the depth studied.
The
bleached "A" horizon extended to a depth of no more than six inches.
The "B" horizon extended to a depth of about 24 inches and the C"
horizon beyond the depth explored.
Although precipitated iron was
observed in soil fissures down as deep as
50
inches, the greatest
concentration occurred between 20 and
24
inches giving the clay a
patchy appearance.
Soil pH values are given in Fig. I-1, which shows that the
ground waters are more acid near surface.
Two pH profiles representing
different methods of measu4rement are shown.
The higher values (lower
acidity) were obtained by soaking and stirring the soil samples in
demineralized water for about
45
minutes, and taking a pH reading
of the clear supernatant with a Beckman Zeromatic pH meter.
The
lower values (higher acidity) were taken on the same soil-water
mixes after enough CaCl
2had been added to bring the concentration
to 0.01 molar.
The results are quite significant, as they indicate
the presence of considerable adsorbed hydrogen.
This hydrogen is
probably present as hydronium, H3+0
.The addition of CaCl
2results
in the exchange of the hydronium by Ca++, giving an increase in the
H ion concentration and a lower pH.
One natural moisture content
determination gave a value of
12 per cent.
The soil
pH
was determined
using this value for all samples. A pH of 3.9 to
4.0
was obtained in
the upper part of the soil profile, increasing to about
4.7
with depth.
samples
are very low for such low values of total potassium. There
does appear to be an increase in exchange capacity towards surface;
the lower four samples average 23 m.eq./100g. and the upper two
average 32 m.eq./lOOg.
These low C.E.C.
values are caused by adsorbed
aluminum and iron and are discussed in detail later.
All samples in Table I-I were given five washes with 1 N KCl
over a period of 24 hours.
They
were
then made homoionic in barium
by the procedure described in Appendix A. In all but one case, there
was a small increase in per cent K.
The exchange capacity was
expected to drop as a result of this treatment.
It can be seen from
Table I-I that all but one sample remained the same or showed a slight
increase in C.E.C. Batch 3, which picked up 0.5 per cent K, showed a
drop
in
C.E.C. from
35 to 27
m.eq./100 g.
It is believed that adsorbed
aluminum may have been replaced by K in some of the samples. Lin and
Coleman (1960) and Coleman, Weed, and McCracken (1959) found that
potassium is one of the better neutral salts for displacing adsorbed
aluminum.
Making the natural clay homoionic in barium probably did
not remove any aluminum.
After the 24-hour KCl treatment, some of the
potassium which had replaced the aluminum was probably exchangeable,
hence the increase in C.E.C.
Batches
3
and
h
from the upper part of the profile were given
lh-oday
1N KC1 treatments, which involved about eight changes of
solution.
It was hoped that fixation would occur through diffusion.
In both cases the C.E.C. increased greatly and the total K decreased.
Once again these changes are attributed to the removal of Al by the
strong KCl solutions.
B. I-Ray Analyses
1.
Typical Diffraction Traces
X-ray diffraction traces of two powder samples of M21, Batch
3
(0-16
inches) are shown in Fig. I-2. The most obvious feature of
both curves is the very low intensity of the (00) reflections
compared with
the (h
k 0) reflections. This possibly is due to random
interlayering, which can reduce the size of the
(001)
peaks.
The
0
10 A illite peak is slightly better defined in the potassium clay.
0 0
The presence of a broad 3.50 A peak and the absence of a 3.66 A peak suggest a 2M rather than a 1M polymorphic crystal form. The slope of
0 0
the 2.57 A peak downward towards the 2.59 A spacing is also indicative
00
of a 2M structure. (The 2.59 A peak is stronger than the 2.57 A peak in 1 mica.) The (060) reflection at 1.501 1 indicates that the bulk of the clay is dioctahedral.
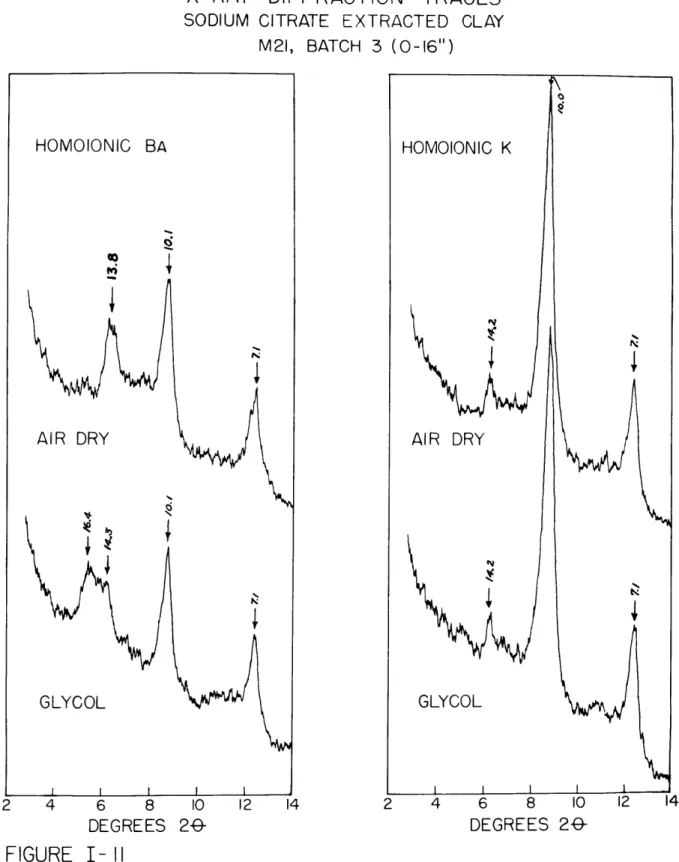
Patterns of centrifuge oriented, glycol saturated clay (M21, Batch 3), homoionic in sodium and potassium, are shown in Fig. 1-3 and
1-4.
The trace in Fig. 1-3 indicates that illite and a vermiculite-like0 0
Fig.
I-4
shows that a marked reduction in the vermiculitic phase has been produced by the presence of interlayer potassium. The highorder reflections are close to being at integral values of the (001) peaks. The two peaks at 4.29
A
and4.11
are difficult to explain. It is possible that they represent some high order reflection of a regularly interlayered mineral phase. The potassium treatment(Fig. I-4) had little effect on these two peaks, whereas it caused a large reduction in the high order vermiculite peaks. This suggests
that chlorite and illite may be the interlayer constituents. Lambe and Martin (1955) describe similar, strong, high order reflections at different d values, and ascribe them to regularly interstratified illite-chlorite mixtures. These two peaks were observed to be just as strong or stronger in Batch
h
(0-.6 inches), In Fig. 1-5, a dif-fraction trace of a potassium saturated sample from a depth of18 inches is pres6nted. The two peaks are barely visible in this
trace indicating that the interlayer complex is characteristic of the upper part of the profile only.
The
7 A peaks are stronger
than the
14 A
peaks in both
Fig. I-3 and
I-4.
This suggests that either kaolinite or iron chloriteis present in the samples. The very weak 3.55
1
peak after KCl
treatment (Fig. Ih) indicates that if kaolinite is present, it is a very minor constituent.
2. KCl Treatments
The effect of 24-hour, 1 N KMl treatments on the clay samples are shown in Figures 1-6 and I-7. The samples were made homoionic to barium and potassium and x-rayed air dry (Fig. I-6), and glycol
saturated (Fig. 1-7). Although barium tends to collapse vermiculites in the air dry state (Barshad,
1950),
these clays were x-rayed becausethey had already been used for the C.E.C. determinations. 0
The barium clay contains considerable
14
A mineral, as shown inFig. 1-6. Upon K saturation, this peak largely disappears, except for a pronounced hump or shoulder on the 10
A
peak, in all samples from a depth of greater than 17 inches. The KCl treatment had little if any effect on Batch4
from the upper 6 inches and only partially collapsed the Batch3
clay taken from 0 to 16 inches.Fig. I-7 shows similar trends for these same samples after saturation with glycol. The only difference is that the
14
A
peaks may be slightly better developed with less background between the14
and 10A
peaks.If one compares the
14
A:10 A
peak height ratios (Table I-II), taken from the traces in Figures 1-6 and 1-7, the collapse produced by potassium saturation is again obvious. For the air dried samples, the ratio is57
per cent smaller with potassium as the exchange ion in the four samples from 17 inches to55
inches depth. The upper two samples show much less collapse, the decrease amounting to only23 per cent and
40
per cent for Batches4
and 3 respectively. Similar trends were found in the glycolated samples.Samples of Batches 3 and
4
which were KCl treated and then washed out with either NaC1 or BaCl2, had very strong14
A peaks, indicating that most of the potassium was exchangeable and not fixed. The lh-day KC1 treatments actually produced less collapse than the 24-hour treatments. This is in accordance with the C.E.C. values, which also increased with the lL-day treatment. Additional data in this regard are presented in Appendix C on M21, Batch 3.3.
Heat TreatmentA sample of M21, Batch 3 (0-16 inches) was heat treated and x-rayed at successively higher temperatures. The results are shown in Fig. 1-8. The 1000 and 2000C treatments were for half an hour each. The 350* and
5000C
treatments involved heating the specimen in an oven as the oven temperature rose, and removing it when the required temperature was reached. The hot samples were put in a desiccator containing silica gel and carried to the diffractometer. X-ray time was about15
minutes, so that sufficient time was availablefor the re-expansion of any expanding minerals.
Air drying seems to have caused a great deal of collapse in a randomly interlayered phase, producing a high background between
141
and 10 Ji. This is in part caused by having sodium as the adsorbed cation (Barshad,1950).
The 100 0, 2000, and350 C treatments caused
the lh A peak to decrease in size until it was completely gone at 3500C.This gradual collapse is probably caused by the loss of hydronium water and hydroxyls from interlayer aluminum. Apparently this aluminum also prevented the re-expansion of the vermiculitic phase by water adsorption
during x-raying. Tamura (1956) reports progressive water losses and structural collapse with incremental heat treatments on a similar clay. These factors are discussed later.
The
500
0C treatment resulted in the sudden development of adouble peak at 13,8
A
and 12.3
A
while the 7.1
A
(002) peak nearly
vanished.
The shift of the (001) peak to a lower d value and an
increase in its intensity relative to the (002) peak are characteristics of iron chlorite (Martin,
1955).
Some interesting color changes accompanied the heat treatments. The sample of clay was a medium yellow brown in the air dry and
1000 C states. At 2000C it changed to a dark chocolate brown and at
350
C it became a very dark chocolate brown. This color change is attributed to the crystallization of amorphous iron (see D.T.A.discussion). At
500
C, the sample had changed to a dark golden browncolor.
X-ray diffraction traces were obtained from several size
fractions of the soil used to prepare M21, Batch
4
(0-6 inches). These are shown in Fig. I-9. The two fine fractions (<0.2 micron and (0.1 micron) are more poorly crystallized than the next two coarser fractions. They also appear to contain more expandable clay. The 5-2 micron clay and the 2-0.2 micron clay have very sharp14
and 7A
peaks. They also contain less potassium than the smaller than 0.2 micron clays. (See Table D-I, Appendix D.) This and the relative strength of the14
and0
cbloritized than the finer fractions. Jackson (1960) suggested that the coarser fractions should have a greater charge deficiency than the smaller fractions because they are not so intensely weathered. Aluminum would tend to fix in these coarser, freshly cleaved micas, blocking open the layers and enabling faster leaching of potassium from the coarse fractions. This is probably what has happened here.
C. Differential Thermal Analyses
Differential thermal curves for homoionic clays (Batches
3
and 4) at50
per cent relative humidity are given in Fig. I-10. The curves are all quite similar. One interesting feature is the flatter slopes of the high temperature side of the water peaks. This suggests a progressive loss of water as was observed in the "heat treatment-x-ray" study. The dip in the curve at 3000 to 3400C may represent the final dehydration of the vermiculitic phase of the clay. The 6000 hydroxyl peak is characteristic of illite and also iron chlorite which was identified in the x-ray patterns, A pseudochlorite produced by the fixation of interlayer aluminum during weathering may also be present. A consistent dip in the differential thermal curves at 6900 to 7000may be caused by this mineral.
A more distinctive water peak might have been obtained from a
clay sample homoionic in Ca or Mg. According to Barshad (1948), both Ba and Na tend to give one water peak for vermiculite whereas Mg and Ca give two distinctive peaks.