Comprehensive population-based genome sequencing
provides insight into hematopoietic regulatory mechanisms
The MIT Faculty has made this article openly available.
Please share
how this access benefits you. Your story matters.
Citation
Guo, Michael H.; Nandakumar, Satish K.; Ulirsch, Jacob C.; Zekavat,
Seyedeh M.; Buenrostro, Jason D.; Natarajan, Pradeep; Salem, Rany
M. et al. “Comprehensive Population-Based Genome Sequencing
Provides Insight into Hematopoietic Regulatory Mechanisms.”
Proceedings of the National Academy of Sciences 114, no. 3
(December 2016): E327–E336. © 2016 National Academy of Sciences
As Published
http://dx.doi.org/10.1073/pnas.1619052114
Publisher
National Academy of Sciences (U.S.)
Version
Final published version
Citable link
http://hdl.handle.net/1721.1/108856
Terms of Use
Article is made available in accordance with the publisher's
policy and may be subject to US copyright law. Please refer to the
publisher's site for terms of use.
Comprehensive population-based genome
sequencing provides insight into hematopoietic
regulatory mechanisms
Michael H. Guoa,b,c,d,1, Satish K. Nandakumara,e,1, Jacob C. Ulirscha,e, Seyedeh M. Zekavata,f,g,h, Jason D. Buenrostroa,
Pradeep Natarajana,f,g,h, Rany M. Salema,b,c,d, Roberto Chiarlei,j, Mario Mittk, Mart Kalsk, Kalle Pärnk, Krista Fischerk, Lili Milanik, Reedik Mägik, Priit Paltak,l, Stacey B. Gabriela, Andres Metspaluk, Eric S. Landera,m,n,2, Sekar Kathiresana,f,g,h,
Joel N. Hirschhorna,b,c,d, Tõnu Eskoa,b,d,k,2, and Vijay G. Sankarana,e,2
aBroad Institute of MIT and Harvard, Cambridge, MA 02142;bDivision of Endocrinology, Boston Children’s Hospital, Harvard Medical School, Boston, MA
02115;cDepartment of Genetics, Harvard Medical School, Boston, MA 02115;dCenter for Basic and Translational Obesity Research, Boston Children’s
Hospital, Boston, MA 02115;eDivision of Hematology/Oncology, Boston Children’s Hospital and Department of Pediatric Oncology, Dana-Farber Cancer
Institute, Harvard Medical School, Boston, MA 02115;fCenter for Human Genetic Research, Massachusetts General Hospital, Boston, MA 02214; gCardiovascular Research Center, Massachusetts General Hospital, Boston, MA 02214;hCardiology Division, Department of Medicine, Massachusetts
General Hospital, Boston, MA 02214;iDepartment of Pathology, Children’s Hospital and Harvard Medical School, Boston, MA 02115;jDepartment of
Molecular Biotechnology and Health Science, University of Torino, 10126 Torino, Italy;kEstonian Genome Center, University of Tartu, Tartu 51010, Estonia; lInstitute for Molecular Medicine Finland, University of Helsinki, FI-00014, Helsinki, Finland;mDepartment of Biology, Massachusetts Institute of
Technology, Cambridge, MA 02139; andnDepartment of Systems Biology, Harvard Medical School, Boston, MA 02115
Contributed by Eric S. Lander, November 23, 2016 (sent for review July 28, 2016; reviewed by Stephen J. Galli and Leonid Kruglyak)
Genetic variants affecting hematopoiesis can influence com-monly measured blood cell traits. To identify factors that affect hematopoiesis, we performed association studies for blood cell traits in the population-based Estonian Biobank using high-coverage whole-genome sequencing (WGS) in 2,284 samples and SNP genotyping in an additional 14,904 samples. Using up to 7,134 samples with available phenotype data, our analyses identified 17 associations across 14 blood cell traits. Integration of WGS-based fine-mapping and complementary epigenomic datasets provided evidence for causal mechanisms at several loci, including at a previously undiscovered basophil count-associated locus near the master hematopoietic transcription
factorCEBPA. The fine-mapped variant at this basophil count
association nearCEBPA overlapped an enhancer active in
com-mon myeloid progenitors and influenced its activity. In situ perturbation of this enhancer by CRISPR/Cas9 mutagenesis in he-matopoietic stem and progenitor cells demonstrated that it is nec-essary for and specifically regulatesCEBPA expression during basophil differentiation. We additionally identified basophil count-associ-ated variation at another more pleiotropic myeloid enhancer
nearGATA2, highlighting regulatory mechanisms for ordered
ex-pression of master hematopoietic regulators during lineage spec-ification. Our study illustrates how population-based genetic studies can provide key insights into poorly understood cell dif-ferentiation processes of considerable physiologic relevance.
genome sequencing
|
GWAS|
basophils|
hematopoiesis|
CEBPAT
he human hematopoietic system is among the best understood paradigms of cell differentiation in physiology (1). However, despite our sophisticated understanding, many aspects of this process remain poorly understood. In particular, although he-matopoiesis is perturbed in a variety of human blood disorders and shows considerable interindividual variation, the underlying basis of the disease etiology and variation remains incompletely understood. Genetic variation in hematopoiesis can be reflected in commonly measured laboratory values, such as hemoglobin levels or blood cell counts. Rare mutations disrupting genes in-volved in hematopoiesis can result in severe abnormalities in various blood cell counts (2). Common genetic variants affecting hematopoiesis can also subtly influence blood cell measurements in the general population and can alter the clinical manifesta-tions in rare blood disorders (1, 3–5). Genetic studies offer a unique opportunity to gain insight into the hematopoietic system without being biased by our prior knowledge.The Estonian Biobank is a population-based biobank that has collected DNA samples from 51,535 individuals representing ∼5% of the Estonian population (6). This cohort is composed of adults representative of the larger Estonian population in terms of age, sex, and geographic distribution. The biobank has par-ticular value because electronic medical records (EMRs) in Estonia are centralized and all participants have consented to allow full access to their medical records, providing an excellent resource to investigate the underlying genetic basis for a variety of traits and diseases. Moreover, many of the samples from the biobank have undergone extensive genomic characterization, in-cluding single-nucleotide polymorphism (SNP) genotyping from 14,904 nonoverlapping individuals and PCR-free, high-coverage whole-genome sequencing (WGS) from 2,284 individuals. Here,
Significance
Human blood cell production is coordinated to ensure balanced levels of all lineages. The basis of this regulation remains poorly understood. Identification of genetic differences in human pop-ulations associated with blood cell measurements can shed light on such regulatory mechanisms. Here, we used whole-genome sequencing data to perform a genetic association study in a population-based biobank from Estonia. We identified a num-ber of potential causal variants and underlying mechanisms. For example, we identified a regulatory element that is neces-sary for basophil production, which acts specifically during this process to regulate expression of the transcription factor CEBPA. We demonstrate how genome sequencing, genetic fine-mapping, and functional data can be integrated to gain important insight into blood cell production.
Author contributions: M.H.G., S.K.N., J.C.U., E.S.L., S.K., J.N.H., T.E., and V.G.S. designed research; M.H.G., S.K.N., J.C.U., J.D.B., R.C., and V.G.S. performed research; M.H.G., S.K.N., J.C.U., S.M.Z., J.D.B., P.N., R.M.S., R.C., M.M., M.K., K.P., K.F., L.M., R.M., P.P., S.B.G., A.M., E.S.L., S.K., J.N.H., T.E., and V.G.S. analyzed data; and M.H.G., S.K.N., J.C.U., E.S.L., T.E., and V.G.S. wrote the paper.
Reviewers: S.J.G., Stanford University School of Medicine; and L.K., University of California, Los Angeles.
The authors declare no conflict of interest.
Freely available online through the PNAS open access option. 1M.H.G. and S.K.N. contributed equally to this work.
2To whom correspondence may be addressed. Email: sankaran@broadinstitute.org, lander@broadinstitute.org, or tesko@broadinstitute.org.
This article contains supporting information online atwww.pnas.org/lookup/suppl/doi:10.
1073/pnas.1619052114/-/DCSupplemental.
www.pnas.org/cgi/doi/10.1073/pnas.1619052114 PNAS | Published online December 28, 2016 | E327–E336
GENETICS
to gain insight into hematopoiesis and regulatory mechanisms underlying this process, we have taken advantage of the valuable resource afforded by the Estonian Biobank to perform genetic association studies of all blood cell measurements available in this large population-based cohort.
Results
Study Overview.To perform the genetic association studies for
blood cell traits, we used the WGS of 2,284 individuals and the SNP genotypes of 14,904 individuals from the Estonian Biobank. The WGS data underwent joint variant calling, followed by ex-tensive sample and variant-level quality control (QC) (Dataset
S1andFig. S1). The SNP genotypes were imputed to a custom
reference panel constructed from the high-coverage Estonian Biobank WGS data. The custom imputation panel included all single-nucleotide variants present in the WGS with allele count of≥3 in the WGS, representing a total of 16,536,512 imputed variants.
Using the genotype data described above, we tested for asso-ciations with 14 blood cell measurements. This included mea-surements reflective of red blood cell (RBC) numbers, size, and other related parameters [hemoglobin, hematocrit, RBC count, mean corpuscular volume (MCV), mean corpuscular hemoglo-bin (MCH), and mean corpuscular hemoglohemoglo-bin concentration (MCHC)]; platelet numbers and size [mean platelet volume (MPV)]; as well as white blood cell subtype numbers (absolute numbers of neutrophils, monocytes, lymphocytes, eosinophils, and basophils). As expected, these measurements are often strongly correlated with each other (Fig. S2). Because all indi-viduals in the Estonian Biobank consented to provide access to their corresponding EMR data, we were able to greatly expand sample sizes in a resource-efficient manner. For a subset of randomly selected individuals, blood cell measurements were directly assayed in a clinical laboratory (hereafter referred to as “lab-based”) (Datasets S2andS3andFigs. S3andS4). For most individuals, we mined the EMR to extract blood cell measure-ments when available. As each individual might have multiple measurements in the EMR, we used the median value for each individual after correcting for age, sex, location, and type of measurement (laboratory or EMR-based). In general, the
labo-ratory-based and EMR-based values were strongly correlated; however, the measurements of certain traits, especially of white blood cell subtypes, were variable and had lower correlations
(Fig. S4). In total, for each trait, we had between 4,221 and 7,134
samples with genotype and phenotype data (Dataset S2). We performed single-variant association analyses on all variants with a minor allele count of ≥3. We also performed gene-based burden testing of rare variants [minor allele frequency (MAF)< 5%] using SKAT-O (7).
Blood Cell Trait Associations in the Estonian Biobank.The
single-variant analysis revealed a total of 17 genome-wide significant associations (P < 5 × 10⁻⁸) across the various blood cell
mea-surements (Table 1). Sixteen of these associations had been identified previously and highlight important biological mecha-nisms, such as associations at the HBS1L-MYB locus that con-tains at least three independent variants showing pleiotropy with multiple blood cell measurements (Dataset S4) (3, 8, 9). This locus is of considerable interest because the blood trait-associated variants within this region are associated with the severity of the major he-moglobin disorders, sickle cell disease and β-thalassemia (9–11). Other loci that we identified here contain well-known hematopoietic regulators such asJAK2 (associated with platelet counts) (12, 13) andF2RL2 (associated with MPV) (14). In contrast to the genome-wide association studies (GWASs) involving common variants, the gene-based burden testing (which seeks to aggregate rare variants in each gene) did not identify any significant associations (atP < 8.33× 10⁻⁷). Although studies (such as ours) that use whole-ge-nome sequencing rather than genotyping a fixed set of genetic markers have obvious advantages in terms of detecting rare vari-ants (15), we note that our sample is likely underpowered for comprehensive rare-variant analysis, which is expected to require sample sizes in the range of tens of thousands of individuals (16). The strongest effect identified was a previously undiscovered association with basophil counts near the gene encoding CCAAT/ enhancer-binding protein alpha (CEBPA) (rs78744187; P = 6.19 × 10−38) (Fig. 1 andFig. S5). Each minor allele of this SNP is as-sociated with a 5.9 (per microliter) decrease in basophil counts and the SNP remarkably explains 4.4% of phenotypic variance (Table 1). To ensure that this association is not driven by extreme
Table 1. Detailed summary of significant associations
Locus Position
Ref/
Alt rsID MAF
WGS P value
Combined
P value Effect size
Variance
explained Trait Gene CS
CS+ NDR
19q13 33754548 C/T rs78744187 0.104 1.25× 10⁻¹⁴ 6.19× 10−38 −0.0059 (1,000/μL) 0.044 Basophil count CEBPA* 1 1
12q24 122216910 A/G rs11553699 0.100 0.0016 7.04× 10⁻²⁰ 0.048 (fL) 0.011 MPV WDR66 1 1
3p14 56849749 T/C rs1354034 0.317 0.0012 1.29× 10⁻¹⁴ −0.033 (fL) 0.012 MPV ARHGEF3 1 1
10q21 65063844 T/A rs61855497 0.369 0.0065 3.72× 10⁻¹⁴ −0.023 (fL) 0.0085 MPV JMJD1C 18 4
6q23 135423209 T/C rs9373124 0.308 0.00014 6.86× 10⁻¹⁴ 0.073 (pg) 0.010 MCH HBS1L/MYB 19 7
6q23 135419631 A/G rs9389268 0.304 0.0014 1.23× 10⁻¹³ 0.19 (fL) 0.0070 MCV HBS1L/MYB 21 8
6q23 135419636 C/T rs9376091 0.304 0.011 6.96× 10⁻¹² −0.021 (106/μL) 0.0044 Red blood cell count HBS1L/MYB 20 10
3q21 128296273 G/A rs2465283 0.101 0.0014 9.99× 10⁻¹² −0.0028 (1,000/μL) 0.0077 Basophil count GATA2 11 1
7q22 106370644 C/G rs342292 0.487 0.00062 3.26× 10⁻¹¹ 0.032 (fL) 0.013 MPV PIK3CG 46 6
9q31 113918856 A/G rs10980802 0.491 3.04× 10⁻⁶ 5.06× 10⁻¹¹ −0.020 (1,000/μL) 0.016 Monocyte count LPAR1† 18 0
9p24 4763491 G/A rs12005199 0.332 0.028 1.17× 10⁻⁹ 2.8 (1,000/μL) 0.0033 Platelet count JAK2 1 1
3p14 56849749 T/C rs1354034 0.319 0.015 4.40× 10⁻⁹ 2.6 (1,000/μL) 0.0040 Platelet count ARHGEF3 1 1
6q23 135431640 T/C rs9494142 0.254 2.16× 10⁻⁵ 7.51× 10⁻⁹ 5.3 (1,000/μL) 0.012 Platelet count HBS1L/MYB 22 7
11p15 242859 A/G rs55781332 0.264 0.043 1.42× 10⁻⁸ −0.022 (fL) 0.0047 MPV PSMD13 35 6
6p21 33545125 A/G rs5745587 0.274 0.0011 2.81× 10⁻⁸ 4.1 (1,000/μL) 0.0072 Platelet count BAK1 23 2
5q13 75935631 A/T rs114685606 0.0230 0.53 3.41× 10⁻⁸ 0.011 (fL) 0.00046 MPV F2RL2 3 1
22q12 37470224 T/C rs2413450 0.459 0.0052 3.58× 10⁻⁸ 0.060 (pg) 0.0054 MCH TMPRSS6† 5 0
Both the WGS and combined (WGS plus SNP genotyping) P values are listed. Effect sizes (per minor allele) are based on untransformed trait values in the WGS only. Variance explained is based on inverse normal transformed trait values in the WGS only. CS column shows the number of variants in the CS. CS+ NDR column shows the number of CS variants overlapping an ATAC-seq NDR.
*Indicates previously undiscovered locus.
or spurious values from EMR-based measurements, we validated the association using only laboratory-based measurements with outliers removed (P = 3.31 × 10⁻¹⁵). Furthermore, to ensure that
this association is not population-specific, we examined this SNP in 7,488 individuals from three US-based European ancestry co-horts and observed a significant association with basophil counts (P = 5.99 × 10⁻⁷;Fig. S6A). Despite the remarkably large effect
size of this SNP, previous GWAS for basophil counts have not detected this association (17–19). This is likely because previous studies were imputed to a sparser reference panel (HapMap). Because none of the variants present in HapMap tag rs78744187 strongly, these studies would have failed to detect this association
(Fig. S6B). This observation demonstrates how denser reference
panels or comprehensive genome sequencing data can enable the discovery of additional common variants associated with human traits and diseases.
To assess the comprehensiveness of our analysis (Fig. S7), we compared all of the variants identified by genome sequencing at each locus with the 1000 Genomes (1000G) reference panel (20). Although our study identified variants in significant linkage disequilibrium (LD) with the lead SNP (r2> 0.5) that were
ab-sent from the 1000G phase 1 reference panel, all of these variants were present in phase 3 (21). Importantly, no variants identified
in significant LD with the lead SNP (r2 > 0.5) in 1000G were
missing from our analysis. In addition, there were no copy num-ber variants (CNVs) within 1 Mb that were in LD (r2> 0.5) with
any of the observed associations (Dataset S5). Given these results, we were confident that all potential causal variants had been captured by our analyses and our custom WGS-based reference panel was genuinely reflective of the study population, which are both important prerequisites for fine-mapping.
Fine-Mapping Genetic Associations. Although most of the
asso-ciations have been previously detected, none have yet been pinpointed to specific variants. To attempt to identify the likely causal variant at each locus, we performed statistical fine-mapping analyses, which use LD patterns and association sta-tistics to generate the probability that any particular variant at a locus of interest is causal. We applied three methods for fine-mapping [approximate Bayes factor (ABF), CaviarBF, and PICS] (22–24) and, for each, generated a credible set (CS) of variants, which has a 97.5% probability of containing the casual variant. The CSs generated with ABF and CaviarBF exhibited near-perfect concordance, whereas the CSs generated with PICS, although in strong agreement at most loci, included substantially
C/C C/T T/T 0.00 0.05 0.10 0.15 0.20 Basophil Count at rs78744187 Basophi lC o un t (100 0 /µ L) 0 10 20 30 40 0 20 40 60 80 100 R ecom b inati o n ra te (c M /M b ) rs78744187 0.2 0.4 0.6 0.8 r2 WDR88 LRP3 SLC7A10 CEBPA CEBPA−AS1 33.7 33.75 33.8 33.85 0 5 10 15 20 25 30 35 1 2 3 4 5 6 7 8 9 10 11 12 13 141516171819202122 GATA2 CEBPA Chromosome -log 10 (p-value) -log 10 (p-value) Position on chr19 (Mb)
C
B
A
Fig. 1. Basophil count association near CEBPA. (A) Manhattan plot for single-variant association study for basophil counts. Genome-wide significant associations near GATA2 and CEBPA are marked. (B) Locuszoom plot shows association strength, LD, and recombination event frequency. (C) Basophil counts by genotype of rs78744187.
Guo et al. PNAS | Published online December 28, 2016 | E329
GENETICS
more variants for three of the loci (Fig. S8). As these addi-tional variants nominated solely by PICS were generally of lowr2to the sentinel association, the intersection of ABF and CaviarBF was chosen as the final CS. Remarkably, at 4 of the 13 independent loci (MPV/platelet counts at 3p14, platelet counts at 9p24, MPV at 12q24, and basophil counts at 19q13), our fine-mapping results resolved the association signal to a
single putative causal variant. At two other loci, the CSs had three and five variants (Table 1 andDataset S6). Thus, by re-solving association signals to a finer resolution, we are able to generate experimentally tractable hypotheses about potential causal mechanisms, as we discuss in detail below. For the remaining 10 associations, the CSs have between 11 and 46 variants (median of 20).
HSC MPP LMPP CMP GMP MEP CLP Mono Ery CD4 CD8 NK Bcell
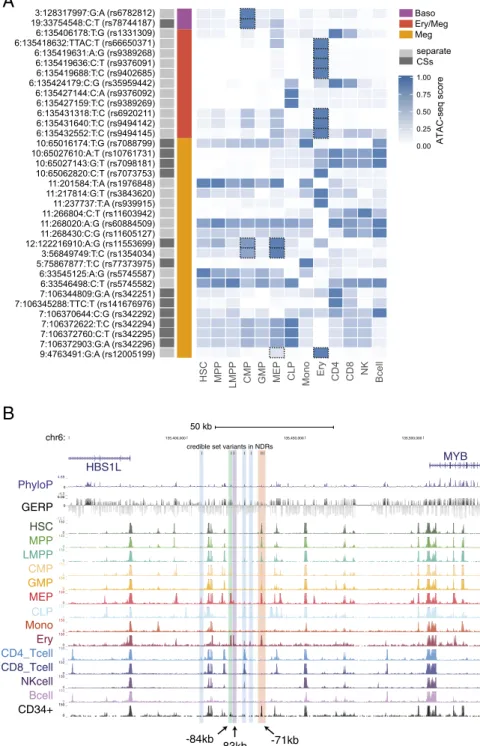
0.00 0.25 0.50 0.75 1.00 ATAC-seq score Baso Ery/Meg Meg 3:128317997:G:A (rs6782812) 19:33754548:C:T (rs78744187) 6:135406178:T:G (rs1331309) 6:135418632:TTAC:T (rs66650371) 6:135419631:A:G (rs9389268) 6:135419636:C:T (rs9376091) 6:135419688:T:C (rs9402685) 6:135424179:C:G (rs35959442) 6:135427144:C:A (rs9376092) 6:135427159:T:C (rs9389269) 6:135431318:T:C (rs6920211) 6:135431640:T:C (rs9494142) 6:135432552:T:C (rs9494145) 10:65016174:T:G (rs7088799) 10:65027610:A:T (rs10761731) 10:65027143:G:T (rs7098181) 10:65062820:C:T (rs7073753) 11:201584:T:A (rs1976848) 11:217814:G:T (rs3843620) 11:237737:T:A (rs939915) 11:266804:C:T (rs11603942) 11:268020:A:G (rs60884509) 11:268430:C:G (rs11605127) 12:122216910:A:G (rs11553699) 3:56849749:T:C (rs1354034) 5:75867877:T:C (rs77373975) 6:33545125:A:G (rs5745587) 6:33546498:C:T (rs5745582) 7:106344809:G:A (rs342251) 7:106345288:TTC:T (rs141676976) 7:106370644:C:G (rs342292) 7:106372622:T:C (rs342294) 7:106372760:C:T (rs342295) 7:106372903:G:A (rs342296) 9:4763491:G:A (rs12005199) separate CSs chr6:
credible set variants in NDRs
50 kb 135,400,000 135,450,000 135,500,000 HBS1L MYB PhyloP 4.88 _ -4.5 _ 0 -GERP 6.06 _ -12.1 _ 0 -HSC150 _ 0 _ MPP 150 _ 0 _ LMPP 150 _ 0 _ CMP 150 _ 0 _ GMP 150 _ 0 _ MEP 150 _ 0 _ 150 _ 0 _ Mono 150 _ 0 _ Ery 150 _ 0 _ CD4_Tcell 150 _ 0 _ 150 _ 0 _ NKcell 150 _ 0 _ Bcell 150 _ 0 _ CD34+ 150 _ 0 _ CD8_Tcell CLP -84kb -83kb -71kb
A
B
Fig. 2. Integration of ATAC-seq data with fine-mapping results sheds mechanistic insights. (A) CS variants that overlap with NDRs in the 13 hematopoietic cell types are shown. Quantile-normalized read counts per million were min-max scaled for each row. Based upon manual investigation, variants that overlapped with a NDR that was not within the top 20% of NDRs for at least 1 of the 13 cell types were excluded. Variants that fall within lineage-specific NDRs of clear relevance to their associated phenotypes are highlighted with dashed boxes. (B) Eleven of the variants in the combined CS for the HSB1L/MYB locus asso-ciation with multiple red cell and platelet assoasso-ciations lie within six separate hematopoietic enhancer elements. The three MEP/erythroid-specific elements are shown in green (−84 kb), purple (−83 kb), and red (−71 kb). rs9494145 resides within a weaker −70-kb element and is included in the same highlight as the substantially more nucleosome-depleted−71-kb element.
Overlap with Epigenomic Data Suggests Causal Mechanisms.An es-timated 80–90% of causal GWAS signals are noncoding variants that presumably act by altering expression of nearby genes (25, 26). To define potential causal mechanisms of the variants, we overlapped CS variants with nucleosome-depleted regions (NDRs) identified by assay for transposase-accessible chromatin with high-throughput sequencing (ATAC-seq) from 13 primary human cell types (27), comprising the majority of the hemato-poietic hierarchy. For 35 CS variants (out of 186 variants from 17 loci; 18.8%), we identified an overlap with hematopoietic NDRs, a significant enrichment compared with non-CS variants in moderate to high LD (r2 > 0.5) (OR = 2.41, P = 0.0009).
Additionally, a permutation test involving local shifting of the NDRs around the CS variants revealed a significant enrichment (1.87-fold change in overlap,P = 0.00042) (28). Furthermore, at 11 of 13 independent loci (85%), at least one CS variant over-lapped a NDR (Fig. 2A). Of note, only the remaining two loci contained a genic variant in their CSs (Table 1). AtTMPRSS6 associated with MCH, there is a missense variant (rs855791, p. V736A) in strong LD with the lead SNP (r2 = 0.82). Rare
damaging mutations in TMPRSS6 cause refractory iron-deficient anemia, and this particular variant has been previously reported to influence iron homeostasis (29, 30). At the 9q31 locus associated with monocyte counts, there are two variants (rs59364245 and rs60698178) located in an uncharacterized long noncoding RNA.
For example, at the well-known HBS1L-MYB locus (8), 11 variants associated with multiple red blood cell and platelet traits overlap with a NDR in at least one stage of hematopoiesis. Seven of these variants overlap with predominately erythroid-specific NDRs (Fig. 2A and B). Although our results agreed with pre-vious studies that variants in the −84- and −71-kb elements are putative functional variants (31), we also identified a previ-ously uncharacterized−83-kb erythroid element harboring three CS variants that may also have regulatory function (Fig. S9). Notably, for all four of the association signals that we fine-mapped to a single variant, the identified variant overlaps with a hematopoietic NDR (Table 1). As an example, we were able to fine-map the association with MPV and platelet counts on 3p14 to rs1354034. This variant overlaps with a common-myeloid pro-genitor (CMP)- and megakaryocyte-erythroid propro-genitor (MEP)-specific regulatory element that has previously been shown to af-fect the transcription of nearbyARHGEF3, a factor implicated in hematopoiesis (Fig. 2A and Fig. S10) (32). Interestingly, the rs1354034 variant is associated (intrans) with the expression of von Willebrand factor (VWF) and other key platelet/megakaryo-cyte genes found at other loci, suggesting a role for this variant in the development of this lineage (33, 34). In all of these examples, our comprehensive ascertainment of genetic variation gave us confidence that the causal variant is included among the variants we analyzed.
To further explore the putative regulatory modalities of these CS variants, we investigated the overlap of CSs with transcription factor (TF) occupancy, functional regulatory models, and pre-dicted motif disruptions. Based upon functional models trained on TF occupancy, open chromatin, and histone modifications, CS variants were enriched for functional regulatory variants (Fig. S11) (35). Because TF occupancy profiles were not available for the entire hematopoietic hierarchy, we inferred putative TF overlap by investigating the overlap of CS variants with 4,559 publicly available ChIP-seq datasets from human blood-based tissues and cell lines. These analyses revealed putative mecha-nisms for a number of variants and provide testable hypotheses, which are particularly tractable for the four CSs containing only a single variant (Datasets S7 andS8). For example, rs1354034, which we described above as being within a NDR near ARH-GEF3, disrupts a conserved GATA motif. In addition, Gata1 occupies the orthologous mouse region containing this variant in
megakaryocytes, but not erythroid cells, suggesting a putative mechanism by which this variant may act (Fig. S12).
Basophil Associations Illuminate Mechanisms for Hematopoietic
Lineage Specification. We next turned to the association with
basophil counts at 19q13 nearCEBPA. As we noted above, this locus could be resolved to a single putative causal variant, rs78744187, which resides 39 kb downstream fromCEBPA, near a separate +42-kb enhancer that has been shown to influence CEBPA expression along various myeloid lineages (36–38). rs78744187 appeared to be solely associated with basophil counts and showed no evidence of pleiotropic effects on other blood cell traits, including among other myeloid lineages (Dataset S4). Conditioning the association on the rs78744187 genotypes at-tenuated all signals at the locus, suggesting the existence of only one independent signal at the locus (Fig. S13). Interestingly, rs78744187 resides within a distinct NDR present only in CMPs, but not in granulocyte–monocyte progenitors (GMPs), consistent with emerging data for a GMP-independent origin for basophils, mast cells, eosinophils, and their progenitors (Fig. 3A) (39–42). Moreover, this NDR is weakly to moderately present in myeloid cell lines from mice and humans (HL60, K562, HPC7, and CMK) and is occupied by numerous myeloid transcription factors, in-cluding master regulators of myeloid differentiation: GATA2 and RUNX1 (Dataset S7andFig. S14). In a luciferase reporter assay, the+39-kb region demonstrated enhancer activity (∼40-fold in-crease in activity relative to the minimal promoter) in the K562 myeloid cell line. Additionally, the basophil count-decreasing rs78744187-T allele was associated with a 28.6% reduction in enhancer activity (Fig. 4A). Despite extensive analyses of TF occupancy and alterations to predicted TF motif, we were unable to elucidate an exact mechanism for how this variant modulates enhancer activity, as is frequently noted to be the case for pu-tative causal variants that alter gene expression (4, 24). Taken together, these data show that the +39-kb region contains a myeloid enhancer element that is active in CMPs and that shows variation in activity modulated by the rs78744187 variant.
To identify the gene(s) whose expression is modulated by rs78744187 to influence basophil production, we performed in situ perturbation of the+39-kb enhancer using CRISPR/Cas9-mediated mutagenesis in CD34+human hematopoietic stem and progenitor cells (HSPCs) (43). We targeted the+39-kb enhancer using two guides that flank the rs78744187 variant (Fig. 4B). Deep sequencing of the target regions showed that both guide RNAs caused insertions or deletions at a high efficiency (∼88%) (Fig. 4C). We observed a 60% reduction in CEBPA expression in the nonclonal population of enhancer-disrupted hematopoietic cells compared with controls (Fig. 4D). As enhancer-promoter looping interactions primarily occur within topologically associ-ated domains (TADs), we investigassoci-ated all other expressed genes in the TAD harboring this variant but did not observe any significant changes in their expression (Fig. 4D andFig. S15) (36). Interestingly, perturbation of this element in the granulocyte/monocyte cell lines HL60 and U937 did not result in any major alteration ofCEBPA expression (Fig. S16), demonstrating the specificity of this regulatory element during basophil differentiation.
The TF CEBPA has been previously implicated in basophil specification, in particular during the bifurcation from the de-velopmentally related mast cell lineage (44–46). However, CEBPA is also implicated more broadly in hematopoiesis as a master TF (36, 47, 48), suggesting that its expression is temporally regulated to specify basophils and other terminal lineages (49). To test whether the+39-kb enhancer provides the temporal regula-tion of CEBPA expression for proper basophil differentiation, we performed directed differentiation of the CRISPR/Cas9 enhancer-mutagenized HSPCs in the presence of IL-3 (50–52). IL-3–mediated differentiation of human CD34+cells predominately
generates basophils but can generate mast cells to a lesser degree
Guo et al. PNAS | Published online December 28, 2016 | E331
GENETICS
(50, 53, 54). Following 2 wk in culture,∼51% of cells expressed basophil surface marker phenotypes (CD203c+/CD117−) and ∼26% of cells expressed mast cell marker phenotypes (CD203c+/
CD117+) (Fig. 5B). Morphologically, 25% of the cells in these cultures resembled mature basophils, suggesting that our cultures may also accommodate less mature precursors of these lineages as well, which is in agreement with the observation that the CD203c antibody can detect mature human basophils, mast cells, and their precursors (53). The enhancer-mutagenized cells showed a significant reduction in basophil production based upon cell
surface markers and morphology, as well as a proportionate in-crease in immature mast cells compared with controls (Fig. 5A–D
andFig. S17). In addition, the basophils produced in the
enhancer-mutagenized cells frequently showed impaired maturation with a paucity of basophilic granules and a high frequency of empty or eosinophilic granules instead (Fig. 5C and D). These results dem-onstrate that an intact+39-kb enhancer is required for proper ex-pression ofCEBPA during basophil differentiation and maturation. Alternatively, the+39-kb CEBPA enhancer may regulate cytoplas-mic granule development in basophils, independent of its effects on
chr19: 20 kb 33,755,000 33,760,000 33,765,000 33,770,000 33,775,000 33,780,000 33,785,000 33,790,000 33,795,000 CEBPA PhyloP 4.88 _ -4.5 _ 0 -GERP 5.97 _ -11.9 _ 0 -HSC 150 _ 0 _ MPP 150 _ 0 _ LMPP 150 _ 0 _ CMP 150 _ 0 _ GMP 150 _ 0 _ MEP 150 _ 0 _ CLP 150 _ 0 _ Mono 150 _ 0 _ Ery 150 _ 0 _ CD4_Tcell 150 _ 0 _ CD8_Tcell 150 _ 0 _ NKcell 150 _ 0 _ Bcell 150 _ 0 _ CD34+ 150 _0 _
A
C G T C A C T G T C A T G T C C G C G G C G A G G C T G T G rs78744187 4.88 _ -4.5 _ 0 -4.3 _ -7.32 _ 0 -PhyloP GERPB
50 kb chr3: 128,210,000 128,220,000 128,230,000 128,240,000 128,250,000 128,260,000 128,270,000 128,280,000 128,290,000 128,300,000 128,310,000 128,320,000 128,330,000 GATA2 C3orf27 PhyloP 4.88 _ -4.5 _ 0 -GERP 5.51 _ -11 _ 0 -HSC 150 _0 _ MPP 150 _0 _ LMPP 150 _0 _ CMP 150 _0 _ GMP 150 _0 _ MEP 150 _0 _ CLP 150 _0 _ Mono 150 _0 _ Ery 150 _0 _ CD4_Tcell 150 _0 _ CD8_Tcell 150 _0 _ NKcell 150 _0 _ Bcell 150 _0 _ CD34+ 150 _0 _ C A A A C G G C A C T G C C C G G A A G C T T C C C G A A A rs6782812 4.88 _ -4.5 _ 0 -2.72 _ -5.44 _ 0 -PhyloP GERPFig. 3. Overlap of basophil-associated variants with hematopoietic regulatory elements. (A) Overlap of rs78744187 with NDRs in hematopoietic progenitors and their terminal progeny. Conservation across 100 vertebrates (PhyloP) or mammals (GERP) is also shown. A conserved motif element is observed proximal to rs78744187. (B) Similar to A except for rs6782812. Two conserved motif elements can be observed nearby.
differentiation. Our results also extend earlier studies in mice that suggested a key role for Cebpa in modulating the basophil/mast cell lineage fate choice (55, 56).
Our GWAS also identified an association with basophil counts at 3q21, which includes another master TF: GATA-binding pro-tein 2 (GATA2) (rs2465283, P = 9.99 × 10⁻¹²) (Fig. 1A and Table
1). A previous GWAS performed in a Japanese population also identified an association at this locus with basophil counts (rs4328821;P = 5.3 × 10−40) (18). We noted that the basophil-decreasing allele of rs4328821 is associated with decreased GATA2 expression in whole blood (P = 5.3 × 10⁻¹³) (57). By
leveraging differences in the LD patterns between Estonians and East Asians and examining only variants in strong LD (r2> 0.8)
with the lead SNP in both populations, we were able to reduce our CS from 11 to 6 variants. Of these six CS variants, only one variant (rs6782812) overlapped a strong hematopoietic NDR. Surprisingly, similar to the CEBPA variant (rs78744187), this NDR is also CMP specific (Fig. 3B) and is occupied by the RUNX1 and GATA2 TFs (Fig. S18). In luciferase-based assays in K562 cells, the NDR demonstrates∼4.5-fold enhancer activity and the fine-mappedGATA2 variant (rs6782812) reduced en-hancer activity by 69% (Fig. S18A). Because there are common master TFs at the two basophil-associated loci (GATA2 and CEBPA), we examined whether these two loci might show an epistatic interaction. We found no evidence of epistasis between rs2465283 (GATA2) and rs7874418 (CEBPA) (P = 0.070). The GATA2-associated variant was also associated with eosinophil counts (P = 3.07 × 10⁻³;Dataset S4), as has been seen previously
in other studies (17–19, 58). An independent association near GATA2 for monocyte counts has been reported by other studies (monocyte sentinel SNP rs9880192;r2 = 0.054 to rs2465283 in Europeans) (17, 19). These associations nearGATA2 are con-sistent with the well-known role of GATA2 in driving myeloid differentiation (59, 60). Together, these results suggest that the fine-mappedGATA2 variant (rs6782812) influences lineage specification at an earlier myeloid progenitor that is capable of producing basophils, eosinophils, and potentially other lineages, whereas theCEBPA variant (rs78744187) appears to be present in an enhancer that is specifically necessary for production of
baso-phils from a downstream bipotential basophil/mast cell progenitor (BMCP) or other myeloid progenitor (Fig. 5E).
Examination of Disease Associations. Basophils have been
impli-cated in inflammation and host defense, but the causal role that basophils play in human disease is poorly understood (44, 61–63). To identify potential disease roles for basophils, we performed a phenome-wide association study (pheWAS) for rs78744187 and rs2465283 (64). To accomplish this, for each available International Statistical Classification of Diseases and Related Health Problems, 10th Revision (ICD-10) medical bill-ing code, we treated all individuals with the code as cases and treated anyone without the code as a control. We tested for the existence of associations between either variant and all 534 dis-eases that had greater than 100 cases. No disease associations reaching theP value threshold of 9.2 × 10⁻⁵(following Bonferroni correction) were identified for either SNP. However, rs78744187 was nominally associated with joint derangements and enteropathic arthropathy (P values of 0.00023 and 0.00059, respectively), which may have autoinflammatory etiologies (Dataset S9). Previous studies have identified multiple associations with inflammatory bowel disease (IBD) nearCEBPA (65–67). However, the basophil association at rs78744187 appears to be independent from the IBD associations (Dataset S10). We do note that, although dis-ease associations with basophil counts are likely to exist, similar to those seen with the related eosinophil lineage, we are likely to be underpowered in our current study to robustly detect such an effect, particularly given the variable fidelity of medical coding
(Fig. S19) (68).
Discussion
In this study, we integrated WGS-based GWASs, fine-mapping, epigenomic datasets, and functional assays to provide additional insight into our evolving understanding of lineage specification during human hematopoiesis (69, 70). Integration of compre-hensive genetic and extensive epigenomic data at these loci pro-vided key insight into human hematopoietic regulatory mechanisms. For example, we were able to identify a variant that likely affects GATA1 TF binding to influence expression of ARHGEF3 during
guide 2 guide 1 rs78744187
A
B
0.0 0.5 1.0 1.5 ExpressionCEBPA CEBPG PEPD
GFP guide 1 guide 2 n.s. n.s. n.s. n.s. * ** * **
Relative Luciferase activit
y +39kb enhancer 0 10 20 30 40 50 C allele T allele MinP
D
**C
guide 1 guide 2Fig. 4. rs78744187 modulates the activity of a CEBPA enhancer. (A) A 400-bp genomic region containing rs78744187 shows allele-specific enhancer activity in K562 cells by luciferase assay (**P< 0.01). (B) Schematic of CRISPR/Cas9 disruption at the +39-kb myeloid enhancer. (C) Mobilized peripheral blood CD34+cells
were infected with lentiviral CRISPR/Cas9 constructs. Indel frequency was measured at day 14 by deep sequencing, and the top six indels are shown. (D) Ex-pression of transcribed genes in the TAD containing rs78744187 after enhancer disruption at day 7 (quantitative RT-PCR). Results are reported as mean and SD across three independent experiments (n.s., not significant; ***P< 0.0001).
Guo et al. PNAS | Published online December 28, 2016 | E333
GENETICS
megakaryopoiesis. At the extensively studiedHBS1L-MYB locus, by overlapping fine-mapping data with extensive ATAC-seq data, we provided evidence for additional putative causal variants. By integrating these complementary datasets, we were able to gen-erate experimentally tractable hypotheses for further functional investigation.
At one of these loci, we fine-mapped a previously undiscovered association with basophil counts near the master TFCEBPA to a CMP-restricted enhancer element. Functional assays revealed that the causal variant altered enhancer activity and resulted in decreased CEBPA expression, which therefore helps drive the lineage choice between basophils and mast cells. Whether this lineage choice happens at the BMCP or a different myeloid progenitor stage is currently not resolved, and because our GWAS study did not measure mast cells in nonhematopoietic tissues, our findings cannot directly address this issue (71, 72). In the region of another master TF, GATA2, our study identi-fied a basophil and eosinophil count-associated variant within a similar CMP-restricted enhancer associated with GATA2 ex-pression. Thus, our study provides evidence that common genetic variation regulates basophil production by tuning the ordered expression of master TFs through the alteration of stage-specific enhancer elements (49). Furthermore, as both basophil-associ-ated variants fall within enhancer elements that are active spe-cifically in CMPs (but not GMPs or MEPs), our study provides strong support for revised models of hematopoiesis, where eo-sinophils, basophils, mast cells, and their progenitors bifurcate at the earlier CMP stage, rather than the more traditional models where these lineages arise from GMPs along with granulocyte and monocyte progenitors (Fig. 5E) (41, 42). Our findings
vide key insights into the molecular regulation of basophil pro-duction, an important and nonredundant cell type in inflammation and host defense that has been challenging to study in humans due to its rarity (44, 61–63). The identification of these variants will also allow for further studies of the mechanisms by which genetic variants influencing basophil counts may impact on human diseases.
Our study also demonstrated the benefits of using high-cov-erage WGS in a population-based biobank. Comprehensive ascertainment of genetic variation allowed us to identify the association nearCEBPA, which would have been missed had we imputed to sparser reference panels, such as HapMap. Fur-thermore, the high-coverage WGS allowed us to comprehen-sively capture variation that might be missed by lower coverage sequencing approaches (such as longer indels and variants in low-complexity regions), giving us confidence that the true causal variant has been identified at each locus, an important pre-requisite for fine-mapping. Moreover, by performing our study in a population-based biobank, we were also able to link genetic data with EMRs to greatly increase sample sizes in a resource-efficient manner, providing support for similar programs such as the Precision Medicine Initiative (73). Together, our study dem-onstrates how key genetic and biological insights can be gained from comprehensive genetic studies in population-based biobanks. Materials and Methods
Blood Cell Measurements. We performed a complete blood count (CBC) in a clinical laboratory (“lab-based”) for 2,000 participants. One thousand indi-viduals were chosen for profiling based on their agreement to be part of a recall study (mean follow-up time, 4.5 y) for collecting new biological sam-ples and data on health and lifestyle. The remaining 1,000 samsam-ples represent 0 10 20 30 % o f ma ture B asophils
control guide 1 guide 2
control guide 1 guide 2
26 ±2 51 ±2 42 ±4 33 ±2 43 ±2
A
CD203c CD1 17B
BMCP / CMP Mast cell (immature) Basophil CD117+CD203c+ CD117-CD203c+ 27 ±2 40µmC
D
control guide 1 guide 2 **
myeloid progenitor EoP MCP BaP BMCP ?? GATA2 CEBPA CEBPA GATA2 GATA2 CEBPA myeloid enhancer basophil enhancer * * rs78744187 rs6782812 CEBPA CEBPA
E
IL-3 IL-3Fig. 5. An intact+39-kb CEBPA enhancer is required for human basophil differentiation. (A) IL-3 –medi-ated differentiation of primary human CD34+ cells generates both basophils and mast cells from a my-eloid progenitor that may either be a basophil/mast cell progenitor (BMCP) and/or derivative of the common myeloid progenitor (CMP) population. (B) FACS analysis shows impaired differentiation of basophils and a concomitant increase in mast cells after+39-kb enhancer disruption (mean ± SD of three independent experiments). (C) Representative images of May–Giemsa stains at day 14. Arrows in-dicate fully differentiated, mature basophils in the left panel, whereas the arrows indicate cells with abnormal basophilic and some eosinophilic granules in the+39-kb enhancer-disrupted cultures. (D) Im-paired maturation of basophils based upon mor-phology in May–Grünwald Giemsa stains. Student’s t test performed between control vs. both guides (**P< 0.01). (E) Previous studies have shown that ordered expression of GATA2 and CEBPA is critical for differ-entiation of eosinophils, basophils, and mast cells. Our GWAS follow-up study has identified enhancers that, at least partially, mediate this ordered expression pat-tern. Up-regulation of GATA2 is required for all three lineages. Accordingly, the rs6782812 variant in the GATA2 locus is associated with both eosinophil and basophil counts. Up-regulation of CEBPA is required only for basophil differentiation from BMCPs and/or CMPs. Accordingly, the rs78744187 variant in the CEBPA locus is associated with basophil counts and affects basophil differentiation. BMCP, basophil/mast cell progenitor; BaP, basophil progenitor; EoP, eo-sinophil progenitor; MCP, mast cell progenitor.
a random subsample of 500 males and 500 females joining the biobank throughout the year 2009. Clinical laboratory-based measurements where performed at Tartu University Clinic’s Diagnostics center. More details on specific methods and equipment used can be found online (www.kliinikum.
ee/yhendlabor/analyysid). For the remaining individuals, we extracted blood
cell measurements from EMR-based records as available. EMR-based phe-notype measurements were obtained by systematically mining the EMRs from the two main hospitals in Estonia (Tartu University Clinic and Northern Estonia Regional Hospital). We were able to obtain EMR-based values for up to 5,038 individuals (Dataset S2), with up to 305 measurements for a single trait in an individual. Presence of other diseases was not taken into account when normalizing the blood cell measurements.
For each individual, we used the EMR-based measurements only if labo-ratory-based values were not available. We removed spurious values and extreme outliers (Dataset S3). We then performed regression using a linear mixed model adjusting for sex as a fixed effect, and setting (EMR-based vs. laboratory-based, as well as the specific hospital/clinic) and age at measure-ment as random effects. We took the median residual for each individual and performed inverse normal transformation of the median residuals. These median residuals were used for downstream association analyses.
Generation of genome sequencing data, variant calling, imputation, and association testing are all described inSI Materials and Methods. Approval for this study was obtained from the institutional review boards of the University of Tartu, Massachusetts Institute of Technology, and Boston Children’s Hos-pital. Informed consent was provided according to the Declaration of Helsinki. Luciferase Reporter Assays. The genomic regions containing major and minor allele of the variants rs78744187 (∼400 bp) and rs6782812 (∼364 bp) were synthesized as gblocks (IDT Technologies;Dataset S11) and cloned into the firefly luciferase reporter constructs (pGL4.24) using BglII and XhoI sites. The firefly constructs (500 ng) were cotransfected with pRL-SV40 Renilla luciferase constructs (50 ng) into 100,000 K562 cells using Lipofectamine LTX (Invitrogen) according to the manufacturer’s protocols. Cells were harvested after 48 h and the luciferase activity measured by Dual-Glo Luciferase Assay system (Promega). Genome Editing in Human CD34+HSPCs Using Lentiviral CRISPR/Cas9 Mutagenesis. Two guide RNAs targeting the variant rs78744187 and a control guide RNA
targeting GFP (Fig. 4B) were cloned into LentiCRISPRv2 constructs (74). The constructs along with packaging helper constructs were transfected into HEK-293T cells for lentiviral production. The viral supernatant was then concentrated 60 times by ultracentrifugation. Human CD34+HSPCs (adult) were purchased from Seattle Fred Hutchinson Center and cultured in Iscove’s modified Dulbec-co’s medium with 10% (vol/vol) FBS in the presence of human IL-3 (10 ng/mL). On day 2 in culture,∼500,000 cells were spinfected with the concentrated lentiviral supernatant and polybrene (8μg/mL) on retronectin-coated plates (Takara). On days 5 and 6 in culture, the cells were selected with puromycin (1μg/mL). CEBPA expression was measured at day 7 in culture. The cells were subsequently cul-tured until day 14 for differentiation into basophils and mast cells.
Genome Editing in HL60s and U937 Cell Lines Using Lentiviral CRISPR/Cas9. HL60 and U937 cells were cultured in RPMI with 10% (vol/vol) FBS. One to 2 million cells were spinfected with lentiviral supernatant with polybrene (8μg/mL). On days 3, 4, and 5 postspinfection, cells were selected with puromycin (1μg/ mL). CEBPA expression was measured at day 12 postspinfection. For the Surveyor assay, genomic DNA was extracted at day 12 and a 600-bp region containing the CRISPR cut sites was PCR amplified (Dataset S11). The Surveyor assay was performed according to kit recommendations (IDT Technologies).
Flow Cytometry. Cells were incubated with Human BD Fc Block (BD Biosciences) for 10 min at room temperature to prevent nonspecific binding to Fc receptors. Subsequently, the cells were stained with CD117-PE (clone 104D2; Biolegend) and CD203c-APC (clone NP4D6; Biolegend) antibodies and analyzed by BD Accuri Flow Cytometer. FACS plots were generated by FlowJo (Tree Star). ACKNOWLEDGMENTS. We thank members of the V.G.S. and J.N.H. Labora-tories, as well as the Estonian Genome Center, and numerous colleagues for valuable comments and discussions. This work was supported by National Institutes of Health Grants R01 DK103794, R33 HL120791 (to V.G.S.), and R01 DK075787 (to J.N.H.). P.P. was funded by the Nordic Information for Action eScience Center by NordForsk (Project 62721). The Estonian Genome Center was supported by the Estonian Research Council (PerMed I; IUT20-60); European Union H2020 Grants 692145, 676550, and 654248; and the European Union through the European Regional Development Fund (GENTRANSMED).
1. Sankaran VG, Orkin SH (2013) Genome-wide association studies of hematologic phenotypes: A window into human hematopoiesis. Curr Opin Genet Dev 23(3): 339–344.
2. Sankaran VG, Weiss MJ (2015) Anemia: Progress in molecular mechanisms and therapies. Nat Med 21(3):221–230.
3. van der Harst P, et al. (2012) Seventy-five genetic loci influencing the human red blood cell. Nature 492(7429):369–375.
4. Ulirsch JC, et al. (2016) Systematic functional dissection of common genetic variation affecting red blood cell traits. Cell 165(6):1530–1545.
5. Orrù V, et al. (2013) Genetic variants regulating immune cell levels in health and disease. Cell 155(1):242–256.
6. Leitsalu L, Alavere H, Tammesoo ML, Leego E, Metspalu A (2015) Linking a pop-ulation biobank with national health registries—the Estonian experience. J Pers Med 5(2):96–106.
7. Lee S, et al.; NHLBI GO Exome Sequencing Project—ESP Lung Project Team (2012) Optimal unified approach for rare-variant association testing with application to small-sample case-control whole-exome sequencing studies. Am J Hum Genet 91(2): 224–237.
8. Sankaran VG, et al. (2013) Rare complete loss of function provides insight into a pleiotropic genome-wide association study locus. Blood 122(23):3845–3847. 9. Galarneau G, et al. (2010) Fine-mapping at three loci known to affect fetal
hemo-globin levels explains additional genetic variation. Nat Genet 42(12):1049–1051. 10. Nuinoon M, et al. (2010) A genome-wide association identified the common genetic
variants influence disease severity in beta0-thalassemia/hemoglobin E. Hum Genet 127(3):303–314.
11. Lettre G, et al. (2008) DNA polymorphisms at the BCL11A, HBS1L-MYB, and beta-globin loci associate with fetal hemobeta-globin levels and pain crises in sickle cell disease. Proc Natl Acad Sci USA 105(33):11869–11874.
12. Khwaja A (2006) The role of Janus kinases in haemopoiesis and haematological malignancy. Br J Haematol 134(4):366–384.
13. Auer PL, et al. (2014) Rare and low-frequency coding variants in CXCR2 and other genes are associated with hematological traits. Nat Genet 46(6):629–634. 14. Kahn ML, et al. (1998) A dual thrombin receptor system for platelet activation.
Nature 394(6694):690–694.
15. Polfus LM, et al. (2016) Whole-exome sequencing identifies loci associated with blood cell traits and reveals a role for alternative GFI1B splice variants in human hematopoiesis. Am J Hum Genet 99(2):481–488.
16. Zuk O, et al. (2014) Searching for missing heritability: Designing rare variant asso-ciation studies. Proc Natl Acad Sci USA 111(4):E455–E464.
17. Keller MF, et al.; CHARGE Hematology; COGENT; BioBank Japan Project (RIKEN) Working Groups (2014) Trans-ethnic meta-analysis of white blood cell phenotypes. Hum Mol Genet 23(25):6944–6960.
18. Okada Y, et al. (2011) Identification of nine novel loci associated with white blood cell subtypes in a Japanese population. PLoS Genet 7(6):e1002067.
19. Nalls MA, et al. (2011) Multiple loci are associated with white blood cell phenotypes. PLoS Genet 7(6):e1002113.
20. Abecasis GR, et al.; 1000 Genomes Project Consortium (2012) An integrated map of genetic variation from 1,092 human genomes. Nature 491(7422):56–65. 21. Auton A, et al.; 1000 Genomes Project Consortium (2015) A global reference for
human genetic variation. Nature 526(7571):68–74.
22. Maller JB, et al.; Wellcome Trust Case Control Consortium (2012) Bayesian re-finement of association signals for 14 loci in 3 common diseases. Nat Genet 44(12): 1294–1301.
23. Chen W, et al. (2015) Fine mapping causal variants with an approximate Bayesian method using marginal test statistics. Genetics 200(3):719–736.
24. Farh KK-H, et al. (2015) Genetic and epigenetic fine mapping of causal autoimmune disease variants. Nature 518(7539):337–343.
25. Gusev A, et al.; Schizophrenia Working Group of the Psychiatric Genomics Consor-tium; SWE-SCZ ConsorConsor-tium; Schizophrenia Working Group of the Psychiatric Geno-mics Consortium; SWE-SCZ Consortium (2014) Partitioning heritability of regulatory and cell-type-specific variants across 11 common diseases. Am J Hum Genet 95(5): 535–552.
26. Finucane HK, et al.; ReproGen Consortium; Schizophrenia Working Group of the Psychiatric Genomics Consortium; RACI Consortium (2015) Partitioning heritability by functional annotation using genome-wide association summary statistics. Nat Genet 47(11):1228–1235.
27. Corces MR, et al. (2016) Lineage-specific and single-cell chromatin accessibility charts human hematopoiesis and leukemia evolution. Nat Genet 48(10):1193–1203. 28. Trynka G, et al. (2015) Disentangling the effects of colocalizing genomic annotations
to functionally prioritize non-coding variants within complex-trait loci. Am J Hum Genet 97(1):139–152.
29. Nai A, et al. (2011) TMPRSS6 rs855791 modulates hepcidin transcription in vitro and serum hepcidin levels in normal individuals. Blood 118(16):4459–4462.
30. Finberg KE, et al. (2008) Mutations in TMPRSS6 cause iron-refractory iron deficiency anemia (IRIDA). Nat Genet 40(5):569–571.
31. Stadhouders R, et al. (2014) HBS1L-MYB intergenic variants modulate fetal hemo-globin via long-range MYB enhancers. J Clin Invest 124(4):1699–1710.
32. Serbanovic-Canic J, et al. (2011) Silencing of RhoA nucleotide exchange factor, ARHGEF3, reveals its unexpected role in iron uptake. Blood 118(18):4967–4976.
Guo et al. PNAS | Published online December 28, 2016 | E335
GENETICS
33. Battle A, et al. (2014) Characterizing the genetic basis of transcriptome diversity through RNA-sequencing of 922 individuals. Genome Res 24(1):14–24.
34. Zhang X, et al. (2014) Genetic associations with expression for genes implicated in GWAS studies for atherosclerotic cardiovascular disease and blood phenotypes. Hum Mol Genet 23(3):782–795.
35. Zhou J, Troyanskaya OG (2015) Predicting effects of noncoding variants with deep learning-based sequence model. Nat Methods 12(10):931–934.
36. Avellino R, et al. (2016) An autonomous CEBPA enhancer specific for myeloid-line-age priming and neutrophilic differentiation. Blood 127(24):2991–3003. 37. Guo H, Cooper S, Friedman AD (2016) In vivo deletion of the Cebpa+37 kb enhancer
markedly reduces Cebpa mRNA in myeloid progenitors but not in non-hematopoi-etic tissues to impair granulopoiesis. PLoS One 11(3):e0150809.
38. Wilson NK, et al. (2016) Integrated genome-scale analysis of the transcriptional regulatory landscape in a blood stem/progenitor cell model. Blood 127(13):e12–e23. 39. Chen C-C, Grimbaldeston MA, Tsai M, Weissman IL, Galli SJ (2005) Identification of mast cell progenitors in adult mice. Proc Natl Acad Sci USA 102(32):11408–11413. 40. Franco CB, Chen CC, Drukker M, Weissman IL, Galli SJ (2010) Distinguishing mast cell
and granulocyte differentiation at the single-cell level. Cell Stem Cell 6(4):361–368. 41. Görgens A, et al. (2013) Revision of the human hematopoietic tree: Granulocyte
subtypes derive from distinct hematopoietic lineages. Cell Rep 3(5):1539–1552. 42. Drissen R, et al. (2016) Distinct myeloid progenitor-differentiation pathways
iden-tified through single-cell RNA sequencing. Nat Immunol 17(6):666–676. 43. Wakabayashi A, et al. (2016) Insight into GATA1 transcriptional activity through
interrogation of cis elements disrupted in human erythroid disorders. Proc Natl Acad Sci USA 113(16):4434–4439.
44. Voehringer D (2013) Protective and pathological roles of mast cells and basophils. Nat Rev Immunol 13(5):362–375.
45. Huang H, Li Y (2014) Mechanisms controlling mast cell and basophil lineage deci-sions. Curr Allergy Asthma Rep 14(9):457.
46. Dwyer DF, Barrett NA, Austen KF; Immunological Genome Project Consortium (2016) Expression profiling of constitutive mast cells reveals a unique identity within the immune system. Nat Immunol 17(7):878–887.
47. Friedman AD (2015) C/EBPα in normal and malignant myelopoiesis. Int J Hematol 101(4):330–341.
48. Paul F, et al. (2015) Transcriptional heterogeneity and lineage commitment in my-eloid progenitors. Cell 163(7):1663–1677.
49. Iwasaki H, et al. (2006) The order of expression of transcription factors directs hi-erarchical specification of hematopoietic lineages. Genes Dev 20(21):3010–3021. 50. Ishmael SS, MacGlashan DW, Jr (2010) Syk expression in peripheral blood leukocytes,
CD34+progenitors, and CD34-derived basophils. J Leukoc Biol 87(2):291–300. 51. Choi KD, Vodyanik MA, Slukvin II (2009) Generation of mature human
myelomo-nocytic cells through expansion and differentiation of pluripotent stem cell-derived lin−CD34+CD43+CD45+progenitors. J Clin Invest 119(9):2818–2829.
52. Kepley CL, Pfeiffer JR, Schwartz LB, Wilson BS, Oliver JM (1998) The identification and characterization of umbilical cord blood-derived human basophils. J Leukoc Biol 64(4):474–483.
53. Bühring HJ, et al. (1999) The monoclonal antibody 97A6 defines a novel surface antigen expressed on human basophils and their multipotent and unipotent pro-genitors. Blood 94(7):2343–2356.
54. Langdon JM, et al. (2008) Histamine-releasing factor/translationally controlled tu-mor protein (HRF/TCTP)-induced histamine release is enhanced with SHIP-1 knock-down in cultured human mast cell and basophil models. J Leukoc Biol 84(4): 1151–1158.
55. Arinobu Y, et al. (2005) Developmental checkpoints of the basophil/mast cell line-ages in adult murine hematopoiesis. Proc Natl Acad Sci USA 102(50):18105–18110. 56. Rao KN, Smuda C, Gregory GD, Min B, Brown MA (2013) Ikaros limits basophil
de-velopment by suppressing C/EBP-α expression. Blood 122(15):2572–2581. 57. Westra H-J, et al. (2013) Systematic identification of trans eQTLs as putative drivers
of known disease associations. Nat Genet 45(10):1238–1243.
58. Gudbjartsson DF, et al. (2009) Sequence variants affecting eosinophil numbers as-sociate with asthma and myocardial infarction. Nat Genet 41(3):342–347. 59. Nandakumar SK, et al. (2015) Low-level GATA2 overexpression promotes myeloid
progenitor self-renewal and blocks lymphoid differentiation in mice. Exp Hematol 43(7):565–577.e1–10.
60. Li Y, Qi X, Liu B, Huang H (2015) The STAT5-GATA2 pathway is critical in basophil and mast cell differentiation and maintenance. J Immunol 194(9):4328–4338. 61. Nadif R, Zerimech F, Bouzigon E, Matran R (2013) The role of eosinophils and
ba-sophils in allergic diseases considering genetic findings. Curr Opin Allergy Clin Immunol 13(5):507–513.
62. Min B (2008) Basophils: What they“can do” versus what they “actually do.” Nat Immunol 9(12):1333–1339.
63. Sullivan BM, Locksley RM (2009) Basophils: A nonredundant contributor to host immunity. Immunity 30(1):12–20.
64. Sudlow C, et al. (2015) UK Biobank: An open access resource for identifying the causes of a wide range of complex diseases of middle and old age. PLoS Med 12(3):e1001779. 65. Jostins L, et al.; International IBD Genetics Consortium (IIBDGC) (2012) Host-microbe interactions have shaped the genetic architecture of inflammatory bowel disease. Nature 491(7422):119–124.
66. Franke A, et al. (2010) Genome-wide meta-analysis increases to 71 the number of confirmed Crohn’s disease susceptibility loci. Nat Genet 42(12):1118–1125. 67. Imielinski M, et al.; Western Regional Alliance for Pediatric IBD; International IBD
Genetics Consortium; NIDDK IBD Genetics Consortium; Belgian-French IBD Consor-tium; Wellcome Trust Case Control Consortium (2009) Common variants at five new
loci associated with early-onset inflammatory bowel disease. Nat Genet 41(12): 1335–1340.
68. Bush WS, Oetjens MT, Crawford DC (2016) Unravelling the human genome-phenome relationship using phenome-wide association studies. Nat Rev Genet 17(3):129–145. 69. Nandakumar SK, Ulirsch JC, Sankaran VG (2016) Advances in understanding
eryth-ropoiesis: Evolving perspectives. Br J Haematol 173(2):206–218.
70. Graf T, Enver T (2009) Forcing cells to change lineages. Nature 462(7273):587–594. 71. Mukai K, et al. (2012) Critical role of P1-Runx1 in mouse basophil development.
Blood 120(1):76–85.
72. Qi X, et al. (2013) Antagonistic regulation by the transcription factors C/EBPα and MITF specifies basophil and mast cell fates. Immunity 39(1):97–110.
73. Collins FS, Varmus H (2015) A new initiative on precision medicine. N Engl J Med 372(9):793–795.
74. Sanjana NE, Shalem O, Zhang F (2014) Improved vectors and genome-wide libraries for CRISPR screening. Nat Methods 11(8):783–784.
75. Li H, Durbin R (2009) Fast and accurate short read alignment with Burrows-Wheeler transform. Bioinformatics 25(14):1754–1760.
76. Van der Auwera GA, et al. (2013) From FastQ data to high confidence variant calls: The Genome Analysis Toolkit best practices pipeline. Curr Protoc Bioinformatics 43(SUPL.43):1–33. 77. DePristo MA, et al. (2011) A framework for variation discovery and genotyping using
next-generation DNA sequencing data. Nat Genet 43(5):491–498.
78. McKenna A, et al. (2010) The Genome Analysis Toolkit: A MapReduce framework for analyzing next-generation DNA sequencing data. Genome Res 20(9):1297–1303. 79. Li H (2014) Toward better understanding of artifacts in variant calling from
high-coverage samples. Bioinformatics 30(20):2843–2851.
80. Delaneau O, Marchini J, Zagury J-F (2011) A linear complexity phasing method for thousands of genomes. Nat Methods 9(2):179–181.
81. Joshi PK, et al. (2016) Variants near CHRNA3/5 and APOE have age- and sex-related effects on human lifespan. Nat Commun 7:11174.
82. Männik K, et al. (2015) Copy number variations and cognitive phenotypes in un-selected populations. JAMA 313(20):2044–2054.
83. Lall K, Magi R, Morris A, Metspalu A, Fischer K (2016) Personalized risk prediction for type 2 diabetes: The potential of genetic risk scores. Genet Med, in press. 84. Howie BN, Donnelly P, Marchini J (2009) A flexible and accurate genotype
imputa-tion method for the next generaimputa-tion of genome-wide associaimputa-tion studies. PLoS Genet 5(6):e1000529.
85. Marchini J, Howie B, Myers S, McVean G, Donnelly P (2007) A new multipoint method for genome-wide association studies by imputation of genotypes. Nat Genet 39(7):906–913.
86. Willer CJ, et al. (2008) Newly identified loci that influence lipid concentrations and risk of coronary artery disease. Nat Genet 40(2):161–169.
87. Kumar P, Henikoff S, Ng PC (2009) Predicting the effects of coding non-synonymous variants on protein function using the SIFT algorithm. Nat Protoc 4(7):1073–1081. 88. Adzhubei IA, et al. (2010) A method and server for predicting damaging missense
mutations. Nat Methods 7(4):248–249.
89. Browning BL, Browning SR (2016) Genotype imputation with millions of reference samples. Am J Hum Genet 98(1):116–126.
90. Handsaker RE, et al. (2015) Large multiallelic copy number variations in humans. Nat Genet 47(3):296–303.
91. Chan Y, et al.; GIANT Consortium (2015) Genome-wide analysis of body proportion classifies height-associated variants by mechanism of action and implicates genes important for skeletal development. Am J Hum Genet 96(5):695–708.
92. Altshuler DM, et al.; International HapMap 3 Consortium (2010) Integrating common and rare genetic variation in diverse human populations. Nature 467(7311):52–58. 93. Purcell S, Chang C (2015) PLINK 1.9. Available at https://www.cog-genomics.org/
plink2. Accessed November 1, 2015.
94. Chang CC, et al. (2015) Second-generation PLINK: Rising to the challenge of larger and richer datasets. Gigascience 4(1):7.
95. UK Biobank (2015) Genotyping and Quality Control of UK Biobank, a Large-Scale, Extensively Phenotyped Prospective Resource. Available at biobank.ctsu.ox.ac.uk/ crystal/docs/genotyping_qc.pdf. Accessed April 1, 2016.
96. Purcell S, Cherny SS, Sham PC (2003) Genetic power calculator: Design of linkage and association genetic mapping studies of complex traits. Bioinformatics 19(1):149–150. 97. Wakefield J (2009) Bayes factors for genome-wide association studies: Comparison
with P-values. Genet Epidemiol 33(1):79–86.
98. Yue F, et al.; Mouse ENCODE Consortium (2014) A comparative encyclopedia of DNA elements in the mouse genome. Nature 515(7527):355–364.
99. Pollard KS, Hubisz MJ, Rosenbloom KR, Siepel A (2010) Detection of nonneutral substitution rates on mammalian phylogenies. Genome Res 20(1):110–121. 100. Davydov EV, et al. (2010) Identifying a high fraction of the human genome to be
under selective constraint using GERP++. PLOS Comput Biol 6(12):e1001025. 101. Rosenbloom KR, et al. (2015) The UCSC Genome Browser database: 2015 update.
Nucleic Acids Res 43(Database issue, D1):D670–D681.
102. Kulakovskiy IV, et al. (2016) HOCOMOCO: Expansion and enhancement of the collec-tion of transcripcollec-tion factor binding sites models. Nucleic Acids Res 44(D1):D116–D125. 103. Mathelier A, et al. (2016) JASPAR 2016: A major expansion and update of the open-access database of transcription factor binding profiles. Nucleic Acids Res 44(D1): D110–D115.
104. Grant CE, Bailey TL, Noble WS (2011) FIMO: Scanning for occurrences of a given motif. Bioinformatics 27(7):1017–1018.
105. Rao SSP, et al. (2014) A 3D map of the human genome at kilobase resolution reveals principles of chromatin looping. Cell 159(7):1665–1680.