HAL Id: cea-01290111
https://hal-cea.archives-ouvertes.fr/cea-01290111
Submitted on 17 Mar 2016
HAL is a multi-disciplinary open access
archive for the deposit and dissemination of
sci-entific research documents, whether they are
pub-lished or not. The documents may come from
teaching and research institutions in France or
abroad, or from public or private research centers.
L’archive ouverte pluridisciplinaire HAL, est
destinée au dépôt et à la diffusion de documents
scientifiques de niveau recherche, publiés ou non,
émanant des établissements d’enseignement et de
recherche français ou étrangers, des laboratoires
publics ou privés.
Insights into gas heating and cooling in the disc of NGC
891 from Herschel far-infrared spectroscopy
T. M. Hughes, K. Foyle, M. R. P. Schirm, T. J. Parkin, I. de Looze, C. D.
Wilson, G. J. Bendo, M. Baes, J. Fritz, A. Boselli, et al.
To cite this version:
T. M. Hughes, K. Foyle, M. R. P. Schirm, T. J. Parkin, I. de Looze, et al.. Insights into gas heating and
cooling in the disc of NGC 891 from Herschel far-infrared spectroscopy. Astronomy and Astrophysics
- A&A, EDP Sciences, 2015, 575, pp.A17. �10.1051/0004-6361/201424732�. �cea-01290111�
DOI:10.1051/0004-6361/201424732
c
ESO 2015
Astrophysics
&
Insights into gas heating and cooling in the disc of NGC 891
from Herschel far-infrared spectroscopy
?,??,???
T. M. Hughes
1, K. Foyle
2, M. R. P. Schirm
2, T. J. Parkin
2, I. De Looze
1, C. D. Wilson
2, G. J. Bendo
3,
M. Baes
1, J. Fritz
1, A. Boselli
4, A. Cooray
5, D. Cormier
6, O. Ł. Karczewski
7,
V. Lebouteiller
8, N. Lu
9, S. C. Madden
8, L. Spinoglio
10, and S. Viaene
11 Sterrenkundig Observatorium, Universiteit Gent, Krijgslaan 281-S9, 9000 Gent, Belgium
e-mail: thomas.hughes@ugent.be
2 Department of Physics & Astronomy, McMaster University, Hamilton, Ontario L8S 4M1, Canada
3 UK ALMA Regional Centre Node, Jodrell Bank Centre for Astrophysics, School of Physics and Astronomy,
University of Manchester, Oxford Road, Manchester M13 9PL, UK
4 Laboratoire d’Astrophysique de Marseille, Université d’Aix-Marseille and CNRS, UMR 7326, 13388 Marseille Cedex 13, France 5 Centre for Cosmology, Department of Physics and Astronomy, University of California, Irvine CA 92697, USA
6 Institut für theoretische Astrophysik, Zentrum für Astronomie der Universität Heidelberg, Albert-Ueberle Str. 2, 69120 Heidelberg,
Germany
7 Department of Physics & Astronomy, University of Sussex, Brighton BN1 9QH, UK
8 CEA, Laboratoire AIM, Université Paris VII, IRFU/Service d’Astrophysique, Bât. 709, Orme des Merisiers, 91191 Gif-sur-Yvette,
France
9 Infrared Processing and Analysis Centre, California Institute of Technology, MS 100-22, Pasadena CA 91125, USA 10 Istituto di Astrofisica e Planetologia Spaziali, INAF-IAPS, via Fosso del Cavaliere 100, 00133 Roma, Italy
Received 1 August 2014/ Accepted 21 October 2014
ABSTRACT
We present Herschel PACS and SPIRE spectroscopy of the most important far-infrared cooling lines in the nearby, edge-on spiral galaxy, NGC 891: [C
] 158 µm, [N
] 122, 205 µm, [O
] 63, 145 µm, and [O
] 88 µm. We find that the photoelectric heating efficiency of the gas, traced via the ([C
]+[O
]63)/FTIRratio, varies from a mean of 3.5 × 10⁻³in the centre up to 8 × 10⁻³at increasing radial andvertical distances in the disc. A decrease in ([C
]+[O
]63)/FTIRbut constant ([C
]+[O
]63)/FPAHwith increasing FIR colour suggeststhat polycyclic aromatic hydrocarbons (PAHs) may become important for gas heating in the central regions. We compare the observed flux of the FIR cooling lines and total IR emission with the predicted flux from a PDR model to determine the gas density, surface temperature and the strength of the incident far-ultraviolet (FUV) radiation field, G0. Resolving details on physical scales of ∼0.6 kpc,
a pixel-by-pixel analysis reveals that the majority of the PDRs in NGC 891’s disc have hydrogen densities of 1 < log(n/cm−3) < 3.5
experiencing an incident FUV radiation field with strengths of 1.7 < log G0 < 3. Although these values we derive for most of the
disc are consistent with the gas properties found in PDRs in the spiral arms and inter-arm regions of M 51, observed radial trends in n and G0are shown to be sensitive to varying optical thickness in the lines, demonstrating the importance of accurately accounting for
optical depth effects when interpreting observations of high inclination systems. Increasing the coverage of our analysis by using an empirical relationship between the MIPS 24 µm and [N
] 205 µm emission, we estimate an enhancement of the FUV radiation field strength in the far north-eastern side of the disc relative to the rest of the disc that coincides with the above-average star formation rate surface densities and gas-to-dust ratios. However, an accurate interpretation remains difficult due to optical depth effects, confusion along the line-of-sight and observational uncertainties.Key words.galaxies: individual: NGC 891 – galaxies: spiral – galaxies: ISM – infrared: galaxies – ISM: lines and bands
1. Introduction
Star formation in galaxies converts gas into stars, which in turn produce the heavy elements via nucleosynthesis. Upon their demise, stars expel the heavy elements along with any unpro-cessed gas back into the interstellar medium (ISM), where the metals either mix with the gas phase or condense to form dust
?
Based on observations from Herschel, an ESA space observa-tory with science instruments provided by European-led Principal Investigator consortia and with important participation from NASA.
?? Table 3 is available in electronic form athttp://www.aanda.org ???
Reduced Herschel data as FITS files are only available at the CDS via anonymous ftp tocdsarc.u-strasbg.fr(130.79.128.5) or via
http://cdsarc.u-strasbg.fr/viz-bin/qcat?J/A+A/575/A17
grains in enriched, cooling gas (see e.g. Nozawa & Kozasa 2013). Dust grains not only aid the synthesis of molecular hydro-gen from atomic hydrohydro-gen gas (Gould & Salpeter 1963), but also act as the dominant heating mechanism of the neutral interstel-lar gas, via photoelectrons that are ejected by incident UV pho-tons originating from young stars (e.g.Watson 1972;Hollenbach et al. 1991), in addition to other heating sources (cosmic rays, X-rays, mechanical heating, etc.). Polycyclic aromatic hydrocar-bons (PAHs) are considered to be a key source of photoelectrons (e.g.Bakes & Tielens 1994;Draine et al. 2007). For molecular clouds to collapse to form stars, the gas must be able to cool sufficiently to enable gravity to overcome random motion and remove the increasing thermal energy in the contracting clouds. The primary cooling mechanism of neutral gas is the collisional
excitation of forbidden transitions of heavy elements followed by radiative decay. The efficiency of these processes that heat and cool the gas therefore affect the global star formation pro-cess and the overall evolution of the ISM components.
The far-infrared (FIR) fine-structure cooling lines, such as the [C
] 158 µm, [N
] 122 and 205 µm, [O
] 63 and 145 µm, and [O
] 88 µm lines, play a crucial role in the thermal bal-ance of the gas. Photons emitted through de-exciting forbidden transitions from collisionally-excited atoms cool the gas by re-moving thermal energy. The low ionization potential of atomic carbon means that far-ultraviolet (FUV) photons with energies greater than 11.26 eV can produce C+, and so both neutral and ionized gas are traced by [C
] emission. The [C
] line lumi-nosity is typically 0.1−1% of the FIR lumilumi-nosity in normal star-forming galaxies, making it one of the dominant cooling lines (e.g.Crawford et al. 1985;Stacey et al. 1991). The [O
] lines originate in the neutral gas of photon dominated regions (PDRs), as atomic oxygen has an ionisation potential greater than hydro-gen (13.6 eV). A harder radiation field is required to ionise N and O+due to their ionization potentials of 14.5 and 35.1 eV, re-spectively. The [N
] and [O
] lines therefore trace only ionised gas predominantly found in H
regions. Thus, observations of these lines can tell us important characteristics about the gas in the cold neutral and ionized regimes of the ISM.The fraction of FUV photons heating the dust via absorption compared to the fraction responsible for ejecting electrons from dust grains or PAHs that heat the gas, provides a measure of the photo-electric heating efficiency of the FUV radiation field. Since warm dust is traced via the re-emission of absorbed UV and optical photons that peak at FIR wavelengths, and gas heated from photoelectrons ejected from small dust grains may be traced during cooling via the fine-structure lines, both dust heat-ing and gas coolheat-ing can be investigated via FIR observations. Previous studies have thus probed the photo-electric heating ef-ficiency via the observed [C
]/LTIR or ([C
]+[O
]63)/LTIRra-tios using, for example, the Kuiper Airborne Observatory (KAO, e.g. Stacey et al. 1991; Madden et al. 1993) and the Infrared Space Observatory (ISO, e.g.Hunter et al. 2001;Contursi et al. 2002). An ISO LWS spectrometer survey of 60 normal, star-forming galaxies spanning a range in various global properties, such as morphology and FIR colour, found a decreasing ratio of [C
]/LTIRtowards warmer IR colours (Malhotra et al. 2001; seealso Luhman et al. 1998;Brauher et al. 2008). One interpreta-tion of this result is that warmer dust becomes more positively charged in stronger FUV radiation fields, lowering the efficiency of the photoelectric effect.
Most recently, the Herschel Space Observatory (Pilbratt et al. 2010) with two of its instruments, the Photodetector Array Camera and Spectrometer (PACS, Poglitsch et al. 2010) and the Spectral and Photometric Imaging REceiver (SPIRE,Griffin et al. 2010), was capable of observing both the FIR cooling lines and FIR/submm spectral energy distribution at unprece-dented resolution, enabling the study of gas heating and cooling on galactic and spatially-resolved, sub-kiloparsec scales. Whilst studies using Herschel observations of nearby galaxies (e.g.
Cormier et al. 2010;Mookerjea et al. 2011;Beirão et al. 2012) and the LMC-N11 H
region (Lebouteiller et al. 2012) find that [C
]/FTIR varies on local scales, the ([C
]+[O
]63)/FTIR ratiohas also been found to vary as a function of FIR colour on small scales (Croxall et al. 2012;Lebouteiller et al. 2012;Parkin et al. 2013). In addition,Croxall et al.(2012) and Lebouteiller et al. (2012) report even tighter correlations between the heat-ing efficiency of PAHs, ([C
]+[O
]63)/FPAH, versus the FIRcolour, which suggests that PAHs may also trace the gas
heat-2h22m24s
36s
RA (J2000)
+42°17'
18'
19'
20'
21'
22'
23'
24'
25'
De
c (
J20
00
)
0.01 0.1 1.01
×10
− 4W
m
− 2sr
− 1 TIRFig. 1.Total infrared flux, FTIR, derived from the MIPS 24 µm, PACS
70 and 160 µm maps using Eq. (1). The map is presented in the 1200
resolution of the PACS 160 µm image with a pixel scale of 400
and units of W m−2sr−1. The black square, black rectangle and red circles
demar-cate the coverage of the PACS spectroscopic maps, PACS strips, and the SPIRE FTS observations, respectively. North is up, east is to the left.
ing. In M 51, the warmer dust showed a stronger decrease in heating efficiency when traced by ([C
]+[O
]63)/FTIRthan withthe ([C
]+[O
]63)/FPAHratio (Parkin et al. 2013). Whilst thereremains a possibility that PAHs are responsible for the majority of gas heating, their true role is still unknown.
These diagnostic ratios may be used to determine the phys-ical properties of the gaseous components of the ISM by com-paring the observed values to the predictions of a PDR model. Several PDR models for determining the gas density, tempera-ture and strength of the FUV radiation field are available (see
Röllig et al. 2007for a discussion, and references within). One of the most commonly used PDR models is that of Tielens & Hollenbach(1985), which characterises the physical condi-tions in a semi-infinite, plane-parallel slab PDR by two free variables: the hydrogen nucleus density, n, and the strength of the FUV radiation field in units of the Habing Field, G0 =
1.6 × 10⁻³ erg cm−2 s−1 (Habing 1968). The model has since been updated byWolfire et al.(1990),Hollenbach et al.(1991) andKaufman et al.(1999,2006). Predictions from PDR models have been compared to Herschel observations of both Galactic PDRs and nearby galaxies. For example,Croxall et al.(2012) studied a late-type spiral, NGC 1097, and a Seyfert 1 galaxy, NGC 4559, finding 50 ≤ G0 ≤ 1000 varying with 102.5cm−3≤
n ≤ 103cm−3 across both discs. Most recently, Parkin et al.
(2013) examined the n and G0 in various regions of M 51; the
hydrogen density and FUV radiation peak in the nucleus and similarly decline in both the spiral arm and interarm regions, suggesting similar physical conditions in clouds in these envi-ronments (see alsoParkin et al. 2014).
To complement these recent studies of typical face-on sys-tems, we can use observations of edge-on galaxies to study the vertical variations in the physical conditions of the interstellar gas, particularly important for understanding possible vertical gas outflows driven by star formation and the structure of the
multiphase ISM (see e.g.Shapiro & Field 1976;Bregman 1980;
Norman & Ikeuchi 1989). NGC 891 is a prototypical example of a near perfect edge-on (i >89◦, e.g.Xilouris et al. 1998), non-interacting spiral galaxy (SA(s)b,de Vaucouleurs et al. 1976) lo-cated right in our neighbourhood (D= 9.6 Mpc, e.g.Strickland et al. 2004), and which exhibits many properties similar to our own Milky Way. These characteristics make NGC 891 an ideal target for studying the interstellar material in a star-forming disc, and so it has already been extensively observed at a range of wavelengths (see Hughes et al. 2014 and references therein).
Madden et al.(1994) mapped the [C
](158 µm) line emission over an 80 region of the galaxy with the Far-Infrared Fabry-Perot Imaging Spectrometer (FIFI) on the KAO at 5500resolu-tion (i.e. ∼2.6 kpc), finding extraplanar [C
] emission near the nucleus. More recently,Stacey et al.(2010) investigated the ra-dial profiles of the [C
] 158 µm, [O
] 63 µm and [N
] 122 µm fine-structure lines in NGC 891 from reprocessed observations made with the ISO LWS spectrometer at ∼7500 resolution (seeBrauher et al. 2008, and references therein). A comparison to PDR models found G0 = 200−400 and n ∼ 104 cm−3 across
the disc. However, the low resolution of these datasets, typi-cally ∼10, meant a spatially-resolved pixel-by-pixel analysis of
the gas heating and cooling efficiencies determined from the FIR cooling lines and the FIR/submm SED was not previously feasible.
In this paper, we present new Herschel FIR spectroscopy of NGC 891 obtained as part of the Herschel guaranteed time key project, the Very Nearby Galaxies Survey (VNGS; P.I. : C.D. Wilson), which aims to study the gas and dust in the ISM of a diverse sample of 13 nearby galaxies using Herschel. We focus on the [C
] 158 µm, [N
] 122 µm, [O
] 63 and 145 µm and [O
] 88 µm fine structure lines observed at unprecedented resolution (better than ∼1200, or roughly 0.5 kpc) with the PACS instrument. We also present observations of the [N
] 205 µm line from the SPIRE Fourier Transform Spectrometer (FTS) at ∼1700resolution. We use these spectra combined with themulti-wavelength photometry presented inHughes et al.(2014) to in-vestigate the physical properties of the interstellar gas in the galaxy by using the PDR model ofKaufman et al.(1999,2006). In particular, we are interested in comparing the gas heating and cooling mechanisms observed in the disc from a near-perfect edge-on orientation, as in NGC 891, to those of the face-on spi-ral galaxy, M 51. Our paper is structured as follows. In Sect. 2, we describe our observations and data reduction methodology. In Sects. 3 and 4, we describe the characteristics of the gas and compare our observations to theoretical PDR models, re-spectively. Finally, Sects. 5 and 6 present our discussion and conclusions.
2. Observations
We first present our Herschel PACS and SPIRE spectroscopic observations, summarised in Table 1, and describe the data reduction steps for producing maps of the FIR cooling line emission.
2.1. Herschel PACS spectroscopy
Covering a wavelength range of 51 to 220 µm, the PACS spec-trometer comprises 25 spaxels each with a 9.400 field of view and arranged in a 5×5 grid with an approximately square field of view of 4700on each side. The spectral resolution ranges between 75 and 300 km s−1and the beam FWHM varies from approxi-mately 9 to 1300. Our VNGS PACS spectroscopic observations
2h22m24s
36s
RA (J2000)
+42°17'
18'
19'
20'
21'
22'
23'
24'
25'
De
c (
J20
00
)
A
B
C
D
1.05 2.05 3.05 4.05 5.051
×10
− 4W
m
− 2sr
− 1Schematic
Ed
ge
Ce
nte
r
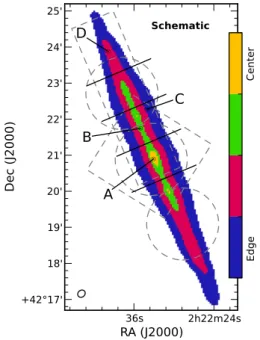
Fig. 2.Schematic diagram of the radial bins (divided by solid black
lines) and the four regions based on the TIR flux density (see Sect.2.3
and Fig.1) that we use in our analysis to search for regional variations in the gas properties. Labels A-D mark positions of the typical line spectra shown in Fig.3. The dashed grey lines demarcate the coverage of the PACS and SPIRE spectroscopic maps for reference.
were taken on the 28th February and 1st March, 2011, using the unchopped grating scan mode. They consist of raster maps and strips of the [C
], [N
] 122 and [O
] 63 µm line emission that cover the central 2.50× 2.50and 0.720× 2.250along thenorth-eastern side of the disc, and 0.720× 3.250 raster strips of the
[O
] 145 µm and [O
] 88 µm emission that also cover the north-ern disc. In Fig.1, we superimpose the outlines of our observa-tions onto a map of the total infrared flux (see Sect.2.3).These observations were processed from Level 0 to Level 1 using the Herschel interactive processing environment (HIPE, v.9.2Ott 2010) with calibration files FM,41, following the stan-dard pipeline reduction steps for the unchopped observing mode. Further details may be found inParkin et al. (2013). Level 1 cubes were exported to PACSman v.3.5.2 (Lebouteiller et al. 2012), where each individual spaxel’s spectrum is fit with a Gaussian function and second order polynomial for the line and continuum baseline, respectively. Representative spectra ob-served from different locations in the galaxy, as indicated in Fig. 2, are shown with the best fitting functions in Fig. 3. Intensity maps of the integrated flux are created from the in-dividual rasters, also using PACSman, by projecting the rasters onto a common, over-sampled grid with a 3.13300 pixel size.
Table1lists the resolution and sizes of the final mosaicked maps of the [C
] 158 µm, [N
] 122 µm, [O
] 63 and 145 µm, and [O
] 88 µm emission.2.2. Herschel SPIRE spectroscopy
The Herschel SPIRE FTS instrument (Griffin et al. 2010) con-sists of two bolometer arrays, the SPIRE Short Wavelength (SSW) array and the SPIRE Long Wavelength (SLW) array, covering wavelength ranges of 194 to 313 µm and 303 to 671 µm, respectively, with a 20 diameter field of view. Using the SPIRE FTS, we observed the centre of NGC 891 (α = 2h22m33.s41, δ = +42◦20056.009) in high spectral resolution
Table 1. Properties of our Herschel PACS and SPIRE spectroscopic observations of NGC 891.
Instrument Line λrest Transition OBSID Date of Map size FWHM Duration
(µm) observation (0 ×0 ) (00 ) (s) PACS [O
] 63.184 3P 1-3P2 1342214876 01 Mar. 2011 2.5 × 2.5 9.3 11 182 1342214881 01 Mar. 2011 0.72 × 2.25 9.3 1462 [O
] 88.356 3P 1-3P0 1342214877 01 Mar. 2011 0.72 × 3.25 9.3 3575 [N
] 121.898 3P 2-3P1 1342214875 28 Feb. 2011 2.5 × 2.5 10 10 266 1342214878 01 Mar. 2011 0.72 × 2.25 10 2400 [O
] 145.525 3P 0-3P1 1342214880 01 Mar. 2011 0.72 × 3.25 11 6809 [C
] 157.741 3P 3/2-3P1/2 1342214874 28 Feb. 2011 2.5 × 2.5 11.5 5588 1342214879 01 Mar. 2011 0.72 × 2.25 11.5 1462 SPIRE FTS [N
] 205.178 3P0-3P1 1342213376 28 Jan. 2011 ∼20diameter circle 17 17 603
1342224765 26 Jul. 2011 ∼20
diameter circle 17 7668
1342224766 26 Jul. 2011 ∼20
diameter circle 17 7668
(FWHM = 0.048 cm−1), intermediate-sampling mode. These observations were taken on 28th January, 2011 (OD 625) with observation ID 1342213376 and a total integration time of 17603 seconds (∼5 h) for the entire map. In addition, we supple-mented these data with publicly available open time observations (P. I.: G. Stacey) of the upper (ID 1342224766, α= 2h22m37.s29,
δ = +42◦22041.008) and lower (ID 1342224765, α= 2h22m28.s69,
δ = +42◦19005.006) portions of the disc of NGC 891. These
obser-vations were both performed in high spectral resolution, sparse-sampling mode with a total integration time of 7668 s (∼2 h) each.
We reduce the FTS data for our intermediate-sampling ob-servations using a modified version of the standard Spectrometer Mapping user pipeline from HIPE v.11.0.1 along with SPIRE calibration context v.11.0. The standard pipeline assumes that the source is extended and uniformly fills the beam; however, NGC 891 only partially fills the beam. As such, we apply the same point-source correction to each jiggle position as done in
Schirm et al.(2014). For reducing the sparse-sampling FTS data, we use the standard Spectrometer Single Pointing user pipeline along with HIPE v.11.1 and SPIRE calibration context v11.1. The standard pipeline outputs both extended source calibrated and point-source calibrated data. Once again, since the beam is not uniformly filled, we opt to use the point-source calibrated data. We combine all 4 jiggle positions from the intermediate-sampled observations and the 2 sparse-sampling observations into 2 data cubes using the spireProjection task in HIPE: one cube for the SLW and one for the SSW. The flux calibration un-certainty is 7%, although this does not include unun-certainty from source-beam coupling. Finally, the [N
] 205 µm line was fit with a Sinc function across the entire map using the same technique as described inSchirm et al.(2014). The final emission map has a resolution of ∼1700with a 1500pixel size.2.3. Ancillary data
We use the VNGS Herschel PACS photometric maps at 70 and 160 µm originally presented inHughes et al.(2014). The maps have pixel sizes of 1.004 and 2.0085, which correspond to one
quar-ter of the point spread function (PSF) full width half maximum (FWHM) for the scan speed used for these observations, for the 70 and 160 µm maps respectively. The calibration uncertainty is 5%. We also use the Multiband Imaging Photometer for Spitzer (MIPS;Rieke et al. 2004) 24 µm data, which were reprocessed
by Bendo et al. (2012) using the MIPS Data Analysis Tools (Gordon et al. 2005) along with additional processing steps. The image has a pixel scale of 1.005, the PSF FWHM is 600, and the calibration uncertainty is 4% (Engelbracht et al. 2007).
We estimate the total infrared flux emitting from 3 to 1100 µm, FTIR, using these MIPS 24 µm, PACS 70 and 160 µm
maps. The maps were first convolved to a common 1200
reso-lution of the PACS 160 µm image using the common-resoreso-lution convolution kernels1ofAniano et al.(2011), and rescaled to a 400
pixel scale. The total infrared flux is then calculated from these images via the empirical equation fromGalametz et al.(2013), given by
FTIR = c24ν24F24 + c70ν70F70 + c160ν160F160 (1)
where the coefficients [c24, c70, c160] = [2.133, 0.681, 1.125]
are taken fromGalametz et al.(2013, see their Table 3). We es-chew the techniques that include the SPIRE photometric maps in estimating the total infrared (TIR) emission (Galametz et al. 2013) out of our desire to preserve the relatively high (1200) mon spatial resolution attained with the PACS 160 µm map com-pared to the SPIRE maps (>1800; seeHughes et al. 2014). The
calibration is shown to as reliably reproduce estimates of the properly modelled TIR emission (within ∼20%) as when using the complete sampling of the FIR/submm emission, i.e. data at 24, 70, 100, 160 and 250 µm (see Fig. 10 in Galametz et al. 2013). Whilst the resulting FTIRmap, presented in Fig.1, covers
the entire disc of NGC 891, we only use those regions that over-lap with the spectroscopic maps in our analysis. Furthermore, we use the contours of the TIR map as a means of crudely dissect-ing the galaxy into different morphological regions: flux densi-ties of FTIR ≥ 1.2 × 10⁻⁴, 0.5 × 10⁻⁴ ≤ FTIR < 1.2 × 10⁻⁴,
1.5 × 10⁻⁵≤ F
TIR< 5×10⁻⁵, and 0.4 × 10⁻⁵≤ FTIR< 1.5×10⁻⁵
W m−2sr−1correspond to the galaxy centre, the mid-plane of the disc, and regions at intermediate and higher radial and vertical heights above the plane, respectively. A schematic is presented in Fig.2.
Finally, we use the Spitzer Infrared Array Camery (IRAC;
Fazio et al. 2004) 3.6 µm map presented inHughes et al.(2014) to trace the stellar continuum emission, and a new IRAC 8 µm map as a proxy for the PAH emission. The latter data were ob-tained in astronomical observation requests 3631872. Individual
1 PSFs, convolution kernels and the IDL task
_.
from Aniano et al. are available from http://www.astro.
−0.2 −0.1 0.0 0.1 0.2 −4 −2 0 2 4 6 8 −0.2 −0.1 0.0 0.1 0.2 −0.2 −0.1 0.0 0.1 0.2 −0.2 −0.1 0.0 0.1 0.2 −0.2 −0.1 0.0 0.1 0.2 −4 −2 0 2 4 6 8 10 12 −0.2 −0.1 0.0 0.1 0.2 −0.2 −0.1 0.0 0.1 0.2 −0.2 −0.1 0.0 0.1 0.2 −0.5 0.0 0.5 −2 0 2 4 6 8 10 −0.5 0.0 0.5 −0.5 0.0 0.5 −0.5 0.0 0.5 −0.5 0.0 0.5 −3 −2 −1 0 1 2 3 4 5 6 −0.5 0.0 0.5 −0.5 0.0 0.5 −0.5 0.0 0.5 −0.5 0.0 0.5 −5 0 5 10 15 20 25 30 35 40 −0.5 0.0 0.5 −0.5 0.0 0.5 −0.5 0.0 0.5
A: center B: mid-plane C: off-plane D: outer disc
λ − λrest(µm) λ − λrest(µm) λ − λrest(µm) λ − λrest(µm)
F[O I] 63 µm (J y) F[O II I] 88 µm (J y) F[N II ] 12 2 µm (J y) F[O I] 14 5 µm (J y) F[C II ] 15 8 µm (J y)
Fig. 3.[O
] 63, [O
] 88, [N
] 122, [O
] 145, and [C
] 158 µm line spectra (top to bottom) found in locations A-D (see Fig.2) representative ofthe central, mid-plane, off-plane and outer regions (left to right). We plot the rms after 5σ clipping (black line) and corresponding ±1σ values in each bin (grey area), and our best fit Gaussian profile and baseline (solid and dashed red lines).
corrected basic calibration data frames were processed with ver-sion 18.25.0 of the IRAC pipeline and remosaicked using the standard IRAC pipeline within the MOsaicker and Point source EXtractor (Makovoz & Khan 2005). The final image has a pixel scale of 0.0075 and PSF FWHM of 1.009. Calibration uncertainties are 4% (IRAC Instrument and Instrument Support Teams, 2013, IRAC Instrument Handbook, Version 2.0.3, JPL, Pasadena). To estimate the total PAH power with the IRAC 8 µm map, we first apply a colour correction following the method in the Spitzer Data Analysis Cookbook2 and then subtract the stellar contri-bution estimated from the available IRAC 3.6 µm map via the
Marble et al. (2010) correction (see Eq. (2) in Croxall et al. 2012). We discuss in detail the uncertainty in the PAH power in Sect.3.7, yet note a 6% uncertainty in the aromatic fraction of the IRAC 8 µm flux reported byMarble et al.(2010).
2.4. Image processing
All spectroscopic images were first convolved to the resolution of the 160 µm image, since this band has a PSF with the largest FWHM, using the appropriate Gaussian common-resolution convolution kernels1 and the IDL task
_.
(Aniano et al. 2011). For the results presented here, the images were regridded to the pixel size of the 160 µm map using the M
software package. We note that since the pixel size (400) is smaller than the 160 µm beam size (1200), adjacent pixelsare not independent. However, we also performed the following analysis in its entirety using maps with a pixel scale matching the 160 µm beam size (1200) and, despite having far fewer pix-els, the analysis reproduces the same trends and conclusions as found when oversampling the maps. Errors on each pixel were calculated by summing the flux calibration uncertainty, instru-mental noise and sky background measurement in quadrature. For the pixels covering the galaxy, the flux errors are dominated by the calibration uncertainty. We use flux calibration uncertain-ties of 30% and 7% for the PACS and SPIRE FTS observations, respectively. Finally, we only consider pixels with a signal-to-noise ratio S /N > 3σ, excluding the calibration uncertainties, in our analysis.
3. Physical properties of the gas
3.1. Morphology of line emission
Our final [C
] 158 µm, [N
] 122 and 205 µm, [O
] 63 and 145 µm, and [O
] 88 µm emission maps are presented in Fig. 4 at their native resolution and with an applied 3σ cut. The [C
] 158 µm, [N
] 122 µm, and [O
] 63 µm all show re-markable spatial correlation with the main morphological fea-tures of NGC 891 evident in most observations at FIR/submm wavelengths (see e.g. Fig. 1 ofHughes et al. 2014) and high-lighted here with the contours of the FTIRemission map: a peakin line emission in the galaxy centre, with two smaller maxima located either side of the centre at radial distances approximately 4 to 6 kpc along the semimajor axis. The [C
], [O
] 63 µm and [O
] lines also appear to display an enhancement in their emis-sion relative to the TIR contours on the far north eastern side of the disc, a location infamous for its higher luminosity at various wavelengths (e.g. Hα,Kamphuis et al. 2007) compared to the opposite region on the southern side of the disc. Unfortunately, the lack of PACS spectroscopic observations towards the south2 See http://irsa.ipac.caltech.edu/data/SPITZER/docs/
dataanalysistools/cookbook/
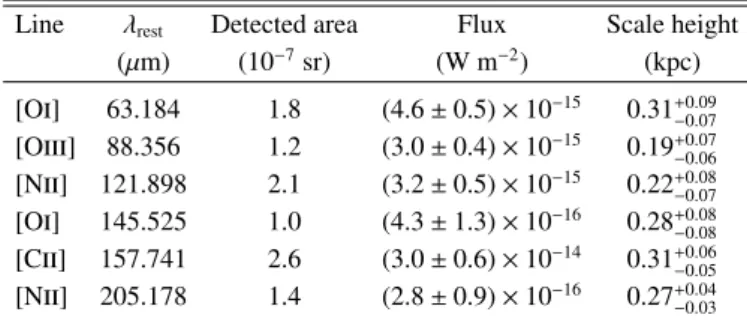
Table 2. Measured properties of fine-structure line emission.
Line λrest Detected area Flux Scale height
(µm) (10−7sr) (W m−2) (kpc) [O
] 63.184 1.8 (4.6 ± 0.5) × 10−15 0.31+0.09 −0.07 [O
] 88.356 1.2 (3.0 ± 0.4) × 10−15 0.19+0.07 −0.06 [N
] 121.898 2.1 (3.2 ± 0.5) × 10−15 0.22+0.08 −0.07 [O
] 145.525 1.0 (4.3 ± 1.3) × 10−16 0.28+0.08 −0.08 [C
] 157.741 2.6 (3.0 ± 0.6) × 10−14 0.31+0.06 −0.05 [N
] 205.178 1.4 (2.8 ± 0.9) × 10−16 0.27+0.04 −0.03means we cannot investigate whether such asymmetry also exists in the line emission from the disc. However, our new maps pro-vide the ideal opportunity to study the gas properties in this re-gion further and so we shall return to discuss this topic shortly.
In Table 2, we present the integrated line emission from each of the maps in Fig.4 yet caution, however, that our in-tegrated line fluxes are certainly an underestimate of the true global emission since our PACS observations do not cover the full extent of NGC 891’s disc, thus missing any contribution from the south-west side. We measure a total [C
] emission of (3.0 ± 0.6) × 10−14W m−2across a mapped area of ∼2.6 × 10⁻⁷sr.NGC 891’s [C
] emission was previously mapped at 5500 reso-lution with the Far-Infrared Fabry-Perot Imaging Spectrometer on the KAO byMadden et al.(1994, see their Fig. 5), finding a peak intensity of 1 × 10⁻⁴ ergs s−1 cm−2 sr−1 in the centre.Consistent with these results, our [C
] map has an integrated in-tensity of (1.2 ± 0.1) × 10−4ergs s−1cm−2sr−1within a central10-diameter aperture. We also note that the integrated [C
] line intensity contours from theMadden et al.(1994) KAO observa-tions correlate qualitatively with the spatial distribution of [C
] seen in our Herschel maps, with both sets of observations dis-playing a central peak and two secondary peaks along the semi-major axis. Extraplanar [C
] emission matching the Madden et al.contours is evident in the original maps, but is not detected above the 3σ level in the PACS map (see also Fig.5). In an 8400-diameter aperture, Brauher et al. (2008) find a [C
] flux of 7.79 × 10⁻¹⁵ W m−2 that is slightly lower than our valueof (9.2 ± 0.9) × 10−15 W m−2 found using the same aperture and smoothing our data to the ∼7500resolution of the ISO LWS
beam. More recently,Stacey et al.(2010) calculated the lumi-nosities of several fine-structure lines in NGC 891 from repro-cessed observations made with the ISO LWS spectrometer (see
Brauher et al. 2008, and references therein). Smoothing our data to match the ISO LWS beam resolution, we find an integrated [C
] line luminosity of (1.20 ± 0.20) × 108Lin agreement with
value of 1.40 × 10⁸L
reported byStacey et al.(2010).
From the [N
] 122 µm emission in our maps, we calculate a total intensity of (3.2 ± 0.5) × 10−15 W m−2across our mappedarea of ∼2.1 × 10⁻⁷sr. The nuclear [N
] 122 µm emission mea-sured with the ISO LWS is 1.11 × 10⁻¹⁵W m−2(Brauher et al.2008), which agrees with the flux of (1.2 ± 0.2) × 10−15W m−2
found from our data when matching the aperture properties and resolution of the LWS data. Similarly, our total [O
] 63 µm emis-sion is (4.6 ± 0.5) × 10−15 W m−2 across our mapped area of ∼1.8 × 10⁻⁷ sr. As in the case of the [C
] emission, the in-tegrated [O
] line luminosity in our smoothed ∼7500 resolution map of (1.81 ± 0.25) × 107L, which we stress is a lower limit
due to differences in spatial coverage, appears somewhat consis-tent with the measurement of 4.67 × 10⁷L
from the ISO LWS
2h22m30s 36s 42s
RA (J2000)
+42°20' 21' 22' 23' 24' 25' 1.0 10.0 1 × 10 − 8W m − 2sr − 1 2h22m30s 36s 42sRA (J2000)
+42°20' 21' 22' 23' 24' 25'De
c (
J20
00
)
1.0 10.0 1 × 10 − 8W m − 2sr − 1 2h22m30s 36s 42sRA (J2000)
+42°20' 21' 22' 23' 24' 25' 1.0 10.0 1 × 10 − 8W m − 2sr − 1 [OIII] 88 µm [OI] 63 µm [NII] 122 µm 2h22m30s 36s 42sRA (J2000)
+42°20' 21' 22' 23' 24' 25' 10.0 50.0 1 × 10 − 8W m − 2sr − 1 2h22m30s 36s 42sRA (J2000)
+42°20' 21' 22' 23' 24' 25'De
c (
J20
00
)
1.0 3.0 1 × 10 − 8W m − 2sr − 1 2h22m24s 28s 32s 36s 40sRA (J2000)
+42°18' 19' 20' 21' 22' 23' 24' 1.0 10.0 1 × 10 − 8W m − 2sr − 1 [CII] 158 µm [OI] 145 µm [NII] 205 µmFig. 4. HerschelPACS and SPIRE spectroscopic maps of the most important FIR cooling lines in NGC 891: [O
] λ 63 µm (upper left), and[O
] λ 88 µm (upper middle), [N
] λ 122 µm (upper right), [O
] λ 145 µm (lower left), [C
] λ 158 µm (lower middle), and [N
] λ 205 µm (lower right). The maps are centred on α= 2h22m35.s7, δ= +42◦220
05.00
9 (J2000.0), except for the [N
] 205 µm image that is centred as in Fig.1, and are presented in their native resolution and pixel size. We only show pixels with S/N > 3σ, yet note that only raster strips are available for the [O
] λ 88 and [O
] λ 145 µm line emission. Contours from the FTIRmap (see Fig.1) are superimposed on each image as a visual aid, with thelevels corresponding to 4 × 10⁻⁶, 1 × 10⁻⁵, 2.5 × 10⁻⁵, 5 × 10⁻⁵, 7.5 × 10⁻⁵, 1 × 10⁻⁴, and 1.25 × 10⁻⁴W m−2sr−1. North is up, east is to the left.
The VNGS observations of the [O
] 145 µm and [O
] emis-sion consist of only strips that cover a smaller area than the com-bination of strips plus maps available for the other lines, and are less sensitive due to the raster spacing. Furthermore, the two lines are intrinsically weak. The [O
] 145 µm map displays a spatial distribution similar to that of the 63 µm emission, albeit with much weaker emission. We calculate a total [O
] 145 µm intensity of (4.3 ± 1.3)×10−16W m−2across our mapped area of ∼1.0 × 10⁻⁷sr. The corresponding integrated [O
] 145 µm line luminosity is (1.25 ± 0.5) × 106L in the ∼7500resolution map,which is only consistent with theStacey et al.(2010) measure-ment of 4.74 × 10⁶L when taking into account our 30%
calibra-tion error, theStacey et al.(2010) 50% error, and the differences in spatial coverage. Finally, we measure a total [O
] 88 µm line intensity of (3.0 ± 0.4) × 10−15W m−2across our mapped area of ∼1.2 × 10⁻⁷sr, and note that the spatial distribution issimi-lar to that of the other FIR line emission and appears to follow
the FTIRcontours.Brauher et al.(2008) report an [O
] flux of1.52 × 10−15W m−2from the central 8400-diameter aperture, in
agreement with our value of (1.65 ± 0.24) × 10−15W m−2. Thus, we conclude that our observations appear consistent to previous measurements from both KAO and ISO observations.
3.2. Line scale heights
Crucial for our later discussion about the FIR line emission above the mid-plane, we now investigate whether or not the ob-servations are spatially-resolved in the vertical direction. We ex-tracted vertical profiles of the six FIR fine-structure lines from the emission maps (see Fig.4). Following the same methodol-ogy asVerstappen et al.(2013) andHughes et al.(2014), we ro-tated our maps to a horizontal orientation before summing all the values of pixels with S /N > 3σ along the major axis to generate
−3 −2 −1 0 1 2 3 10-7 10-6 10-5 [OI] 63 µm hz=0.31kpc −3 −2 −1 0 1 2 3 10-7 10-6 10-5 [OIII] 88 µm hz=0.19kpc −3 −2 −1 0 1 2 3 10-7 10-6 10-5 [NII] 122 µm hz=0.22kpc −3 −2 −1 0 1 2 3 10-8 10-7 10-6 [OI] 145 µm hz=0.28kpc −3 −2 −1 0 1 2 3 10-7 10-6 10-5 [CII] 158 µm hz=0.31kpc −3 −2 −1 0 1 2 3 10-8 10-7 10-6 [NII] 205 µm hz=0.28kpc Vertical offset (kpc) Su rfac eb righ tn ess (W m − 2sr − 1)
Fig. 5. Vertical profiles from the emission maps (S /N > 3σ) of the
[C
] 158 µm, [N
] 122 and 205 µm, [O
] 63 and 145 µm, and [O
] 88 µm fine-structure lines are plotted as blue circles connected by a blue line. We fit with an exponential profile (solid red line), which has been convolved with a Gaussian of FWHM similar to the Herschel beam at the corresponding wavelength (black dashed line). For the [C
] profile, we also show the profile including the extraplanar emis-sion detected at the >1σ level (grey circles and grey line).the profiles. We model these profiles with an exponential func-tion appropriate for an exactly edge-on, double-exponential disc, given by Σver,λ(z)= 1 2hz,λexp − |z| hz,λ ! (2) where hz,λis the scale height of each line. We first convolve the
vertical profile model with the Herschel beams at each corre-sponding wavelength, using the appropriate Gaussian PSF im-ages1 available from Aniano et al.(2011). In order to obtain one-dimensional beams, the two-dimensional PSFs are averaged along one direction in the same manner as we obtain the verti-cal profiles. The optimal value of hzthat reconciles the observed
and model profiles was found by using a χ2 minimisation
tech-nique with uncertainties also derived from the χ2probability
dis-tribution. We adopt position angles of 22.9◦for our analysis (see
Bianchi & Xilouris 2011;Hughes et al. 2014).
The resulting vertical profiles are shown in Fig. 5. For NGC 891, we derive scale heights of 0.31+0.06−0.05, 0.22+0.08−0.07, 0.27+0.04−0.03, 0.31+0.09−0.07, 0.28+0.08−0.08 and 0.19+0.07−0.06 kpc for the [C
] 158 µm, [N
] 122 and 205 µm, [O
] 63 and 145 µm, and [O
] 88 µm emission, respectively. Interestingly, the scale heights of the ionized gas tracers, i.e. the [N
] 122 and [O
] 88 lines, are consistent with scale heights found in previous stud-ies using optical and mid-IR emission lines to trace the morediffuse ionised gas. From Spitzer Infrared Spectrograph observa-tions of NGC 891,Rand et al.(2008,2011) found scale heights of between approximately 0.25–0.5 kpc for the [Ne
] 12.81, [Ne
] 15.56 and [S
] 18.71 µm line emission (see Fig. 8 inRand et al. 2011). Following the reasoning ofVerstappen et al.
(2013), as our profiles are not dominated by the telescope beam, as evident in Fig.5, and the deconvolved scale height values we derive from the profile fitting are not consistent with zero at the 5σ level, we conclude that our vertical profiles of the FIR lines are spatially resolved.
Previous observations have uncovered significant amounts of extended extraplanar emission from dust (e.g.,Howk & Savage 1999) as well as PAHs and small dust grains (e.g.,Burgdorf et al. 2007;Rand et al. 2008;Whaley et al. 2009) in NGC 891, and also other edge-on spirals (e.g.Thompson et al. 2004;Rand et al. 2011;Holwerda et al. 2012;Verstappen et al. 2013). Since PAHs appear to dominate the photoelectic heating of the gas (see Sect.3.7for a discussion), we would expect to see cooling from the fine-structure lines at least up to the same scale heights as the PAH features. Such extraplanar emission would be most evident from the primary gas coolants, the [C
] 158 µm and [O
] 63 µm lines (e.g.Wolfire et al. 1995;Kaufman et al. 1999). In fact, some extraplanar [C
] emission matching the Madden et al.(1994) contours is evident in the original maps albeit not detected in the PACS map above the 3σ level and, in the lower middle panel of Fig.5, we present the [C
] vertical profile including the extra-planar emission detected at the 1 to <3σ level. Furthermore, we find our [C
] scale height is in rough agreement with the scale heights of the PAH features (∼0.4−0.5 kpc) derived byRand et al.(2011).3.3. Consideration of optical depth effects
With edge-on galaxies like NGC 891, we face the possibility that variations in the optical depth along the line-of-sight may affect certain line ratios and thereby modify any trends found in the analysis, which becomes particularly important when en-countering higher column densities as we observe towards the centre of the galaxy. We can check whether such effects pose an issue in this work using our [O
] line observations. The [O
] 63 and 145 µm lines have respective upper level energies,∆E/k, of 228 K and 327 K above the ground state (see e.g.Tielens & Hollenbach 1985; Liseau et al. 2006), meaning the ratio of [O
]145/[O
]63 can probe optically thin neutral gas with tem-peratures of ∼300 K. The [O
] 63 µm line can become opti-cally thick at lower column densities faster than the 145 µm line, leading to an apparent increase in the ratio at gas temperatures lower than ∼1000 K (Tielens & Hollenbach 1985). We thus ex-amine the optical thickness of the neutral gas by comparing our observed values to the theoretical values expected for gas with varying temperatures.In the left panel of Fig. 6, we present our map of the [O
]145/[O
]63 ratio. Even though the [O
] 145 µm line was only mapped along a radial strip (cf. Fig.4), our measurements of the ratio cover the central region of the galaxy where we would expect optical depth effects to become most important. In fact, towards the centre region, the [O
]145/[O
]63 ratio is typically >0.15 with uncertainties of ∼10%. Comparing the inverse of this value with Fig. 4 ofLiseau et al.(2006), we find that the [O
] 63 µm line is either optically thick with T >∼ 200 K and n >∼ 103 cm−3, or optically thin and hot with T >∼ 1000 K and a density of approximately 103 cm−3. For the central peak of [O
]145/[O
]63 ∼ 0.41, the gas is likely to be completely optical thick. Such a high ratio could also indicate optical depth effects2h22m30s 36s 42s
RA (J2000)
+42°20' 21' 22' 23' 24' 25' 0.60 0.80 1.00 1.20 1.40 1.60 1.80 2.00 2h22m30s 36s 42sRA (J2000)
+42°20' 21' 22' 23' 24' 25'De
c (
J20
00
)
0.05 0.10 0.15 0.20 0.25 0.30 0.35 0.40 0.45 0.50 2h22m30s 36s 42sRA (J2000)
+42°20' 21' 22' 23' 24' 25' 0.80 1.20 1.60 2.00 2.40 2.80 3.20 3.60 4.00 [OIII]88/[OI]63 [OI]145/[OI]63 [OIII]88/[NII]122Fig. 6.Maps of indicators of the interstellar gas properties: the [O
]145/[O
]63 line ratio for tracing the gas temperature (left), the [O
]88/[O
]63line ratio as a tracer of the ionised gas fraction (middle), and the [O
]88/[N
]122 ratio for deriving the stellar effective temperatures of the ionising sources (right). The maps are centred on α = 2h22m35.s7, δ= +42◦220
05.00
9 (J2000.0) and are presented in the resolution and pixel size of the PACS 160 µm map. Contours from the FTIRmap (see Fig.1) are superimposed on each image as a visual aid with levels as listed in Fig.4.
in the continuum emission at 63 µm and/or foreground absorp-tion by low-density, diffuse gas, especially since NGC 891’s almost perfect edge-on inclination could significantly increase τdust. Radiative transfer modelling of the disc, beyond the scope
of this work, would be required to accurately investigate such ef-fects on the continuum. The remainder of the disc, however, ex-hibits [O
]145/[O
]63 ratios <0.15 that correspond to optically thin neutral gas at temperatures ∼100−300 K.We attempt to derive a rough constraint on the extinction AV
from the dust mass surface density map, derived from VNGS Herschel PACS and SPIRE photometry3 (see Hughes et al. 2014), using Eq. (4) fromKreckel et al.(2013) for a simple ge-ometry that assumes the dust is distributed in a uniform screen between the emitter and the observer, and which adopts the ob-served Milky Way ratio of visual extinction to hydrogen column density (AV/NH= 5.34 × 10⁻²²mag cm2/H), and a fixed
dust-to-gas ratio (Σdust/(NHmH) = 0.010) from theDraine & Li(2007)
model prescription (see their Table 3). The dust mass surface densities from pixels where both [O
] lines are detected result in extinctions of 5 <∼ AV <∼ 17 mag, where we note the uniform dustscreen geometry yields an upper limit to the extinction. Although the absence/weakness of a cold diffuse dust component suggests a one-component greybody (as adopted here) is most appropri-ate to derive a reasonable estimappropri-ate of the dust mass in NGC 891 (Hughes et al. 2014), using just a single thermal component to fit cases where the FIR SEDs are clearly divisible into separate ther-mal components may underestimate the dust mass by a factor of two (Bendo et al. 2014). Should this be the case for our target galaxy, the derived AV would simply shift to higher values.
The resulting AV map is then regridded to match the pixel
size of the [O
] 63 and 145 µm emission maps (400) to facilitatea pixel-by-pixel comparison between the [O
] 63/[O
]145 ratio3 In brief, we fit the six Herschel PACS and SPIRE photometric
bands with a one-component modified blackbody originally presented
byHildebrand(1983), assuming a power-law dust emissivity with κν=
0.192 m2 kg−1 at 350 µm (Draine et al. 2007) and fixing the spectral
index β= 1.8 (e.g.Galametz et al. 2012).
and the extinction (see Fig.7). For reference, we compare our observations to the predicted [O
]63/[O
]145 ratio along the line-of-sight as a function of AV (the red line in Fig.7) from theopen geometry PDR model ofAbel et al.(2007, see their Fig. 3), which represents a lower limit. We find the [O
]63/[O
]145 ra-tio tends to decrease with increasing AV, particularly evident inthe mid-plane and central (i.e. on-axis) pixels, further suggesting that optical depth effects become important for the [O
] 63 line (Abel et al. 2007). We stress that the AVderived here is a global,beam-averaged measurement that effectively probes the global ISM opacity arising not only from PDRs. Furthermore, whilst we adopt a dust screen for simplicity, in reality we expect a mix-ing of stars and dust within the disc, of which the overall dis-tribution of local star-dust geometries dictates the shape of the global SED and thus the effective AV (see e.g.Karczewski et al.
2013). However, an empirical measure of [O
] 63/[O
] 145−AVis difficult to constrain. In the absence of better constraints, we keep in mind that the central and dust lane regions likely suffer from the effects of increasing optical thickness as we proceed with our analysis.
3.4. Ionised gas characteristics
Whilst the [O
] transition arises from the neutral gas in PDRs, the high excitation potential of 35 eV required to further ionise O+means the [O
] 88 µm transition predominantly originates in low-density H
regions and diffuse ionised gas, and so the ra-tio of these lines can give some indicara-tion of the relative distribu-tions of ionised and neutral media. From our [O
]88/[O
]63 line ratio map, presented in the middle panel of Fig.6, we find that most of the disc is dominated by neutral gas. The emission from ionised gas appears to peak either side of the centre, al-though this may be due to the [O
] 63 µm line becoming in-creasingly optically thick towards the nucleus (see the previous section) and boosting the [O
]88/[O
]63 ratio. Further along the disc, however, there is a second peak where the emission arising from ionised gas is stronger relative to the neutral gas, which4 6 8 10 12 14 16 18 2 4 6 8 10 12 AV
(mag)
[O
I]63
/[O
I]145
Fig. 7.[O
]63/[O
]145 line ratio plotted as a function of the attenuation.We distinguish the median line ratio derived for pixels from different re-gions of the disc in AVbins with widths of 2 mag (open circles)
accord-ing to the colour scheme as depicted in Fig.2, and plot the correspond-ing best linear fits to the binned data (coloured dotted lines). We note the limited coverage of the [O
] 145 µm map means these colours corre-spond mainly to varying vertical height from the mid-plane of the disc. The black dashed line corresponds to the ratio that approximately di-vides the optically thin and optically thick regime as in Fig. 4 ofLiseauet al.(2006), and the red solid line demonstrates the [O
]63/[O
]145 –AV relationship predicted by the PDR model ofAbel et al.(2007, see
their Fig. 3).
coincides with the region that often demonstrates an asymmetry at numerous wavebands compared to the region diametrically opposite. Since the gas here is optically thin, we are likely inte-grating along a line-of-sight through the H
regions of a spiral arm (see Fig. 3 inKamphuis et al. 2007).We can further probe the ionized gas via the
[O
]/[N
] 122 ratio. Since the ionization potentials of N and O+ are 14.5 and 35 eV and the [N
] 122 and [O
] lines have critical densities of 310 and 510 cm−3, the ratio of thesetwo lines is relatively insensitive to the gas density. If the emission arises from H
regions4, then the ratio gives anindication of the effective stellar temperature of the ionizing source (Ferkinhoff et al. 2011) and thus can be used to constrain the stellar classification of the youngest stars in a H
region. We find that for the majority of the mapped region of NGC 891 (see Fig.6, right panel), the [O
]/[N
] 122 ratio is ∼1.0 but shows an increase in the area where the [O
] 88/[O
] 63 peaks and at larger radii. Following the method of Ferkinhoff et al. (2011) also adopted by Parkin et al.(2014), we compare our observed ratios to the model predictions. In Fig. 7 ofParkin et al.(2014), the theoretical line ratios are plotted as a function of stellar temperature for various gas densities as predicted from the H
region models ofRubin(1985). The [O
]/[N
] 122 line4 Within the narrow line region of an AGN, the [O
]/[N
] 122 ratio can also probe the strength of the ionization parameter, U, as described in e.g.Abel et al.(2009).ratios we measure across the disc correspond to a range of stellar effective temperatures of approximately 3.43 × 10⁴ and
3.65 × 10⁴K, which in turn correspond to stellar classifications of O9 to O9.5 for the most luminous stars (see Fig. 1 ofVacca et al. 1996), suggesting that young stars are present in the disc of NGC 891.
3.5. Ionised gas contribution to [CII] emission
The [C
] emission originates from both ionised and neutral gas and thus, for accurate comparison to PDR models that con-sider the emission arising purely from the neutral gas, we must take into account the fraction of [C
] emission originating from the ionised gas that we investigated in the previous section. We estimate the fraction of the [C
] emission originating from ionised gas, [C
], following the method ofOberst et al.(2006,2011) via the [C
]/[N
]205 and [N
]122/[N
]205 ra-tios. The latter ratio is a sensitive probe of the ionised gas den-sity in H
regions, with the [N
] emission arising entirely from ionised gas, due to the N ionization potential (14.5 eV) be-ing greater than that of neutral hydrogen (13.6 eV). Since the [C
] and [N
] 205 µm lines have very similar critical densi-ties for collisional excitation by electrons (46 and 44 cm−3 atTe = 8000 K, respectively), the [C
]/[N
]205 line ratios aremainly dependent on the relative abundances of C and N in the H
regions. Comparing our observed [N
]122/[N
]205 ratios to the theoretical ratio will allow us to infer the ionised gas den-sity, from which we can predict the theoretical [C
]/[N
]205 ratio arising from the ionised gas and subsequently estimate the neutral gas contribution to the [C
] emission. Adopting solar gas phase abundances of n(C+)/ne = 1.4 × 10⁻⁴ andn(N+)/ne = 7.9 × 10⁻⁵ (Savage & Sembach 1996), respective
[C
] and [N
] collision strengths fromBlum & Pradhan(1992) andHudson & Bell(2004), and Einstein coefficients for [C
] and [N
] fromGalavis et al.(1997) andGalavis et al.(1998), i.e. the same values asParkin et al.(2013), we calculate the theoret-ical [C
]/[N
]205 and [N
]122/[N
]205 ratios as a function of the ionised gas density (see Fig.8). For determining the ionised gas contribution to our observed [C
] emission, we compare these curves to our observations using two different approaches. In our first approach, we base our calculations solely on pix-els where the [N
] 205 µm line is detected (see Fig. 4). We convolve and rebin the [C
] and [N
] 122 µm maps to the res-olution (∼1700) and pixel size (1500) of the [N
] 205 µm map. From the 30 pixels with a 3σ detection of the [N
] 205 µm line, we find the [N
]122/[N
]205 ratios range from 0.7 to 2.5, from which we infer ionised gas densities ranging from 1.9 to 80 cm−3with a mean ne = 21.9 cm−3 (Fig. 8). Thus, the emission of
these lines stems from diffuse gas. We interpolate the theoreti-cal [C
]/[N
]205 line ratio in each pixel from our inferred nevalues, then compare these to our observed [C
]/[N
]205 line ratios. In the disc of NGC 891, we calculate that the fraction of the [C
] emission originating from ionised gas, [C
][N]205, varies from 0.15 up to 0.65 with a median and standard devia-tion of 0.22 and 0.15, respectively. Whilst both the number of pixels and their spatial resolution are low, providing only coarse estimates of the local ionised gas contribution to the [C
] emis-sion, our values across the disc appear consistent with previous results from a variety of astronomical sources (see e.g.Oberst et al. 2006,2011;Croxall et al. 2012;Parkin et al. 2013,2014;100 101 102 103 104 0 5 10 15 20 [CII] 158 / [NII] 205 [NII] 122 / [NII] 205
Ionised gas density
Li ne rat io −9 −8 −7 −6 −5 −4 −10.0 −9.5 −9.0 −8.5 −8.0 −7.5 −7.0 −6.5 ρPearson=0.89 ρSpearman=0.94
log
F24(W m
−2sr
−1)
log
F205(W
m
− 2sr
− 1)
Fig. 8.Left: theoretical line ratios for the [C
] 158, [N
] 122 and 205 µm transitions from diffuse ionised gas, plotted as a function of the hydrogendensity. We interpolate the ionised gas density from the observed [N
] 122/[N
] 205 ratio (blue circles following the black dashed line), which is subsequently used to determine the theoretical [C
] 158/[N
] 205 emission for comparison with the observed [C
]158/[N
]205 emission (open blue circles), and hence calculate the fraction of [C
] emission attributed to PDRs. The synthetic [N
] 122/ [N
] 205 line ratios (occupying the grey shaded region) estimated via a correlation with the MIPS 24 µm emission (see the right hand panel) are used to interpolate the ionised gas density to compare with the estimated [C
] 158/[N
] 205 ratio (open grey squares). Right: correlation between the MIPS 24 µm emission and the [N
] 205 µm emission. The best linear fit including 1σ limits are represented by the solid and dashed red lines, respectively. In both panels, each data point represents one pixel.The small number of low resolution pixels available when using the [N
] 205 µm map introduces a problematic limitation to our analysis, particularly evident when we attempt to use these results to correct our observed [C
] emission for the contribu-tion arising from ionised gas in order to facilitate a comparison with the Kaufman et al.(1999,2006) PDR model (Sect.4). To circumvent this issue, we experiment using a second approach in which we exploit a strong relationship we observe between the [N
] 205 µm line emission and the 24 µm emission. Both these emission sources have been found to correlate with SFR on global and local scales. The 24 µm emission may be used to trace the obscured star formation (e.g.Calzetti et al. 2007). In a recent study of 70 galaxies in the Herschel Spectroscopic Survey of Warm Molecular Gas in Local Luminous Infrared Galaxies,Zhao et al.(2013) found that the SFR determined from the TIR luminosity via the relationship inKennicutt & Evans(2012) cor-related with the [N
] 205 µm line luminosity. More recently,Wu et al.(2015) found a spatially-resolved correlation between the surface densities of the SFR and [N
] 205 µm line in the M 83 galaxy, and that intersection of this local relationship and the global relationship of Zhao et al.(2013) at high ΣSFRindi-cates the latter correlation is dominated by active star-forming regions. Since both the 24 µm and the [N
] 205 µm line emis-sion both seem to trace the SFR on spatially-resolved scales, one might expect to find a relationship between these two quantities that may subsequently be used to predict the [N
] 205 µm line emission from the higher resolution 24 µm images.We first convolve and regrid our 24 µm map to the resolu-tion and pixel size of the [N
] 205 µm line emission map, and in Fig.8we examine the relationship between their logarithmicfluxes on a pixel-by-pixel basis. We observe a strong correla-tion with Spearman and Pearson coefficients of rank correlation of 0.94 and 0.88, respectively, where a value of 1 represents a perfect correlation. The best linear fit to the data is given by
log F205= (0.77 ± 0.01) log F24− (3.31 ± 0.04) (3)
where both flux densities are in units of W m−2 sr−1. By ap-plying this relation to the original 24 µm map, we can there-fore estimate the [N
] 205 µm line emission for all pixels at the resolution (1200) and pixel size (400) of the [C
] 158 and [N
] 122 µm maps. We set the error bars on these flux estimates at 50%. Finally, we perform the same calculation as described above to estimate the fraction of the [C
] emission originating from ionised gas, [C
]24 µm, using flux ratios based on this
syn-thetic [N
] 205 µm line emission map. From the synthetic map, we again estimate the [N
]122/[N
]205 ratios range from 0.7 to 2.5, from which we infer ionised gas densities ranging from 1.9 to 80 cm−3with a mean ne = 21.9 cm−3(Fig.8). We thus find
similar fractional contributions as before: the fraction of [C
] emission from ionised gas varies from 0.13 to 0.61 with an av-erage and standard deviation of 0.27 and 0.07, respectively. In Fig.9, we present the maps of the fraction of the [C
] emission arising from ionised gas, [C
], estimated from our two
methods. Features in the estimated higher resolution map appear qualitatively consistent with those measured at lower resolution. We find [C


![Fig. 4. Herschel PACS and SPIRE spectroscopic maps of the most important FIR cooling lines in NGC 891: [O ] λ 63 µm (upper left), and [O ] λ 88 µm (upper middle), [N ] λ 122 µm (upper right), [O ] λ 145 µm (lower left), [C ] λ 158 µm (lower m](https://thumb-eu.123doks.com/thumbv2/123doknet/14779180.595386/8.892.66.836.114.752/herschel-pacs-spire-spectroscopic-important-cooling-lines-middle.webp)
![Fig. 5. Vertical profiles from the emission maps (S/N > 3σ) of the [C ] 158 µm, [N ] 122 and 205 µm, [O ] 63 and 145 µm, and [O ] 88 µm fine-structure lines are plotted as blue circles connected by a blue line](https://thumb-eu.123doks.com/thumbv2/123doknet/14779180.595386/9.892.63.434.114.581/vertical-profiles-emission-structure-lines-plotted-circles-connected.webp)
![Fig. 6. Maps of indicators of the interstellar gas properties: the [O ]145/[O ]63 line ratio for tracing the gas temperature (left), the [O ]88/[O ]63](https://thumb-eu.123doks.com/thumbv2/123doknet/14779180.595386/10.892.77.821.119.431/fig-maps-indicators-interstellar-properties-ratio-tracing-temperature.webp)
![Fig. 7. [O ]63/[O ]145 line ratio plotted as a function of the attenuation.](https://thumb-eu.123doks.com/thumbv2/123doknet/14779180.595386/11.892.67.432.114.485/fig-o-o-line-ratio-plotted-function-attenuation.webp)
![Fig. 8. Left: theoretical line ratios for the [C ] 158, [N ] 122 and 205 µm transitions from diffuse ionised gas, plotted as a function of the hydrogen density](https://thumb-eu.123doks.com/thumbv2/123doknet/14779180.595386/12.892.80.820.116.489/theoretical-transitions-diffuse-ionised-plotted-function-hydrogen-density.webp)
![Fig. 9. Comparison of the fraction of the [C ] emission originating from ionised gas as determined from the observed map of the [N ] 205 µm](https://thumb-eu.123doks.com/thumbv2/123doknet/14779180.595386/13.892.63.434.115.405/fig-comparison-fraction-emission-originating-ionised-determined-observed.webp)
