HAL Id: hal-01112587
https://hal.archives-ouvertes.fr/hal-01112587
Submitted on 5 Aug 2015
HAL is a multi-disciplinary open access
archive for the deposit and dissemination of
sci-entific research documents, whether they are
pub-lished or not. The documents may come from
teaching and research institutions in France or
abroad, or from public or private research centers.
L’archive ouverte pluridisciplinaire HAL, est
destinée au dépôt et à la diffusion de documents
scientifiques de niveau recherche, publiés ou non,
émanant des établissements d’enseignement et de
recherche français ou étrangers, des laboratoires
publics ou privés.
R. Jolivet, M. Simons, P. S. Agram, Z. Duputel, Z.-K. Shen
To cite this version:
R. Jolivet, M. Simons, P. S. Agram, Z. Duputel, Z.-K. Shen. Aseismic slip and seismogenic coupling
along the central San Andreas Fault. Geophysical Research Letters, American Geophysical Union,
2015, 42, pp.1-10. �10.1002/2014GL062222�. �hal-01112587�
Geophysical Research Letters
RESEARCH LETTER
10.1002/2014GL062222 Key Points:• Significant strain buildup along the SAF creeping segment
• Discreet asperities in the transition zones on the edges of the creeping segment
• Creeping segment may have a role on the initiation of past and future earthquakes
Supporting Information: • Text S1 and Figures S1–S24
Correspondence to: R. Jolivet,
Citation:
Jolivet, R., M. Simons, P. S. Agram, Z. Duputel, and Z.-K. Shen (2015), Aseismic slip and seismogenic coupling along the central San Andreas Fault, Geophys. Res. Lett., 42, doi:10.1002/2014GL062222.
Received 15 OCT 2014 Accepted 17 DEC 2014
Accepted article online 20 DEC 2014
Aseismic slip and seismogenic coupling along the central
San Andreas Fault
R. Jolivet1,2, M. Simons1, P. S. Agram3, Z. Duputel1,4, and Z.-K. Shen5
1Seismological Laboratory, Geological and Planetary Sciences, California Institute of Technology, Pasadena, California,
USA,2Now at Bullard Laboratories, Department of Earth Sciences, University of Cambridge, Cambridge, UK,3Jet
Propulsion Laboratory, California Institute of Technology, Pasadena, California, USA,4Institut de Physique du Globe de Strasbourg, UdS and EOST/CNRS UMR 7516, Strasbourg, France,5Department of Earth, Planetary, and Space Sciences,
University of California, Los Angeles, California, USA
Abstract
We use high-resolution Synthetic Aperture Radar- and GPS-derived observations of surface displacements to derive the first probabilistic estimates of fault coupling along the creeping section of the San Andreas Fault, in between the terminations of the 1857 and 1906 magnitude 7.9 earthquakes. Using a fully Bayesian approach enables unequaled resolution and allows us to infer a high probability of significant fault locking along the creeping section. The inferred discreet locked asperities are consistent with evidence for magnitude 6+ earthquakes over the past century in this area and may be associated with the initiation phase of the 1857 earthquake. As creeping segments may be related to the initiation and termination of seismic ruptures, such distribution of locked and creeping asperities highlights the central role of the creeping section on the occurrence of major earthquakes along the San Andreas Fault.1. Introduction
Modern space geodetic techniques enable explorations of the kinematics of active faults during the interseismic, coseismic, and postseismic phases of the earthquake cycle [e.g., Thatcher, 1975; Árnadóttir and
Segall, 1994]. Such exploration leads to the identification of regions where faults are locked, or coupled,
accumulating elastic strain that can drive future earthquakes [e.g., Thatcher, 1975], and those where faults are slipping aseismically during the interseismic and postseismic periods [e.g., Thatcher, 1979; Hsu et al., 2006]. In addition, mapping heterogeneities of fault slip provides insight into the physical mechanisms governing strain release in fault zones [e.g., Kaneko et al., 2010; Johnson et al., 2012]. So far, there are only few suggestions that regions of seismic and aseismic slip overlap significantly [Johnson et al., 2012;
Perfettini and Avouac, 2014], and generally, these modes of slip appear mutually exclusive [e.g., Hsu et al.,
2006; Baba et al., 2006; Murray and Langbein, 2006]. Unfortunately, quantifying such statements has been difficult as they depend on the error models assumed and the spatial smoothing usually imposed when inferring subsurface fault slip. As a consequence, it is difficult to assess whether differences between published models of interseismic fault coupling and slip during earthquakes or postseismic periods derives from the use of different data sets or from choices made while modeling. Here without imposing unphysical constraints on our model, we infer probabilistic estimates of interseismic coupling along the San Andreas Fault (SAF), to quantify spatial variations in apparent seismogenic potential.
The SAF accommodates most of the northward motion of the Pacific Plate along the North American continent [Savage and Burford, 1973]. Extending from the Sea of Cortez in the south to the Mendocino Triple Junction in the north, the SAF produced the two largest earthquakes in recent history in the western United States: the M7.9, Fort Tejon earthquake in 1857 [Sieh, 1978a] and the M7.9, San Francisco [e.g., Wald et al., 1993] earthquake in 1906 (Figure 1). We focus on the section of the central SAF system delimited by the 1857 and 1906 earthquakes, where the SAF is known to slip aseismically [Steinbrugge et al., 1960; Titus et al., 2006]. Along this 150 km long section, the SAF accommodates 36 ± 1 mm/yr of right-lateral motion [Meade, 2005], most of it being released by aseismic slip with significant along-strike variations [Titus et al., 2006]. Despite large disparities between published models, a fraction of the relative plate motion apparently accumulates as elastic strain [Titus et al., 2006; Ryder and Bürgmann, 2008; Maurer and Johnson, 2014], consistent with the occurrence of moderate sized earthquakes (M≥ 6) in the past 200 years, even though no major earthquake (M≥ 7) has ever been reported [Toppozada et al., 2002].
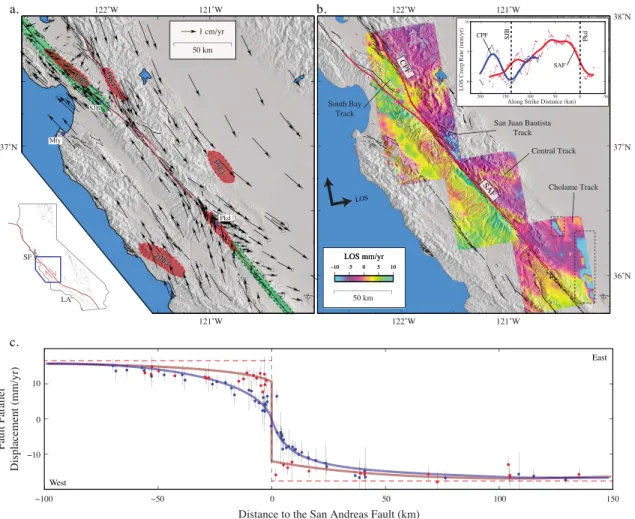
Figure 1. (a) Tectonic setting and observed GPS displacement rates along the central San Andreas Fault (SAF) and Calaveras-Paicines Fault (CPF) system. Black arrows are GPS-derived secular velocities with their associated 1𝜎error ellipse. Green-shaded areas indicate the southern and northern extent of the 1906M7.9 San Francisco and 1857M7.9 Fort Tejon earthquakes, respectively. Red-shaded areas indicate the approximate rupture area of instrumentally recordedM6+ earth-quakes in the region including the 1983M6.3 Coalinga, 1984M6.2 Morgan Hill, 1989M6.9 Loma Prieta, 2003M6.6 San Simeon, and 1966 and 2004M6.0 Parkfield earthquakes. Black lines indicate quaternary active faults. Red lines are the surface projection of our fault model. Background shading is from Farr and Kobrick [2000]. Mty: Monterey. SJB: San Juan Bautista. Pkd: Parkfield. Bottom left: Map of the state of California with the SAF system indicated in red. (b) Interferometric Synthetic Aperture Radar- (InSAR) derived Line-Of-Sight (LOS) velocity maps along the SAF system. LOS ground velocity is derived from Advanced Land Observa-tion Satellite (ALOS) Synthetic Aperture Radar data. A positive rate of range change (yellow to green colors) indicates moObserva-tion toward the satellite. Areas enclosed in dashed rectangles are affected by strong subsidence associated with oil pumping, hence not included in our model. Inset: Along-strike variation of the creep rate measured on the InSAR velocity maps. Red and blue dots indicate rates measured using a 5 km wide, 40 km long profile perpendicular to the SAF and CPF, respectively. Red and blue lines are the same measurements, smoothed by a 10 km Gaussian filter. (c) Fault-parallel GPS-derived velocities along two profiles per-pendicular to the SAF centered on the fast creeping section (red) and on the southernmost section of the SAF (blue). See supporting information for the location of these profiles. Red dashed lines indicate 36 mm/yr of right-lateral strike-slip displacement, highlighting the elastic strain buildup rate across both creeping and locked sections. Red and blue continuous lines indicate the average prediction of ground motion from the model presented in Figure 2.
Mapping the spatial extent of creeping segments is key to understand the segmentation of active faults and their seismic potential [Kaneko et al., 2010]. Such mapping identifies locked and creeping patches along faults and quantifies the rate of elastic strain accumulation. In addition, although the question of strain increase along the creeping section dates from the earliest measurements of interseismic slip along the SAF [Allen, 1968; Thatcher, 1979; Savage and Burford, 1973], quantitative assessments of uncertainties on the slip deficit inferred from geodetic data are still missing. Here, we use a Bayesian approach to derive the Probability Density Function (PDF) of slip during the interseismic period.
2. Space-Based Geodetic Observations of Ground Displacement Rate
To assess the extent of fault coupling, we use a dense geodetic velocity field including 293 GPS-derived displacement rates and four satellite line-of-sight (LOS) Interferometric Synthetic Aperture Radar (InSAR)
Geophysical Research Letters
10.1002/2014GL062222
velocity maps derived from Advanced Land Observation Satellite (JAXA) data covering the 2006–2010 period (Figure 1).
The GPS-derived velocities are a subset of the Unified Western U.S. Crustal Motion Map [Shen et al., 2013]. GPS data have been collected from 3700+ campaign sites and 1300+ continuous sites over the 1993–2011 period from Unavco, Southern California Earthquake Center (SCEC), Northern California Earthquake Data Center (NCEDC), and United States Geological Survey (USGS) data centers. Daily solutions are produced using the GAMIT software (version 10.4). These daily solutions are then aggregated using the QOCA software to extract secular velocities, referenced into the International Terrestrial Reference Frame 2008 (ITRF2008). In this study, we only use the horizontal component of the velocity at stations in the vicinity of the SAF and Calaveras-Paicines Fault (CPF) systems, near the creeping section.
We process four sets of InSAR data acquired by the Phased Array type L-band Synthetic Aperture Radar (PALSAR) onboard the Advanced Land Observation Satellite (ALOS, JAXA) on three different ascending tracks over the 2006–2010 period. Data have been computed using the MoComp [Zebker et al., 2010] synthetic aperture radar processing tool to derive 59, 59, 48, and 30 interferograms out of 15, 16, 14, and 14 acquisitions on tracks and frames 218–690, 219–700, 221–720, and 221–730, respectively (referred to as Central Track, Cholame Track, San Juan Bautista Track, and South Bay Track; see supporting information for plots of interferometric perpendicular baselines). Individual interferograms have been corrected for stratified tropospheric delays using the empirical relationship between phase and elevation determined using multiple spatial wavelengths [Lin et al., 2010b].
We compute the satellite line of sight average velocity using the Multiscale Interferometric Time Series method [Hetland et al., 2012]. We first convert the interferograms to the wavelet domain, using 2-D Meyer wavelets. We then invert for the best linear function of time on each wavelet, independently, using a Thikonov regularization scheme and choosing the damping factor by cross validation on each wavelet. We then transform the result back into the spatial domain to build a LOS ground velocity map. The final pixel size of our LOS velocity maps is approximately 150 m.
The InSAR- and GPS-derived velocity fields are broadly consistent with previous descriptions of the creeping section [Tong et al., 2013], with smooth strain gradients observed across the SAF south of Parkfield and north of San Juan Bautista, suggesting the seismogenic portion of the fault is locked (Figure 1). Creep rate varia-tions along the surface trace of the SAF indicate maximum aseismic slip rates (approximately 7 mm/yr LOS) are observed along a 50–70 km long section just north of Parkfield. Transition zones are identified on both ends of this fast creeping section: a short one (∼ 20 km long) centered on Parkfield and a long one (∼ 80 km long) ending below the city of San Juan Bautista. Creep is also observed along the Calaveras-Paicines Fault (CPF). This section connects to the creeping Hayward Fault farther north [Lienkaemper et al., 2012], leading to a 400 km long, almost continuously creeping fault system, from the Rogers Creek Fault in the north [Funning et al., 2007] to Parkfield in the south.
3. Sampling the Posterior PDF of Interseismic Creep Along the Central SAF
We model the GPS- and InSAR-derived velocity fields assuming four principle contributions. First, shallow creep is modeled by slip on the shallow portions of the SAF and CPF. The shallow portion of these two faults is discretized into rectangular patches whose size vary from 4 km long at the surface to 25 km long at 20 km depth. Second, interseismic loading (i.e., far-field displacement) is modeled by slip in the along-strike direc-tion along infinitely deep vertical dislocadirec-tions. Third, we estimate a transladirec-tion and a rotadirec-tion term for the entire GPS data set to account for possible reference frame inaccuracies. In addition, to account for inter-nal volumetric deformation, we estimate a 2-D areal strain tensor for each of three blocks, including the southern San Francisco Bay, the Great Valley, and the Pacific Plate block, delimited by the main faults in our study (see supporting information for limits of the blocks). Fourth, we estimate a linear function of range and azimuth for each InSAR velocity map to account for residual orbital errors. We write the problem as d = Gm, where d is a vector containing the downsampled InSAR data and the horizontal components of the GPS-derived velocities, m is a vector containing the model parameters just described, and G is the matrix containing the response to slip on the faults at the data points and the geometric transformations in InSAR and GPS data.
We predict the response to subsurface fault slip at each data (GPS and InSAR) location assuming a stratified semi-infinite elastic medium [Simons et al., 2002; Zhu and Rivera, 2002]. Our layered elastic space consists of 10 elastic layers with elastic properties following roughly the average properties of the crust in the region. We consider P and S waves velocities from a regional three-dimensional velocity model derived from absolute arrival time and double difference tomography (see supporting information and Lin et al. [2010a]). The density structure is derived from Christensen and Mooney [1995].
For practical computational reasons, one needs to downsample the satellite LOS velocity maps before using these data to derive the slip probability density functions. In order to maximize the resolution of our model, we use a quad tree downsampling method driven by the resolution operator in the data space [Lohman and
Simons, 2005]. As patches of the top row of our fault geometry are 1 km wide downdip, we exclude pixels
that are less than 500 m away from the fault trace. The downsampling leads to a total of 1260 InSAR data points, as compared with 1.4 × 10⁶observations in the original velocity maps (see supporting information).
The final position of each data point is a weighted average of the position of the coherent pixels in each downsampling window.
We solve the inverse problem to infer the distribution of model parameters m consistent with our data d. As our model includes a large number of parameters (>800), the solution to this inverse problem is nonunique and large uncertainties on the parameters are expected. Therefore, instead of deriving a single model, we explore the space of solutions following a Bayesian approach to derive the posterior PDF of our model given our set of data, p(m|d) [e.g., Minson et al., 2013]. We are thus able to derive a probabilistic estimate of slip, slip deficit, and degree of fault locking along the San Andreas Fault system. We sample the posterior PDF by generating large number of samples (>100,000) following Bayes’s rule:
p(m|d) ∝ p(m)exp[−1 2(d − Gm) TC−1 𝜒 (d − Gm) ] , (1)
where p(m) is the prior PDF of the model, d, G, and m are the data vector, Green’s functions matrix, and model vector described previously, and C𝜒is the misfit covariance matrix, defined as the sum of the data covariance matrix, Cd, (i.e., measurement error matrix) and the prediction error matrix, Cp.
The prior PDF, p(m), describes the knowledge we have on the model before considering the data. Prior PDFs on the along-strike component of slip are one-sided uniform PDFs between 0 and 40 mm/yr. Prior PDFs on the along-dip component of slip on the shallow portions of the SAF and CPF are zero-mean Gaussian functions with a 10 mm/yr standard deviation. In this way, we enforce slip on the shallow portion of the SAF and CPF to be left-lateral with a slight variation in rake allowed. Prior PDFs on the nuisance parameters for InSAR and GPS data are broad uniform distributions.
We explore the space of potential models allowed by the data without the use of any form of unphysical regularization or smoothing in the model space [Minson et al., 2013]. We include a description of the mea-surement noise in our data, Cd. For each InSAR-derived velocity map, we estimate the empirical covariance
function describing the amplitude and structure of the remaining atmospheric noise [Jolivet et al., 2012, 2014]. These functions are then used to build the data covariance matrix, Cd(see supporting information).
We also include an estimate of the prediction error, Cp, that encapsulates the inadequacies in our elastic
model for the crust [Duputel et al., 2014]. Using this method, we derive from our observations and associated errors (i.e., from measurement and prediction) the posterior PDF of the model, including slip on the shal-low portion of the SAF and CPF, slip on the deep roots of these two faults, and internal strain rate tensors in three blocks. We note that ignoring the prediction error, as has been done in the past, leads to biased results and overoptimistic uncertainties on the estimated distributions of slip on the SAF and CPF (see supporting information).
To sample the PDFs of this high-dimensional problem, we use AlTar, the most recent implementation of CATMIP (Cascading Adaptive Transitional Metropolis in Parallel [Minson et al., 2013]), a massively parallel Bayesian sampler allowing a progressive transition from prior to posterior distributions by slowly increasing the influence of the data. This new implementation now takes advantage of the high-performance computing capabilities of Graphic Processing Units (GPUs) on a Beowulf-type cluster and allows for sam-pling PDFs in high-dimensional space. The slip distribution corresponding to the mode of the posterior PDF is shown in Figure 2 and Figure S8 in the supporting information. Corresponding data residuals are shown in Figures S6 and S7 in the supporting information.
Geophysical Research Letters
10.1002/2014GL062222
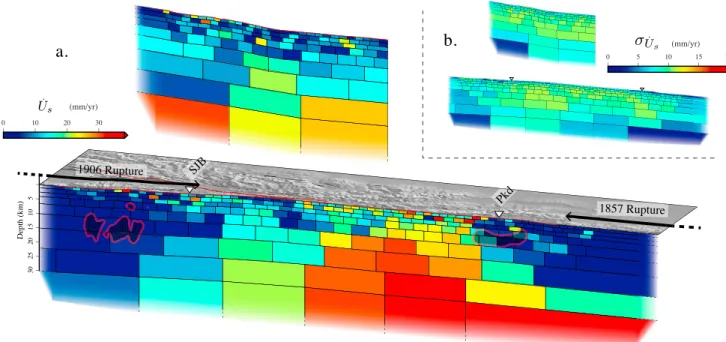
Figure 2. (a) Three-dimensional view of the San Andreas and Calaveras Faults at depth. Colors indicate the mode of the posterior PDF of the slip in the along-strike direction (̇Us). Patches that fade at the extremities extend to infinity. Grey-shaded areas indicate the approximate rupture contours for the 2004M6.0 Parkfield and 1989M6.9 Loma Prieta [Beroza, 1991] earthquakes. Red and black lines at the surface are similar to Figure 1. Dark arrows indicate the southern and northern extent of the 1906M7.9 San Francisco and 1857M7.9 Fort Tejon earthquakes, respectively. Inverted triangles indicate the location of the cities of Parkfield (Pkd) and San Juan Bautista (SJB). (b) Distribution of standard deviation of the along-strike component of slip (𝜎̇U
s) from the posterior PDF. Note that uncertainties shown here range from 5 to 10 mm/yr but significant posterior correlations between slip parameters are not portrayed in this figure.
4. The Distribution of Creep Along the Central SAF
The posterior models indicate a variable distribution of aseismic slip for the shallowest part of the model, while slip on the deepest portion is relatively uniform along strike (Figure 2). Fault slip on the deepest portion of the model, corresponding to the tectonic loading rate, ranges from 36 ± 2 mm/yr to the south underneath the Cholame plain, to 42 ± 6 mm/yr on the combined deep portions of the SAF (16 ± 4 mm/yr) and CPF (26 ± 4 mm/yr), north of San Juan Bautista. Because these two sections of the fault are subparallel, slip rates estimated on the two corresponding deep portions show a slight anticorrelation while slip on the CPF appears systematically higher (see supporting information). Although these values are on the high side of previous estimates in the southern San Francisco bay, posterior PDFs indicate that slower rates are possible and additional complexity in the fault structure may be mapped onto the fast CPF slip rate [Evans
et al., 2012].
The posterior model indicates large internal strains (50–100 nstrains) in the southern San Francisco Bay, consistent with observed movements related to hydrological effects [Chaussard et al., 2014]. Internal strain rates in the Great Valley are low (0–5 nstrain), while the Pacific Plate block experiences shortening in the direction perpendicular to the SAF (see supporting information). Such shortening is consistent with the presence of quaternary active structures, including the Rinconada Fault Zone, and with the orientation of compressional axis of stress tensors around the SAF [Zoback et al., 1987; Feigl et al., 1990] .
On the shallow portion of the SAF, south of Parkfield and north of San Juan Bautista, the historically seismo-genic part of the fault appears locked. In between, we observe a 50–70 km long segment with fast creep rates (25–30 mm/yr) in between two transition zones: a short one centered on Parkfield and a longer one, south of San Juan Bautista, where the CPF branches out of the SAF (Figure 3). These transition zones are characterized by intense microseismic activity (Figure 3) and the presence of small locked regions, including the Parkfield locked asperity to the south and two patches to the north (indicated with question marks in Figure 4). Such transition segments can be interpreted as a gradual change in the mechanical properties of the fault zone, from a rheology favoring aseismic behavior, along the 50–70 km long fast creeping region, to a rheology favoring a stick-slip behavior along the sections that generated the 1857 and 1906 earthquakes.
Figure 3. Distribution of aseismic slip at depth and microseismicity. (a) Distribution of aseismic slip (left) along depth below San Juan Bautista (SJB), (middle) averaged over the fast creeping section, and (right) over the northern end of the 1857M7.9 Fort Tejon rupture. In each plot, the thick line indicates the mode of the posterior marginal PDF while shading indicates the associated 1𝜎uncertainty. Shaded line is the extrapolation to the surface of the mode of the posterior PDF of slip at depth. (b) Distribution of aseismic slip along strike at a depth of 8 km. Red line indicates the mode of the posterior PDF of the along strike component of slip, and the shaded area indicates the associated 1𝜎uncertainty. Dark bars are a histogram count of microearthquakes along strike. We only consider relocated hypocenters that are less than 2 km away from the mapped fault during the 2006 to 2010 period [Waldhauser, 2009].
The region of fastest creep rates is spatially coincident with a body of low-friction, talc-bearing serpentinites that abut the fault at depths greater than 3 km [Moore and Rymer, 2007]. In general, creep along the plate boundary, including the Hayward and Rogers Creek Faults to the north, extends along sections separating marine sediments of the Great Valley sequence and Coast Range ophiolites from other various assemblages [Irwin and Barnes, 1975]. Such coincidence reinforces the correlation between the presence of low-friction minerals and occurrences of creep along active faults.
The depth distribution of aseismic slip also shows variations along strike (Figure 3). The northern end of the 1857 rupture area is locked with an apparent slip deficit building up at a rate of 30 ± 5 mm/yr. Along the creeping section, a significant amount of strain, equivalent to a deficit of slip of 10 ± 5 mm/yr, accumulates across the fault at depths shallower than 10 km. Below San Juan Bautista, shallow creep at intermediate rates (10–15 mm/yr) is observed between the surface and 5 km depth, while the deeper section (5–15 km depth) appears more coupled with the penetration of a locked section in the transition creeping zone. Such complexity may be interpreted as the southern tip of one of the asperities that ruptured during the 1906 San Francisco earthquake [Wald et al., 1993].
Geophysical Research Letters
10.1002/2014GL062222
Figure 4. Seismic and aseismic asperities along the central SAF. Color represents the mode of the posterior PDF of slip in the along-strike direction (̇Us). Semi-transparent areas marked with red dashed lines correspond to asperities where significant earthquakes are known to have occurred, including the 1857M7.9 Fort Tejon, 1906M7.9 San Francisco, and 1966 and 2004M6.0 Parkfield earthquakes. White transparent areas with question marks are zones that are inferred to be strongly coupled and potential sources for future earthquakes.
5. Discussion
The unregularized Bayesian approach adopted here allows us to derive the PDF of the slip distribution using the information content from geodetic data that transforms our prior probability of slip (uniform between 0 and 40 mm/yr) to a final probability. Effectively, a lack of constraining information on the slip along a given region is characterized by little difference between the prior and posterior PDFs. In addition, this approach significantly differs from previous methods as the final PDF does not depend on other prior information on the model (e.g., assumption on model smoothness).
Using this method, we can answer simple questions regarding physical quantities derived from the posterior PDFs. For instance, fault coupling (i.e., the ratio between aseismic slip and seismogenic loading rate) varies from 0 (i.e., shallow slip rate matches deep slip rate or tectonic loading rate) to 1 (i.e., the shallow portion of the fault is locked). From the posterior PDFs of slip along the deep and shallow portions of the SAF, we derive the PDFs of the equivalent slip deficit accumulation rate (see supporting information) and the corresponding PDFs of fault coupling along a few selected sections of the fault (Figure 4). First, we consider the fault sections that ruptured during significant (M > 6) historical earthquakes, including the 1906 and 1857 M7.9 earthquakes and the M6 Parkfield earthquakes. Second, we consider regions where the fastest creep rates are inferred between the surface and a depth of 10 km. Third, we consider the two apparently locked asperities located within the northern transition zone. We represent in Figure 4 the cumulative PDF of fault coupling for these regions (i.e., the curves indicate the probability that fault coupling is lower than the value along the x axis).
We infer a 75% probability that fault coupling exceeds 0.8 along the northern end of the 1857 rupture, confirming previous estimates of high coupling [Ryder and Bürgmann, 2008; Maurer and Johnson, 2014].
In contrast, the shape of the cumulative distribution function of coupling along the 1906 section suggests a wide range of probable values, not far from the initial prior distributions (i.e., uniform probability of coupling). This equivalence of prior and posterior distributions suggests the data are not informative enough to derive fault coupling along this limited section of the model.
Along the fast creeping section, we infer a 68% probability that fault coupling is lower than 0.4, confirming previous high slip rate estimates. However, there is a 50% chance that the rate of accumulation of elastic strain is higher than an equivalent slip rate deficit of 1 cm/yr. For both small coupled regions to the north, coupling has a 70% chance of being higher than 0.5; hence, there is a 70% probability that more than 12 mm/yr of equivalent slip deficit accumulates there. Because of the proximity between the SAF and the CPF in the vicinity of the northernmost of these asperity (called Northern Asperity in Figure 4), a concern is the possible trade-off between shallow slip on these two fault planes. The posterior PDFs of slip on both faults suggest that the degree of coupling along the SAF at this particular location is independent of the slip rate on the CPF patches directly facing this Northern Asperity and high fault coupling is required there by the InSAR-derived velocity field (see supporting information).
In summary, there is a high probability of significant strain (approximately 1 cm/yr) accumulating in overall along the creeping section with three locked patches inside the transition zones, two to the north and one below Parkfield.
As discussed in previous studies [e.g., Titus et al., 2006], Geodesy alone cannot help addressing the issue whether the apparent remaining strain along the creeping section accumulates elastically or is accommo-dated by permanent deformations in the crust surrounding the fault. We here assume that most of the apparent strain accumulates as elastic strain to be released by slip on the SAF and CPF.
The inferred elastic strain buildup along the creeping section may be eventually accommodated by periods of faster creep or, alternatively, by seismic events of significant magnitudes. Recent modeling suggests the possibility for a major rupture to break through a creeping segment, enabled by the dynamic weakening of the frictional resistance of faults, leading to unexpectedly large earthquakes [Noda and Lapusta, 2013]. Therefore, such mechanism combined with the inferred significant elastic strain buildup challenges the idea that the creeping section is necessarily a strong barrier to the propagation of earthquakes.
However, so far, no significant (M7+) earthquakes have been instrumentally recorded or inferred from geologic records along that section of the SAF. Moderate events in the region have been documented over the past 200 years, although their epicenters are not precisely located [Toppozada et al., 2002]. In particular, a swarm of foreshocks was felt during the days before the 1857, M7.9, Fort Tejon earthquake [Sieh, 1978a]. The three biggest foreshocks have been attributed to seismic ruptures with significant magnitudes (M> 5.5) [Sieh, 1978b; Meltzner and Wald, 1999]. The southernmost foreshock is interpreted as being part of the sequence of repeating M6+ events at Parkfield. However, the two other ones are inferred to be located farther north along the creeping section and possibly along the northern transition zone [Sieh, 1978b;
Meltzner and Wald, 1999]. Assuming a temporal stationarity of the distribution of fault coupling over
hundreds of years, the three small coupled regions we identify could be responsible for these foreshocks. These three earthquakes were distributed on a long portion of the SAF, at each end of the creeping section. While their epicenters are quite distant from each other, their temporal proximity suggests a common driving process. Recent observations of the initiation phase of large earthquakes indicate foreshocks may be the seismic manifestation of an increase in underlying aseismic slip rate leading to the main shock [Bouchon
et al., 2011; Brodsky and Lay, 2014]. In this respect, the 1857 foreshocks may have been driven by an increase
in aseismic slip rates along the whole creeping section releasing a significant fraction of the elastic strain.
6. Conclusion
We derive a high-resolution velocity field from InSAR and GPS data around the central SAF section and explore the range of possible models of interseismic fault slip allowed by these data. Using a careful descrip-tion of the noise content of our data and including the effect of uncertainties on the elastic stratificadescrip-tion on the forward model, we derive the posterior probability density function of slip along the creeping segment of the SAF. As we do not use any form of unphysical regularization, the inferred distribution of creep depends only on the prior knowledge of the slip parameters, the parameterization of the model, and the data we use as input.
Geophysical Research Letters
10.1002/2014GL062222
Our model suggests creep rates are highest along a 50 to 70 km long section of the SAF, separated from the locked sections to the north and to the south by transition zones characterized by a heterogeneous degree of locking. We infer a high probability for significant elastic strain buildup (∼ 1 cm/yr) along the creeping section. In addition, we find a high probability of significant coupling on several asperities on the edges of the creeping segment, including the well-known Parkfield asperity and two newly inferred asperities to the north. We suggest that these asperities may correspond to the foreshocks of the 1857 M7.9 Fort Tejon earthquake. The significant strain buildup along the creeping section, the presence of transition zones with locked asperities on the edges of the fastest creeping region, and the possible implication of creep in the initiation of the 1857 earthquake underscores the importance of the creeping segment on the past and future seismic behavior of the San Andreas Fault.
References
Allen, C. R. (1968), The tectonic environments of seismically active areas along the San Andreas Fault system, in Proceedings of Conference
on Geologic Problems of San Andreas Fault System, vol. 11, edited by W. R. Dickinson and A. Grantz, pp. 70–82, Stanf. Univ. Pub. in the
Geological Sciences, Stanford, Calif.
Árnadóttir, T., and P. Segall (1994), The 1989 Loma Prieta earthquake imaged from inversion of geodetic data, J. Geophys. Res., 99(B11), 21,835–21,855, doi:10.1029/94JB01256.
Baba, T., K. Hirata, T. Hori, and H. Sakaguchi (2006), Offshore geodetic data conducive to the estimation of the afterslip distribution following the 2003 Tokachi-oki earthquake, Earth Planet. Sci. Lett., 241(1-2), 281–292, doi:10.1016/j.epsl.2005.10.019.
Barbot, S., N. Lapusta, and J.-P. Avouac (2012), Under the hood of the earthquake machine: Toward predictive modeling of the seismic cycle, Science, 336(6082), 707–710, doi:10.1126/science.1218796.
Beroza, G. C. (1991), Near-source modeling of the Loma Prieta earthquake: Evidence for heterogeneous slip and implications for earthquake hazard, Bull. Seismol. Soc. Am., 81(5), 1603–1621.
Bouchon, M., H. Karabulut, M. Aktar, S. Ozalaybey, J. Schmittbuhl, and M. P. Bouin (2011), Extended nucleation of the 1999 Mw 7.6 Izmit earthquake, Science, 331(6019), 877–880, doi:10.1126/science.1197341.
Brodsky, E. E., and T. Lay (2014), Recognizing foreshocks from the 1 April 2014 Chile earthquake, Science, 344(6185), 700–702. Chaussard, E., R. Burgmann, M. Shirzaei, E. J. Fielding, and B. Baker (2014), Predictability of hydraulic head changes and characterization
of aquifer-system and fault properties from InSAR-derived ground deformation, J. Geophys. Res. Solid Earth, 119, 6572–6590, doi:10.1002/2014JB011266.
Christensen, N. I., and W. D. Mooney (1995), Seismic velocity structure and composition of the continental crust: A global view,
J. Geophys. Res., 100(B6), 9761–9788.
Duputel, Z., P. S. Agram, M. Simons, S. E. Minson, and J. L. Beck (2014), Accounting for prediction uncertainty when inferring subsurface fault slip, Geophys. J. Int., 197(1), 464–482, doi:10.1093/gji/ggt517.
Evans, E. L., J. P. Loveless, and B. J. Meade (2012), Geodetic constraints on San Francisco Bay Area fault slip rates and potential seismogenic asperities on the partially creeping Hayward fault, J. Geophys. Res., 117, B03410, doi:10.1029/2011JB008398. Farr, T. G., and M. Kobrick (2000), Shuttle radar topography mission produces a wealth of data, Eos Trans. AGU, 81(48), 583–585. Feigl, K. L., R. W. King, and T. H. Jordan (1990), Geodetic measurement of tectonic deformation in the Santa Maria Fold and Thrust Belt,
California, J. Geophys. Res., 95(B3), 2679–2699.
Funning, G. J., R. Bürgmann, A. Ferretti, F. Novali, and A. Fumagalli (2007), Creep on the Rodgers Creek Fault, northern San Francisco Bay area from a 10 year PS-InSAR dataset, Geophys. Res. Lett., 34, L19306, doi:10.1029/2007GL030836.
Hetland, E. A., P. Musé, M. Simons, Y. N. Lin, P. S. Agram, and C. J. DiCaprio (2012), Multiscale InSAR Time Series (MInTS) analysis of surface deformation, J. Geophys. Res., 117, B02404, doi:10.1029/2011JB008731.
Hsu, Y.-J., M. Simons, J. P. Avouac, J. Galetzka, K. Sieh, M. Chlieh, D. Natawidjaja, L. Prawirodirdjo, and Y. Bock (2006), Frictional afterslip following the 2005 Nias-Simeulue earthquake, Sumatra, Science, 312(5782), 1921–1925, doi:10.1126/science.1126960.
Irwin, W. P., and I. Barnes (1975), Effect of geologic structure and metamorphic fluids on seismic behavior of the San Andreas Fault system in central and Northern California, Geology, 3(12), 713–716.
Johnson, K. M., J. Fukuda, and P. Segall (2012), Challenging the rate-state asperity model: Afterslip following the 2011 M9 Tohoku-oki, Japan, earthquake, Geophys. Res. Lett., 39, L20302, doi:10.1029/2012GL052901.
Jolivet, R., C. Lasserre, M. P. Doin, S. Guillaso, G. Peltzer, R. Dailu, J. Sun, Z. K. Shen, and X. Xu (2012), Shallow creep on the Haiyuan Fault (Gansu, China) revealed by SAR Interferometry, J. Geophys. Res., 117, B06401, doi:10.1029/2011JB008732.
Jolivet, R., et al. (2014), The 2013 Mw 7.7 Balochistan earthquake: Seismic potential of an accretionary wedge, Bull. Seismol. Soc. Am.,
104(2), 1020–1030, doi:10.1785/0120130313.
Kaneko, Y., J.-P. Avouac, and N. Lapusta (2010), Towards inferring earthquake patterns from geodetic observations of interseismic coupling, Nat. Geosci., 3(5), 363–369, doi:10.1038/ngeo843.
Lienkaemper, J. J., F. S. McFarland, R. W. Simpson, R. G. Bilham, D. A. Ponce, J. J. Boatwright, and S. J. Caskey (2012), Long term creep rates on the Hayward Fault: Evidence for controls on the size and frequency of large earthquakes, Bull. Seismol. Soc. Am., 102(1), 31–41, doi:10.1785/0120110033.
Lin, G., C. H. Thurber, H. Zhang, E. Hauksson, P. M. Shearer, F. Waldhauser, T. M. Brocher, and J. Hardebeck (2010a), A California statewide three-dimensional seismic velocity model from both absolute and differential times, Bull. Seismol. Soc. Am., 100(1), 225–240, doi:10.1785/0120090028.
Lin, Y.-n. N., M. Simons, E. A. Hetland, P. Muse, and C. DiCaprio (2010b), A multiscale approach to estimating topographically correlated propagation delays in radar interferograms, Geochem. Geophys. Geosyst., 11, Q09002, doi:10.1029/2010GC003228.
Lohman, R. B., and M. Simons (2005), Some thoughts on the use of InSAR data to constrain models of surface deformation: Noise structure and data downsampling, Geochem. Geophys. Geosyst., 6, Q01007, doi:10.1029/2004GC000841.
Maurer, J., and K. Johnson (2014), Fault coupling and potential for earthquakes on the creeping section of the central San Andreas Fault,
J. Geophys. Res. Solid Earth, 119, 4414–4428, doi:10.1002/2013JB010741.
Meade, B. J. (2005), Block models of crustal motion in Southern California constrained by GPS measurements, J. Geophys. Res., 110, B03403, doi:10.1029/2004JB003209.
Acknowledgments
Advanced Land Observing Satellite (ALOS) data were acquired by the Japanese space agency (JAXA) and provided by the Alaska SAR Facility (ASF). This study was funded by National Science Foundation grant EAR-1118239 and United States Geological Survey grant G11AP20044. This research was supported by the Southern California Earthquake Center. SCEC is funded by NSF cooperative agreement EAR-1033462 and USGS Cooperative Agreement G12AC20038. The SCEC contribution for this paper is 1975. This study contributed from fruitful discussions with H. Kanamori, T. Heaton, J. Stock, K. Scharer, L. Rivera, S. Minson, M. Aivazis, and H. Zhang. We thank the Editor and two anonymous reviewers for providing insightful comments that helped improve this manuscript.
The Editor thanks two anonymous reviewers for their assistance in evaluating this paper.
Meltzner, A. J., and D. J. Wald (1999), Foreshocks and aftershocks of the great 1857 California earthquake, Bull. Seismol. Soc. Am., 89(4), 1109–1120.
Minson, S. E., M. Simons, and J. L. Beck (2013), Bayesian inversion for finite fault earthquake source models I—Theory and algorithm,
Geophys. J. Int., 194(3), 1701–1726, doi:10.1093/gji/ggt180.
Moore, D. E., and M. J. Rymer (2007), Talc-bearing serpentinite and the creeping section of the San Andreas Fault, Nature, 448(7155), 795–797, doi:10.1038/nature06064.
Murray, J., and J. Langbein (2006), Slip on the San Andreas fault at Parkfield, California, over two earthquake cycles, and the implications for seismic hazard, Bull. Seismol. Soc. Am., 96(4B), S283–S303, doi:10.1785/0120050820.
Noda, H., and N. Lapusta (2013), Stable creeping fault segments can become destructive as a result of dynamic weakening, Nature, 493, 518–521, doi:10.1038/nature11703.
Perfettini, H., and J. P. Avouac (2014), The seismic cycle in the area of the 2011 Mw9.0 Tohoku-Oki earthquake, J. Geophys. Res. Solid Earth,
119, 4469–4515, doi:10.1002/2013JB010697.
Ryder, I., and R. Bürgmann (2008), Spatial variations in slip deficit on the central San Andreas Fault from InSAR, Geophys. J. Int., 175(3), 837–852, doi:10.1111/j.1365-246X.2008.03938.x.
Savage, J. C., and R. O. Burford (1973), Geodetic determination of relative plate motion in central California, J. Geophys. Res., 78(5), 832–845, doi:10.1029/JB078i005p00832.
Shen, Z.-K., M. Wang, and Y. Zeng (2013), A reprocessed GPS velocity field for the Western US, in SCEC Community Geodetic Model
Workshop, Dept of Earth and Space Sciences, UCLA, Menlo Park, Calif.
Sieh, K. E. (1978a), Slip along the San Andreas Fault associated with the great 1857 earthquake, Bull. Seismol. Soc. Am., 68(5), 1421–1448. Sieh, K. E. (1978b), Central California foreshocks of the great 1857 earthquake, Bull. Seismol. Soc. Am., 68(6), 1731–1749.
Simons, M., Y. Fialko, and L. Rivera (2002), Coseismic deformation from the 1999 Mw 7.1 Hector Mine, California, earthquake as inferred from InSAR and GPS observations, Bull. Seismol. Soc. Am., 92(4), 1390–1402.
Steinbrugge, K. V., E. G. Zacher, D. Tocher, C. A. Whitten, and C. N. Claire (1960), Creep on the San Andreas Fault, Bull. Seismol. Soc. Am.,
50(3), 389–415.
Thatcher, W. (1975), Strain accumulation and release mechanism of the 1906 San Francisco earthquake, J. Geophys. Res., 80(35), 4862–4872, doi:10.1029/JB080i035p04862.
Thatcher, W. (1979), Systematic inversion of geodetic data in central California, J. Geophys. Res., 84(B5), 2283–2295, doi:10.1029/JB084iB05p02283.
Titus, S. J., C. DeMets, and B. Tikoff (2006), Thirty-five-year creep rates for the creeping segment of the San Andreas Fault and the effects of the 2004 Parkfield earthquake: Constraints from alignment arrays, continuous global positioning system, and creepmeters, Bull.
Seismol. Soc. Am., 96(4B), S250–S268, doi:10.1785/0120050811.
Tong, X., D. T. Sandwell, and B. Smith-Konter (2013), High-resolution interseismic velocity data along the San Andreas Fault from GPS and InSAR, J. Geophys. Res. Solid Earth, 118, 369–389, doi:10.1029/2012JB009442.
Toppozada, T. R., D. M. Branum, M. S. Reichle, and C. L. Hallstrom (2002), San Andreas fault zone, California: M∼5.5 earthquake history,
Bull. Seismol. Soc. Am., 92(7), 2555–2601, doi:10.1785/0120000614.
Wald, D. J., H. Kanamori, D. V. Helmberger, and T. H. Heaton (1993), Source study of the 1906 San Francisco earthquake, Bull. Seismol. Soc.
Am., 83(4), 981–1019.
Waldhauser, F. (2009), Near-real-time double-difference event location using long-term seismic archives, with application to Northern California, Bull. Seismol. Soc. Am., 99(5), 2736–2748, doi:10.1785/0120080294.
Zebker, H. A., S. Hensley, P. Shanker, and C. Wortham (2010), Geodetically accurate InSAR data processor, IEEE Trans. Geosci. Remote Sens.,
48(12), 4309–4321.
Zhu, L., and L. Rivera (2002), A note on the dynamic and static displacements from a point source in multilayered media, Geophys. J. Int.,
148, 619–627.