HAL Id: hal-00318423
https://hal.archives-ouvertes.fr/hal-00318423
Submitted on 2 Jan 2008
HAL is a multi-disciplinary open access
archive for the deposit and dissemination of
sci-entific research documents, whether they are
pub-lished or not. The documents may come from
teaching and research institutions in France or
abroad, or from public or private research centers.
L’archive ouverte pluridisciplinaire HAL, est
destinée au dépôt et à la diffusion de documents
scientifiques de niveau recherche, publiés ou non,
émanant des établissements d’enseignement et de
recherche français ou étrangers, des laboratoires
publics ou privés.
stream
R. A. Makarevich, P. L. Dyson
To cite this version:
R. A. Makarevich, P. L. Dyson. Dual HF radar study of the subauroral polarization stream. Annales
Geophysicae, European Geosciences Union, 2008, 25 (12), pp.2579-2591. �hal-00318423�
www.ann-geophys.net/25/2579/2007/ © European Geosciences Union 2007
Annales
Geophysicae
Dual HF radar study of the subauroral polarization stream
R. A. Makarevich and P. L. Dyson
Department of Physics, La Trobe University, Victoria, 3086, Australia
Received: 2 August 2007 – Revised: 6 December 2007 – Accepted: 12 December 2007 – Published: 2 January 2008
Abstract. The dual HF radars comprising the Tasman
In-ternational Geophysical Environment Radar (TIGER) system often observe localized high-velocity F-region plasma flows (≥1500 m/s) in the midnight sector (20:00–02:00 MLT) at
magnetic latitudes as low as 3=60◦S. The flow channels
exhibit large variability in the latitudinal extent and electric field strength, and are similar to the subauroral polarization stream or SAPS, a plasma convection feature thought to be related to the polarization electric field due to the charge separation during substorm and storm development. In this study, the 2-D plasma drift velocity within the channel is de-rived for each of the two TIGER radars from the maximum velocities measured in all 16 radar beams within the latitudi-nally narrow channel, and the time variation of the subauroral electric field is examined near substorm onset. It is demstrated that the flow channel often does not have a clear on-set, rather it manifests differently in different phases of its evolution and can persist for at least two substorm cycles. During the growth phase the electric fields within the flow channel are difficult to distinguish from those of the back-ground auroral convection but they start to increase near sub-storm onset and peak during the recovery phase, in contrast to what has been reported previously for auroral convection which peaks just before the substorm onset and falls sharply at the substorm onset. The response times to substorm onset range from −5 to +40 min and show some dependence on the substorm location with longer delays observed for sub-storms eastward of the radars’ viewing area. The propaga-tion velocity of the high-velocity region is also investigated by comparing the observations from the two closely-spaced TIGER radars. The observations are consistent with the no-tion that the polarizano-tion electric field is established with the energetic ions drifting westward and equatorward from the initial substorm injection. The ion injection front can pre-cede that of the electrons and hence substorm onset resulting in a negative response time of a few minutes.
Keywords. Ionosphere (Electric fields and currents; Plasma
convection) – Magnetospheric physics (Storms and sub-storms)
Correspondence to: R. A. Makarevich
1 Introduction
In-situ plasma convection observations by low-orbit satellites identified latitudinally narrow regions of very strong west-ward plasma flows termed Polarization Jets or PJ (Galperin et al., 1973), Subauroral Ion Drifts or SAID (Spiro et al., 1979), and Subauroral Electric Fields or SAEF (Karlsson et al., 1998). PJ/SAID/SAEF were proposed to occur when-ever the inner plasma sheet electrons and ions separate ra-dially establishing the poleward polarization electric field in the low conductivity region equatorward of the electron pre-cipitation (Southwood and Wolf, 1978). This separation fre-quently occurs soon after the substorm injection with the plasmasheet ions penetrating deeper into the inner magne-tosphere on the dusk side so that PJ/SAID are often said to be a substorm-related phenomenon (e.g. Anderson et al., 1993). A similar situation occurs during magnetospheric storms when strong convection electric field produces a sub-stantial radial separation between the inner edges of the plas-masheet ions and electrons. Consequently, wider regions of
enhanced plasma convection covering up to 5◦magnetic
lat-itude were shown to be regularly observed by the Millstone Hill incoherent scatter radar (MH ISR) during disturbed con-ditions equatorward of the electron precipitation and auroral convection cells (Foster and Vo, 2002) and an encompass-ing term Subauroral Polarization Stream or SAPS has been proposed (Foster and Burke, 2002).
Similar substorm-related features in plasma convection have been identified using coherent VHF radars at sub-auroral latitudes (Unwin and Cummack, 1980; Freeman et al., 1992) and most equatorward radars in the Super Dual Auroral Radar Network (SuperDARN or SD) of coherent HF radars (Parkinson et al., 2003; Koustov et al., 2006;
Oksavik et al., 2006). Parkinson et al. (2003) have
ob-served substorm-associated enhancements in plasma con-vection with the Bruny Island SD radar and introduced a new term Auroral Westward Flow Channel or AWFC, while Koustov et al. (2006) have stopped short of directly associ-ating AWFC observed with the King Salmon SD radar and SAPS. Finally, Oksavik et al. (2006) have used satellite ob-servations of auroral activity and in situ electric fields to con-clude that flow channels seen by the mid-latitude Wallops Is-land SD radar were manifestations of SAPS.
A range of observational techniques and different criteria for identification of features in the data used by researchers have made the task of studying the relationship between SAPS and substorms somewhat difficult and hence mecha-nisms responsible for the SAPS generation. In this regard, an important question is the SAPS onset timing in relation to the substorm onset. Anderson et al. (1993) have demon-strated that SAID occur more than 30 min after the substorm onset and almost always during the substorm recovery phase. In the same study, however, in several cases enhanced ion drifts below the threshold value of 1000 m/s (used for SAID identification) were observed during expansion phase. De-lays between substorm onset and SAID as low as 10 min were observed by Unwin and Cummack (1980) and Karlsson et al. (1998) with the empirical model of Galperin (2002) im-plying the generation of PJ within 5–10 min from substorm onset. Furthermore, Parkinson et al. (2003) showed that an AWFC appeared simultaneously with (within 2 min of) sub-storm onset as determined from magnetometer records. On the other hand, Koustov et al. (2006) considered observations of SAPS-like plasma flows by the King Salmon SD radar and concluded that substantial flows were generated some tens of min after substorm onset as determined from optical, magne-tometer Pi2 pulsation and energetic particle observations.
It is clear from this quick literature survey that the rela-tionship between SAPS and substorms requires further in-vestigation. Perhaps one important clue is provided by the recent studies that demonstrated a significant variability in the plasma flow velocity within SAPS as well as in the lat-itudinal extent of SAPS (Foster et al., 2004; Oksavik et al., 2006; Koustov et al., 2006). Coherent backscatter observa-tions from SD radars such as Bruny Island, King Salmon or Wallops Island are advantageous since measurements are provided on quasi-continuous basis over extended areas of the ionosphere with relatively good spatial (15–45 km) and temporal resolutions (1–2 min). The aim of this study is to investigate the temporal evolution of the SAPS plasma con-vection velocity/electric field around substorm onset. The specific objectives are (1) to determine the typical time vari-ation of the plasma convection velocity; (2) to find whether different features observed in the data can be manifestations of the same phenomenon at different phases of its temporal evolution; and (3) to study time delays between substorm on-set and SAPS onon-set.
2 Observations
2.1 Dual TIGER radars
In this study, data from the two coherent HF radars that con-stitute the Tasman International Geophysical Environment Radar (TIGER) dual system are considered. One radar is
located on Bruny Island (BI), Tasmania (geographic 43.4◦S,
147.2◦E, with the field-of-view (FoV) centered at boresite
of 180◦E of N) and the other radar is near Invercargill, New
Zealand (NZ) (46.5◦S, 168.4◦E, with boresite of 227.9◦).
The TIGER BI radar has been operational since 1999 and the TIGER NZ radar, also known as Unwin, has started oper-ations in November 2004. The two radars constitute the most equatorward pair with overlapping FoVs in the SuperDARN array with F-region echoes at magnetic latitudes (MLAT) as
low as 3=60◦S often observed by both radars.
The TIGER radars are similar to other SuperDARN radars, technically and operationally, as described by Greenwald et al. (1995) and more recently by Chisham et al. (2007). Each radar scans through 16 azimuthal directions (radar beams 0–
15) in 3.25◦steps, covering an azimuth range of ∼52◦. The
radars measure a 17-lag ACF from which estimates of the Doppler velocity, power, and spectral width of ionospheric echoes in 75 range bins for each of the 16 radar beams are obtained. The Doppler velocity measured corresponds to the line-of-sight or l-o-s irregularity velocity and is, by conven-tion, positive for irregularities propagating towards the radar. The range gate length was 45 km, with the first range gate at 180 km. The sounding frequency is usually fixed somewhere between 9 and 18 MHz.
2.2 Event selection and data post-processing
To investigate the plasma flow velocity variation around sub-storm onset the 6 events were selected using the
follow-ing algorithm. All ground-scatter echoes were excluded
first using the standard SD criteria of low Doppler veloc-ity and low spectral width. The ionospheric echo dataset was cleaned excluding echoes with low signal-to-noise ra-tio (SNR) P <3 dB, large spectral width W >500 m/s, and
very large speed V >2000 m/s. The E-region echoes at
short ranges r<765 km and F-region echoes at very large
ranges r≥1980 km were also excluded. The database of
substorm onsets (Frey and Mende, 2006) was employed for initial event search and the period of November 2004 – December 2005 was considered to find events with simul-taneous data from both TIGER radars (November 2004 – present) and substorm onset information (January 2003 – De-cember 2005 in Southern Hemisphere). Isolated substorms (>90 min difference) should have been observed between 08:00–12:00 UT (∼20:00–24:00 MLT) near the TIGER
FoV (42.5–62.5◦S, 110–200◦E). The other criterion used
was that the zonally-looking TIGER NZ radar should ob-serve more than 1500 echoes with Doppler velocities below
−500 m/s (westward velocity exceeding 500 m/s) between
08:00–14:00 UT (∼20:00–02:00 MLT) and 3=59◦–66◦S.
This criterion was adopted to find events with high SAPS-like plasma flow velocities and is similar to other criteria for velocity used in the past (e.g. Spiro et al., 1979; Karlsson et al., 1998; Koustov et al., 2006). To study time variation near substorm onset another restriction was introduced, i.e. that both TIGER radars should observe no less than 400 echoes in both 10 min preceding substorm onset and 10 min following
the onset. The resulting events were examined with respect to location of the region with enhanced velocities relative to the Defense Meteorology Satellite Program (DMSP) precip-itation boundaries as illustrated below similar to other recent studies (Koustov et al., 2006; Oksavik et al., 2006).
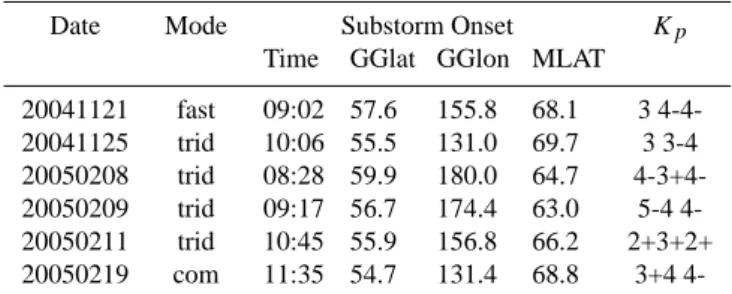
Table 1 shows the list of events with substorm onset time
and location and Kpindices indicated. The second column
shows the scanning mode of both TIGER radars. In the com-mon mode, the radars scan through successive beam posi-tions (from 0 to 15) with integration time at each position of 7 s with the total scan time of 2 min. In the fast mode, the integration and resolution are 3 and 60 s, respectively. Dur-ing 4 events, TIGER operated in a special “Trident” mode. This is a “multiple-camping-beam” mode with integration time of 3 s and total scan time of ∼100 s. The 3 camping beams were sampled 6 times in a cycle, with all other beams sampled once.
In the selection process described above, the 5 numbers (number of echoes 10 min before and after substorm onset for both TIGER radars and number of high-velocity echoes for TIGER NZ) had to be above their respective threshold values for each event. To ensure that our selection algo-rithm was not biased towards events with higher than normal beam sampling rate, for each event all 5 numbers were “nor-malised” by counting echoes in camping beams, dividing by 6 and adding echoes in non-camping beams. After the “re-normalization”, only one number for one event has dropped significantly below the threshold value. This calculation and further examination of individual events clearly show that the selection procedure employed has produced true SAPS-like events rather than events with high echo counts simply due to high rate of camping beam sampling.
2.3 TIGER observations of SAPS
Figure 1 shows the TIGER FoV with Tasmania in the top-middle part and South Island of New Zealand in the top-right corner of each panel. The green curves are the Polar Anglo-American Conjugate Experiment (PACE) lines of equal
mag-netic latitude 3=60◦S and 70◦S. TIGER BI (NZ) observes
in directions that are more perpendicular (parallel) to mag-netic L-shells with beam 0 being the westernmost beam (left in Fig. 1).
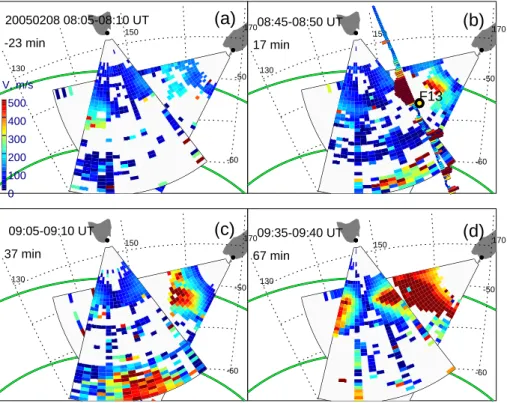
The TIGER 5-min velocity maps for 8 February 2005 for selected frames are shown in Fig. 1. For each frame, the average velocity was calculated for cells with 2 or more echoes. The time of the frame in UT and in minutes from substorm onset is indicated in the left-top corner of each panel. The DMSP pass with the cross-track ion drift veloc-ities given as coloured vectors is shown in panel (b). The DMSP trajectory was projected from a satellite altitude of around 860 km down to 200 km along the IGRF magnetic field line to account for different altitudes of TIGER and DMSP measurements. The velocity colour scale is the same for both TIGER and DMSP and is given in panel (a).
Table 1. Selected periods of the TIGER observations. The columns
3–6 show the time in UT, geographic latitude (in degrees South), geographic longitude (in degrees East) and PACE magnetic latitude (in degrees South) of the substorm onset. The column 7 shows the
Kpindices between 06:00 UT and 15:00 UT.
Date Mode Substorm Onset Kp
Time GGlat GGlon MLAT
20041121 fast 09:02 57.6 155.8 68.1 3 4-4-20041125 trid 10:06 55.5 131.0 69.7 3 3-4 20050208 trid 08:28 59.9 180.0 64.7 4-3+4-20050209 trid 09:17 56.7 174.4 63.0 5-4 4-20050211 trid 10:45 55.9 156.8 66.2 2+3+2+ 20050219 com 11:35 54.7 131.4 68.8 3+4
4-The convection was moderate before the substorm onset, panel (a), with maximum velocities of ∼200 m/s. In panel (b), 17 min after substorm onset, the TIGER NZ velocity at
∼61◦S increased to 500 m/s with the DMSP velocities of
500–700 m/s (one has to bear in mind slightly different lo-cations and look directions for TIGER and DMSP). Impor-tantly, the location of electron precipitation boundary (yellow circle) determined from in-situ particle flux data from SSJ/4 particle detector indicates that an enhanced plasma convec-tion channel evident in both TIGER NZ and DMSP data was located equatorward of the electron precipitation region. In panels (c) and (d), 37 and 67 min after substorm onset, the region with enhanced convection widens and enhanced ve-locities become evident in the TIGER BI observations in panel (d). It is important to note that the TIGER NZ veloc-ity showed some increase soon after the substorm whereas TIGER BI showed a similar increase only after 40 min. This feature is examined in more detail later in Sect. 2.4.
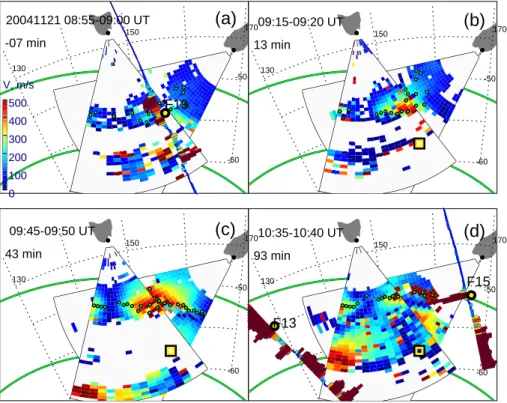
Figure 2 presents the TIGER velocity observations on 21 November 2004 in the same format as Fig. 1. The sub-storm onset as determined by IMAGE occurred at 09:02 UT at a location shown by the black-yellow square. Before sub-storm onset, panel (a), velocities were around 100 m/s in both radars. The DMSP ion drift data showed some enhance-ment in westward velocities with the largest velocities ob-served equatorward of the electron precipitation boundary. In panel (b), 13 min after substorm onset, equatorward of the substorm onset location the BI velocity is 400–500 m/s with TIGER NZ observing lower velocities of 200 m/s. No enhanced velocity was observed on the edges of the com-bined FoV (beams 0–3 of TIGER BI and beams 12–15 of TIGER NZ). In panel (c), 43 min after substorm onset, the velocity map shows a clear signature of the latitudinally
narrow (∼2◦) channel of enhanced convection extending in
longitude across the entire TIGER FoV. Finally, in panel (d), 93 min after substorm onset, the flow channel is much narrower with very sharp edges, in particular in the TIGER NZ observations. The DMSP F15 pass to the east of TIGER
130 150 170 -60 -50 20050208 08:05-08:10 UT -23 min
(
a)
130 150 170 -60 -50 08:45-08:50 UT F13 17 min(
b)
130 150 170 -60 -50 09:05-09:10 UT 37 min(
c)
130 150 170 -60 -50 09:35-09:40 UT 67 min(
d)
0 100 200 300 400 500 V, m/sFig. 1. TIGER 5-min velocity maps for 8 February 2005. Positive line-of-sight velocities are indicated by cells filled with solid colour, while
negative velocities are shown by cells filled with horizontal lines. The TIGER NZ velocity is reversed. Green lines are the PACE lines of
equal magnetic latitudes (3=60◦S and 70◦S). The 5-min time interval and the difference between the substorm onset and the start time of
the frame are shown in the top-left corner. The DMSP F13 pass with the simultaneously measured perpendicular ion velocities are indicated by colour vectors. The colour bar for the TIGER and DMSP velocities is shown in panel (a). The yellow dot with a black circle around is the electron precipitation boundary called b1e. For both TIGER BI and NZ, beam 0 (15) is the leftmost (rightmost) beam of the radar.
NZ showed a classical PJ/SAID signature with the ion cross-track velocities well above 1000 m/s. Maximum DMSP ve-locities were, again, observed equatorward of the electron
precipitation region. A similar feature was observed by
DMSP F13 west of TIGER.
2.4 Flow velocity variation with time
Examination of the velocity maps in Figs. 1 and 2 shows that the latitudinal position of the flow channel, its width and the flow speed within the channel exhibit significant variations with time. To investigate in more detail the flow speed/electric field strength temporal evolution the following semi-automatic method of velocity determination was devel-oped. For each 5-min frame and for each radar beam, all local maxima in the velocity versus range were found in the
magnetic latitude range 3=59◦–66◦S. The maxima farther
from the previous position of the flow channel than 2◦for BI
and 1◦for NZ were excluded. The main velocity maximum
within the specified range was taken as the maximum l-o-s velocity along the radar beam. These maxima were shown by the tiny green circles in Fig. 2. The larger latitude range
of 2◦for TIGER BI was selected because the tracing
algo-rithm was often loosing track of the channel in the BI data
if the same range of 1◦in MLAT was used for both radars.
The main reason for this is that TIGER BI observes in more meridional directions, which results in smaller l-o-s veloci-ties measured for mostly zonal plasma flows. As the velocity maxima along each beam were determined, smaller veloc-ity values for TIGER BI resulted in larger random variations in the latitudinal position of the maxima between successive frames. To keep track of the channel position for both radars,
a 2◦-wide range in MLAT was used for TIGER BI.
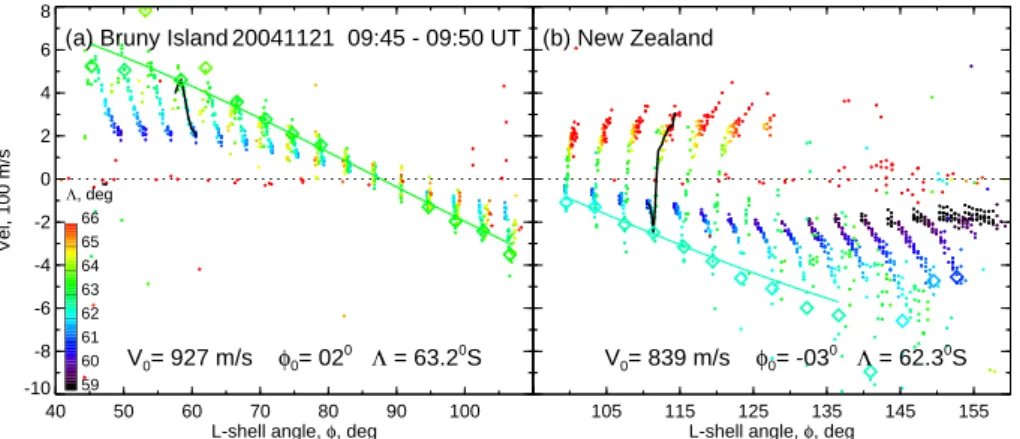
Figure 3 shows individual Doppler velocities measured by the TIGER (a) BI and (b) NZ radars versus the L-shell angle for the same frame as in Fig. 2c. All azimuths were mea-sured clockwise from the geographic north and the L-shell angle was defined as a difference between the azimuth of observations and the azimuth of eastern sector of the PACE magnetic parallel at 200 km. Thus L-shell angle is always positive and for TIGER BI it takes the range of values from
φ∼=45◦(beam 15) to 105◦(beam 0). The range for TIGER
NZ is from φ∼=100◦(beam 15) to 160◦(beam 0). The dots
in Fig. 3 are colour-coded in magnetic latitude according to the colour scheme shown in panel (a). The data from all 16 beams are collected here and the points exhibit a clear clustering according to the beam number as illustrated by the
130 150 170 -60 -50 20041121 08:55-09:00 UT F13 -07 min
(
a)
130 150 170 -60 -50 09:15-09:20 UT 13 min(
b)
130 150 170 -60 -50 09:45-09:50 UT 43 min(
c)
130 150 170 -60 -50 10:35-10:40 UT F13 F15 93 min(
d)
0 100 200 300 400 500 V, m/sFig. 2. The same as Fig. 1 but for 21 November 2004. For each radar beam, the radar range with maximum velocity is shown by a tiny green
circle. The black-yellow square in panels (b)–(d) shows the location of the substorm onset. black lines in both panels that show the average velocity in
a single beam for each radar. The diamonds show the maxi-mum velocities for up to 16 beams determined as described above. They are also colour-coded in magnetic latitude 3.
The diamonds are generally at the top or bottom (depend-ing on the velocity sign) of the cluster of points correspond-ing to the data from a specific beam. For this frame, the diamonds also generally follow the trend expected for an L-shell-aligned westward plasma flow with reversal in the BI
velocities occurring at φ∼=90◦ and negative NZ velocities
(receding irregularities). This trend is approximated by the
cosine function V0cos(φ+φ0)with coefficients V0 and φ0
representing the plasma flow speed and direction within the flow channel, respectively. For each 5-min frame, the
coeffi-cients V0and φ0were found from the non-linear least squares
best fit to the maximum velocities with initial values for V0
and φ0 taken from the previous frame. The average
latitu-dinal position in 3 of the flow channel (over all beams) is also given in each panel. This “all-beam cosine approxima-tion” implies that the flow is mostly homogeneous in lon-gitude/MLT within the channel in the FoV for each TIGER radar. Similar methods were employed by Ruohoniemi et al. (1989) and more recently by Makarevitch et al. (2004).
The “MLT-homogeneity” assumption sometimes breaks as for the 4 westernmost (low-number) beams of TIGER NZ on the right of panel (b). For some beams, the algorithm has selected the velocity maximum which showed a significant jump in magnetic latitude as compared to neighboring beams
which was nevertheless within 1◦or 2◦of the previous
posi-tion and so met the criteria in magnetic latitude. In all such cases, the “outlying” maxima were manually excluded from the best cosine fit shown by the solid line in Fig. 3. All max-imum velocities that were <100 m/s in magnitude were also excluded. In the following, only the frames that had more than 7(5) valid maxima for BI (NZ) were considered. The condition for NZ was less restrictive given that it was gener-ally more difficult to satisfy the “MLT-homogeneity” condi-tion for the zonally-looking NZ radar, as in Fig. 3.
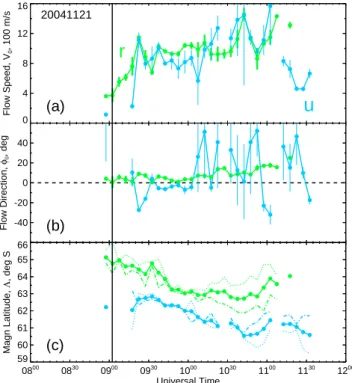
Figure 4 shows the results of velocity fitting for the entire event of 21 November 2004. The vertical bars are the
un-certainties in the fitted parameters V0 and φ0 that take into
account standard deviations in the average velocities shown by diamonds in Fig. 3 (these uncertainties were not shown in Fig. 3 to make the diagram more readable). One can notice that the plasma flow speed in panel (a) exhibited an initial increase for both radars some time after the substorm onset shown by the vertical line (both green and blue lines start to go up). No delay was observed in the BI data (green line goes up immediately after the substorm onset), while the NZ velocity shows a delay of about 15–20 min, in agree-ment with Fig. 2. After that the speed variations were quite similar for both radars. The velocity reached maximum at 10:30–11:00 UT or 90–120 min after substorm onset, again in agreement with the individual velocity maps (Fig. 2d). The flow direction was on average roughly along the L-shell, al-though uncertainties in the NZ data were quite large after
40 50 60 70 80 90 100 L-shell angle, φ, deg
-10 -8 -6 -4 -2 0 2 4 6 8 Vel, 100 m/s (a) Bruny Island V0= 927 m/s φ0= 02 0 Λ = 63.20S 105 115 125 135 145 155 L-shell angle, φ, deg
(b) New Zealand V0= 839 m/s φ0= -03 0 Λ = 62.30S 59 60 61 62 63 64 65 66 Λ, deg 20041121 09:45 - 09:50 UT
Fig. 3. Scatter plot of the Doppler velocity versus L-shell angle φ for 21 November 2004, 09:45–09:50 UT for the TIGER (a) Bruny Island
and (b) New Zealand radars. The two black lines show velocity variation in beam 12 for BI and NZ radars. The diamonds are maxima of the averaged (over the frame time interval) velocity in all radar beams as described in the text. The points and diamonds are colour-coded in
magnetic latitude 3 as indicated in panel (a). The solid line represents the best fit, V0cos(φ+φ0), to diamonds. The fitting coefficients V0
and φ0and the magnetic latitude of cells with velocity maxima averaged over all beams are given in each panel.
10:00 UT, panel (b). The flow channel exhibited overall equatorward motion before about 11:00 UT. The latitudinal
positions observed by the two radars differed by ∼1◦ with
TIGER BI showing a slightly poleward location, panel (c). One can also observe some rotation of the channel in the BI data with the easternmost beams 10–15 (green dash-dotted line) detecting a more equatorward location. This is in agree-ment with the TIGER NZ observations: TIGER NZ is lo-cated eastward of TIGER BI and so some difference between latitudinal positions can be explained by a finite rotation of the flow channel from the L-shell direction (the flow channel is located at lower latitudes at later MLTs).
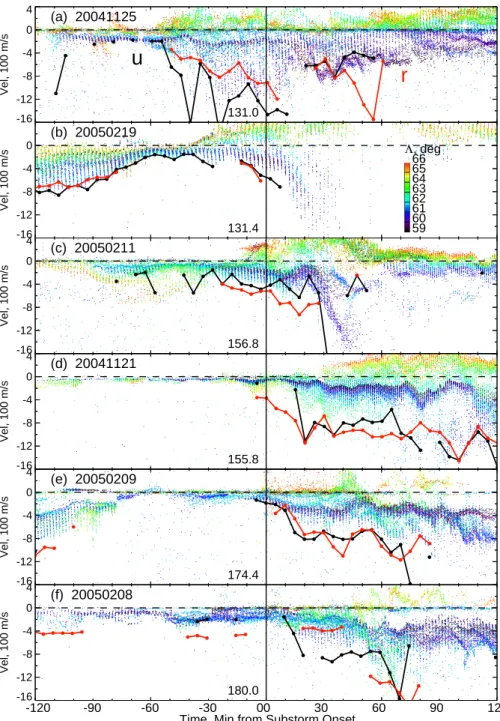
The fitted “all-beam” velocities have been calculated for all 6 events considered and in Fig. 5 the results for the
fit-ted plasma flow speed V0are presented as a function of time
from the substorm onset. The TIGER BI (NZ) fitted veloc-ity is shown by the red (black) line. To put the results of the fitting into the context of actual l-o-s velocity measure-ments and check whether they make sense, Fig. 5 also shows all TIGER NZ velocity l-o-s measurements colour-coded in magnetic latitude as shown in panel (b). The events are sorted according to the shape of the velocity time variation rather than sequentially as in Table 1. The substorm onsets are shown by the vertical line. The digits on the left show the ge-ographic longitude of the substorm onset. One should bear in mind that the fitted velocity is calculated using observa-tions within the channel only, while Fig. 5 shows all velocity measurements.
In all events, the fitted NZ velocity (black) generally fol-lows the bottom envelope of the NZ l-o-s velocity. Occa-sionally, this feature is not observed as in panel (a), 40 min before substorm, when a relatively short-lived velocity spike is seen. In all such cases, the diagrams similar to Fig. 3 were checked to confirm that the calculated fitted velocity was of reasonable quality. In all events but the first one, the
veloc-ity exhibited a marked increase near substorm onset. On 25 November 2004, panel (a), velocity started to increase well before the substorm (40–60 min) so that near substorm onset velocities were already elevated to ∼ 1000–1400 m/s. After substorm onset no significant increase in velocity was ob-served, rather some decrease was seen so that 20 min after substorm onset velocities were 600–800 m/s. One should note though that this event was characterized by a
particu-lar low magnetic latitude of the flow channel (as low as 60◦).
It is possible that some of the decrease seen was simply due to the fact that the flow channel moved to closer ranges cor-responding to E-region scatter since the E-region irregularity velocity is known to be significantly reduced compared to F-region convection velocities (Makarevitch et al., 2004).
In the events that did show an increase near substorm onset, the trends differed from event to event, with two events, panels (b) and (c), showing velocity reaching max-imum within 20–40 min from substorm and with three other events, panels (d)–(f), showing more gradual increase with some variation. On 19 February 2005, panel (b), velocities started to increase ∼5 min before substorm onset. On the other hand, positive delays between substorm onset and the timing of the initial increase in the TIGER NZ velocity were observed in all other events but one. One should note though that during the latter event, on 09 February 2005, panel (e), the velocity increase less than 10 min after substorm onset was small and well within uncertainties. A large positive de-lay of >40 min was observed in the BI velocities on 8 Febru-ary 2005, panel (f).
The last observation is consistent with the presentation of Fig. 1c that showed that 37–42 min after substorm onset the BI velocities were comparable with pre-substorm lev-els and smaller than velocities measured by TIGER NZ. The opposite delay was observed in Fig. 2, with the TIGER NZ velocity being smaller than that measured by TIGER BI 13
min into the substorm expansion phase, panel (b), despite the more zonal look direction of TIGER NZ. The BI velocity in-crease preceding that in the NZ velocity was also observed in Fig. 5d. Moreover, from Fig. 5 it appears that a similar feature is present in panel (b)–(d), with the red line to the left of the black line near substorm onset. The opposite effect is seen in panels (e)–(f). Looking at the geographic longitude of the substorm onset (left of vertical line), one can notice that the last two substorms were detected a considerable dis-tance east of the TIGER FoV, whereas in panels (b)–(d) the substorm locations were at or west of that shown in Fig. 2b, and hence either within or westward of the FoV.
To further test that the observed delays between fitted ve-locities inferred from the two TIGER radars represent the data reasonably well, the BI and NZ velocities were com-pared directly. Taking into account that individual veloci-ties in Fig. 5 are the l-o-s (cosine) components of the plasma velocity and that the flow within the channel is to the first approximation along the L shell, the TIGER velocities mea-sured were divided by the cosine component of the L-shell angle φ to estimate 2-D plasma drift speed. The same ap-proach is used routinely in the MH ISR observations (Foster and Vo, 2002).
Figure 6 shows the results of a comparison between the NZ and BI plasma drift speeds in the same format as in Fig. 5. Instead of showing the scatter plot (which is extremely busy), in this presentation a 2-D occurrence distribution diagram is used. The colour of each cell in the plot represents the dif-ference between counts detected by the NZ and BI radars according to the colour scheme in panel (a). The bin widths were 2 min in time and 50 m/s in plasma drift speed. If this number is positive (red to yellow) this means that the NZ radar detected more echoes with given values of speed and during given 2-min interval. Otherwise, the BI radar detected more echoes (green to dark blue). To compare velocities for directions closest to L-shell where the uncertainties in the speed estimates in this method are minimal, the BI velocities
in beams 7–15 only were counted (L-shell angles 50◦–80◦).
To compare with mostly negative NZ velocities, the BI ve-locities were reversed.
One can notice that an increase in the BI velocity pre-cedes that in the NZ velocity near substorm onset in panel (a) with negative difference in counts (green cells) peaking
∼20 min after substorm and 10 min before the positive
dif-ference (red cells) peaked. The opposite effect is observed in panel (b), with the BI velocities (green cells) exhibiting an increase only ∼ 50 min after substorm onset, in sharp con-trast with the NZ velocities (red and yellow cells) that reach 800–1000 m/s 10–20 min after substorm in agreement with Fig. 5f. One can conclude that the above delays are not sim-ply an artefact of the fitting procedure. As will be argued in Sect. 3.2, these delays are likely to be due to the finite propagation time from the substorm injection location to the position of the radars.
0 4 8 12 16 Flow Speed, V 0 , 100 m/s 20041121 (a)
u
r
-40 -20 0 20 40 Flow Direction, φ0 , deg (b) 0800 0830 0900 0930 1000 1030 1100 1130 1200 Universal Time 59 60 61 62 63 64 65 66 Magn Latitude, Λ , deg S (c)Fig. 4. Time variation of (a) the fitted velocity V0, (b) the L-shell
angle φ0, and (c) the magnetic latitude 3 on 21 November 2004 for
TIGER BI (green, “r”) and NZ (blue, “u”). The fitting uncertainties are indicated by the vertical error bars. The dotted (dash-dotted) lines in panel (c) are the estimates of the flow channel location (in
3) for the low- (high-) number radar beams 0–5 (10–15). The
ver-tical line shows the substorm onset.
3 Discussion
3.1 On the nature of high-velocity plasma flows seen by
TIGER
The high plasma flow velocities of ∼1500 m/s observed by the newly-deployed zonally-looking TIGER New Zealand
radar at magnetic latitudes of 3=59◦–66◦S are a striking
fea-ture of the F-region plasma convection. They exhibit signif-icant variability in the flow speed (and hence in the electric field strength) and latitudinal extent, Figs. 1 and 2. Compar-ison with the simultaneously observed high-velocity flows by the TIGER Bruny Island revealed that these flows are undoubtedly the same feature observed previously with the TIGER BI radar (Parkinson et al., 2003). The innovation of this study is that we report the first dual radar observations of the SAPS-like plasma flows. These observations provide im-portant information on the time evolution of the subauroral electric fields as these are estimated on a quasi-continuous basis in the two closely-separated areas so that time delays and propagation associated with the flow channel formation can be investigated. This study also takes the first step to-wards the proper superposed epoch analysis of the substorm-associated subauroral electric fields.
-16 -12 -8 -4 0 4 Vel, 100 m/s 131.0 (a) 20041125
u
r
-16 -12 -8 -4 0 Vel, 100 m/s 59 60 61 62 63 64 65 66 Λ, deg 131.4 (b) 20050219 -16 -12 -8 -4 0 4 Vel, 100 m/s 156.8 (c) 20050211 -16 -12 -8 -4 0 4 Vel, 100 m/s 155.8 (d) 20041121 -16 -12 -8 -4 0 4 Vel, 100 m/s 174.4 (e) 20050209 -16 -12 -8 -4 0 4 Vel, 100 m/s 180.0 (f) 20050208 -120 -90 -60 -30 00 30 60 90 120Time, Min from Substorm Onset
Fig. 5. Scatter plot of the TIGER NZ l-o-s velocity versus time from substorm onset (vertical line) for all events. The points are colour-coded
in magnetic latitude 3 as shown in panel (b). Time variations of the flow speed V0for TIGER NZ and BI are shown by the black and red
lines, respectively (the same as blue and green lines in Fig. 4a). The geographic longitude of each substorm onset location is shown to the left of the vertical line.
The first important observation is that the enhanced flows were seen equatorward of the electron precipitation region as the DMSP observations showed. Because of the limited DMSP coverage, there was no exact coincidence between the DMSP cross-track ion drift velocities and the TIGER l-o-s ir-regularity velocities. One has to bear in mind also that even with the best experimental configuration used for compar-ison (highly homogeneous flows and closely-matched look
directions) no exact match is seen (Drayton et al., 2005). However, striking similarities between the latitudinal pro-files and strengths of the flow channel as seen by DMSP and TIGER demonstrate that a flow channel can become a clas-sical PJ/SAID at later stages of its evolution (Fig. 2d) and hence should be incorporated into the definition of SAPS. A conclusion similar to the latter has been recently reached by Oksavik et al. (2006) for observations of the flow channels
at 3=57◦–61◦N with the Wallops Island SD radar. The
magnetic latitudes in the range 61◦–64◦S, the corresponding
typical Kp values of 3–4 and generally equatorward motion
are all in good agreement with the average characteristics of SAPS for this time sector reported by Foster and Vo (2002) (see their Fig. 3).
The second result of this study is that the SAPS appears to exist for at least two substorm cycles. In all events but one, clear signatures of the flow channel were observed long be-fore the substorm onset, Fig. 5, even though for most events velocities were significantly reduced during the growth phase (Fig. 5b, e, f). For one event, when no clear signature of the flow channel was observed before the substorm onset (Fig. 5d), the DMSP ion drift observations revealed that a very weak (∼200 m/s) but narrow, SAID-like signature ex-isted just before the substorm onset. Recently Mishin and Mishin (2007) presented one example of a storm-time sub-storm event when a pre-existing SAPS intensified within
∼10 min after the onset. Earlier Anderson et al. (1993)
ar-gued that a weak, “fossil”-like channel with marginally en-hanced convection can remain dormant from previous sub-storm cycle and be capable of increasing rapidly in the tric field strength when a newly-generated polarization elec-tric field is imposed on the low-conductivity region after the next substorm injection. A related feature of fossil trough in the nighttime F region formed by the substorm-related enhancements in the dusk-side convection and then persist-ing through the midnight sector was described by Evans et al. (1983). It is possible that this mechanism is at play more often than originally thought, which could explain our ob-servations, although more modelling effort is required to an-swer this question definitively. Our observations also suggest that care should be exercised when introducing a threshold in the plasma drift speed/electric field as one of the criteria for PJ/SAID identification. The lower-than-threshold flows may well have existed before the substorm onset while be-ing essentially the same phenomenon. Our observations thus support the idea that it makes more sense to talk about the time-varying electric fields within SAPS rather than about any feature that exhibits large enough convection velocity and hence has a clear onset. This is in line with a more relaxed definition of SAID proposed recently by Huang et al. (2006) according to which SAID are simply latitudinally
narrow (1◦–2◦) “spiky” intensifications of the westward flow
irrespectively of their velocity magnitude.
3.2 SAPS electric fields near substorm onset
In all events but one, the plasma velocity started to increase near substorm onset. In 4 events, this increase occurred af-ter onset, while in one event, Fig. 5b, the increase preceded
the substorm onset by 5–10 min. This result is opposite
to that reported for auroral, reconnection-related convection near substorm onset in the midnight sector that exhibits an enhancement a few minutes before the substorm onset and
-16 -12 -8 -4 0 4 Vel/cos φ , 100 m/s -20 -15 -10 -5 0 5 10 15 20
Count Diff, N(NZ)-N(BI)
(a) 20041121 -16 -12 -8 -4 0 Vel/cos φ , 100 m/s (b) 20050208 -120 -90 -60 -30 00 30 60 90 120 Time, Min from Substorm Onset
Fig. 6. 2-D colour histogram of the difference in occurrence
be-tween the TIGER NZ and BI plasma drift speeds (l-o-s velocity di-vided by the cosine component of the L-shell angle φ) versus time from substorm onset (vertical line) for two events. Each 2-min-wide and 50-m/s-high plot cell shows the difference between the counts observed by the TIGER NZ and BI by the colour of the cell ac-cording to the colour scheme in panel (a). The BI velocities were reversed and measurements in beams 7–15 were counted.
a marked decrease at the substorm onset (see, for example, recent paper by Bristow and Jensen, 2007, and references therein). This suggests that the plasma convection at subau-roral latitudes is driven by a mechanism different from tail-reconnection. Although no estimates of the 2-D plasma ve-locity as a function of time were reported previously, our re-sults are consistent with the l-o-s velocity variation presented by Koustov et al. (2006) for one event observed with the King Salmon SD radar that showed a velocity increase starting at the substorm onset (see their Fig. 5a). It has been also shown that the azimuthal velocities are maximized 10–20 min after substorm in the late afternoon sector (Provan et al., 2004) and near ∼21:00 MLT on a statistical basis (Koustov et al., 2006).
In our observations, the only event that did not exhibit any noticeable increase near substorm onset was 25 November 2004, Fig. 5a. In fact, this scatter plot and examination of the velocity maps and velocity-angle plots analogous to Fig. 3 suggest that some decrease was seen. The substorm onset identification at 10:06 UT by IMAGE is supported by Los Alamos National Laboratory (LANL) geostationary satellite observations of energetic particles. These showed a clear dispersionless injection at this time detected by the
LANL-130 150 170 -60 -50 130 150 170 -60 -50 130 150 170 -60 -50 130 150 170 -60 -50 (a) (b) (c) (d)
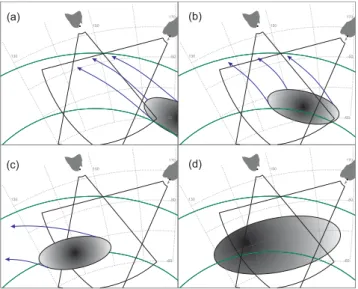
Fig. 7. Schematics of the particle injection location (gradient-filled
oval) (a) eastward of, (b) within, (c) westward of, and (d) extending across the TIGER FoV. The energetic ions drift at an angle with respect to magnetic L shells (green) following the blue arrows.
97A and 1994-084 satellites. Another dispersionless injec-tion was seen by the same pair of satellites at ∼9:13 UT or 53 min before the substorm onset, which is in good agree-ment with the time when the velocity increase was observed by TIGER, Fig. 5a. AE index variation and magnetometer observations on Macquarie Island (not shown here) also sup-port the idea that another substorm has occurred 53 min be-fore the one at 10:06 UT. Thus the absence of a clear velocity increase near 10:06 UT is unlikely to be due to an error in the substorm onset timing and is possibly due to this substorm not being isolated with the velocity variation being affected by the previous substorm cycle.
Analysis of events with a velocity increase near substorm onset, Fig. 5b–f, showed that the response time of the elec-tric field within the flow channel to the substorm onset was variable from −5 (Fig. 5b) to +40 min (Fig. 5f for BI radar). It was noted that this response time appeared to depend on the location of the substorm onset with longer delays ob-served for substorm onsets eastward of the TIGER FoV. As geographic longitude of the substorm onset increased from Fig. 5b to Fig. 5f, the delays were generally larger. Thus al-most instantaneous (within 5 min) responses were observed by the BI radar in Fig. 5b–d, whereas in Fig. 5e and f the response times were considerably longer. This was gener-ally the case for the NZ radar as well although the largest delay was observed in Fig. 5d. It was also noted that the BI velocity increase preceded that in the NZ velocity when substorm onsets occurred within or westward of the TIGER FoV, Fig. 5b–d. The fact that the delay in the NZ veloc-ity in Fig. 5d was the largest or at least comparable to that in Fig. 5f, while the substorm onset location was much closer in zonal direction, suggests that factor(s) other than simply
dis-tance in the zonal direction may be important. From Fig. 2b, no high-velocity echoes were seen by the NZ radar eastward and equatorward of the substorm onset location with simul-taneous high-velocity echoes observed by the BI radar west-ward and equatorwest-ward of that. This suggests that the prop-agation velocity of the region with high electric fields was predominantly westward in this case. Westward propagation velocity is also suggested by Fig. 5e and f.
Our observations support the notion that high-velocity plasma flows are driven by the polarization electric field due to charge separation during substorm development as dis-cussed below. After the substorm injection the energetic pro-tons penetrate deeper into the inner magnetosphere than the electrons under the combined action of the convection elec-tric field and the curvature-gradient drift (Southwood and Wolf, 1978). The protons from the initial injection region drift westward and inward/equatorward near magnetic mid-night (e.g. Galperin, 2002). Consequently the region with enhanced electric field should expand westward and equator-ward in the midnight sector of interest.
Figure 7 illustrates this situation showing the injection re-gion, the proton trajectories and the TIGER FoV for four
cases. In case (a), the initial injection region shown by
the gradient-filled oval is eastward of the TIGER FoV. The injected protons drift westward and equatorward, enter the TIGER FoV and the polarization field is established with some delay. The delays between the velocity increases mea-sured by the two radars will vary depending on the mag-netic latitude and shape of the injection region but generally TIGER NZ should detect an increase sooner. This case refers to Fig. 5e and f. In case (b), the protons from the injection region enter the TIGER BI FoV at subauroral latitudes first with the protons from the equatorward and eastward edge (upper blue arrow) following, which results in the BI veloc-ity increase preceding that of the NZ velocveloc-ity, Fig. 5c and d. In case (c), the injection is westward of the TIGER FoV and no polarization field is observed there, which possibly refers to Fig. 5a. Finally, when the centre of the substorm onset is also westward but the injection region is sufficiently large to extend across both TIGER BI and NZ FoVs, panel (d), the polarization field is established almost simultaneously in these areas and this is a possible explanation for the data pre-sented in Fig. 5b.
The time evolution of the electric fields after the initial in-crease “phase” was similar as seen by both TIGER radars in most events. After the initial increase, the velocity was either reaching the maximum monotonically as in Fig. 5b and c or more gradually with some variations as in Fig. 5d–f. The maximum velocity was observed a few tens of min after the substorm onset, from 20 min in Fig. 5b to over 90 min in Fig. 5d. This result is in agreement with that reported by Koustov et al. (2006).
Our observations suggest that the time variation of the electric field within the SAPS is a two-stage process. Dur-ing the first phase, the velocity is mostly controlled by the
0 4 8 12 16 Vel, 100 m/s (a) 20041125 0 4 8 12 Vel, 100 m/s (b) 20050219 0 4 8 12 16 Vel, 100 m/s (c) 20050211 0 4 8 12 16 Vel, 100 m/s (d) 20050209 0 4 8 12 16 Vel, 100 m/s (e) 20050208 -120 -90 -60 -30 00 30 60 90 120 Time, Min from Substorm Onset
Fig. 8. Time variation of the TIGER BI (red) and NZ (black)
ve-locities (the same as in Fig. 5 but reversed) and the LANL 1994-084 satellite fluxes in arbitrary logarithmic scale. The proton fluxes shown are (from top to bottom): 50–75, 75–113, 113–170, 170– 250, and 250–400 keV.
polarization electric field being established in the subauro-ral ionosphere. In the second phase, the electric field varia-tion is likely to be affected by the ionosphere-magnetosphere positive feedback processes during which the strong electric field decreases the conductance, with the decreasing conduc-tance reinforcing the electric field (see, for example, the re-cent review by Wolf et al., 2007, and references therein). Consequently, how the electric field will vary with time at a particular location in the second phase may depend on the ionospheric conditions at this location. Similar processes are believed to be responsible for time variation of the SAPS electric fields during substantial geomagnetic storms with the “main” SAPS electric field produced by the radial separa-tion between ions and electrons associated with ring current enhancement and with rapidly-changing SAID-like perturba-tions produced by the ionospheric feedback instability (e.g. Foster et al., 2004; Oksavik et al., 2006).
A possible complicating factor is additional injections of the energetic ions during substorm intensifications following
the main substorm injection which can reinforce the polar-ization electric field. To check whether any such additional injections occurred in our events, we analyzed the proton fluxes measured by the Synchronous Orbit Particle Analyzer (SOPA) onboard of the geostationary satellite LANL 1994-084, a closest satellite in MLT to our observational sector. Figure 8 shows the TIGER fitted velocities (reversed as com-pared to Fig. 5) and the proton fluxes in an arbitrary loga-rithmic scale for the 5 events for which the LANL 1994-084 proton fluxes were available. The first feature to note is a dis-persionless injection of protons at −53 min, Fig. 8a, observed almost simultaneously with the increase in TIGER NZ veloc-ity. This observation once again confirms our conclusion that the velocity increase before substorm onset at 10:06 UT was due to another substorm that occurred 53 min earlier. The second observation is that the vertical line corresponds to a dispersionless proton injection for every event for which a velocity increase was seen as expected. One should note that there is a dispersionless injection in the SOPA electron data for the first event as well (not shown) with no proton counterpart, Fig. 8a, which is a possible reason why no ve-locity increase was observed for this event. An interesting feature is observed in Fig. 8b where proton fluxes start to in-crease ∼5 min before the substorm onset. This was also the event when the velocity increase occurred 5–10 min before the substorm, which provides an important clue to why this may have happened. Sergeev et al. (1998) have reported ob-servations of the two-layer injection front detected with the
CRRES satellite at 5 RE with a dispersionless proton front
preceding that of the electrons. The time delay was 4 min which is in good agreement with our observations. This provides additional support to the direct association between the plasma velocity increase and proton injections near sub-storm onset. Fig. 8d and e also show that the velocity in-creases detected by both TIGER radars ∼55 and 60 min after the substorm onset, in events shown in panels (d) and (e), respectively, were preceded by the dispersionless increases in the proton flux ∼45 and 42 min after the substorm onset, in panels (d) and (e), respectively, which suggests that the association between the plasma velocity increase and proton injections may exist for subsequent intensification/proton in-jections as well.
Similar to the SAPS electric fields, the meridional motions of the SAPS peak also exhibited some variability. Analysis of the diagrams analogous to Fig. 4c for all 6 events (not presented here) shows that in two events (21 and 25 Novem-ber 2004), the SAPS steadily migrated equatorward, while in other two (8 and 9 February 2005) it was mostly station-ary in magnetic latitude. The SAPS equatorward migration is not unexpected and can be explained by the energetic protons penetrating to lower L shells. One must bear in mind though that some (or all) of it can be an apparent effect due to the SAPS being at more equatorward locations at later MLTs (Foster and Vo, 2002). As the radars move towards mag-netic midnight they sample the SAPS at more equatorward
locations. The absence of any substantial movement in some events is difficult to explain through either of these effects but may be, again, suggestive of the two-stage nature of the SAPS development with the ionosphere-magnetosphere cou-pling processes possibly playing a substantial role in the sec-ond stage.
4 Summary and Conclusions
The first quasi-continuous observations of the localized
high-velocity F-region plasma flows at 3=59◦–66◦S by the dual
TIGER HF radars near substorm onset were presented. Six events were selected during which TIGER detected both a large number of high-velocity echoes and a substantial num-ber of echoes near the substorm onset. A comparison with the simultaneously observed DMSP signatures showed that the flow channels extend equatorward of the electron precip-itation region and that they can become classical PJ/SAID at later stages of their evolution. Hence it was argued that AWFC should be incorporated into a definition of SAPS.
A semi-automatic method of the plasma velocity deriva-tion was developed using iterative fitting to the maximum ve-locities detected within SAPS. Analysis of the time variation of the plasma velocity around substorm onset showed that the SAPS appeared not to have a clear onset, rather they existed in a dormant state before the substorm onset. The plasma velocity typically exhibited an increase near substorm onset with variable response times, from −5 to +40 min. These re-sults suggested that the SAPS channel exists independently of the substorm-related processes which simply reinforce the plasma convection after the substorm onset. The result show-ing plasma velocity increase after substorm onset was oppo-site to that reported for auroral convection in the midnight sector for which a sharp decrease at the substorm onset is seen. This suggested that the plasma convection at auroral and subauroral latitudes is driven by different mechanisms.
The shape of velocity variation with time and the re-sponse time to the substorm onset varied from event to event, with some events showing a substantial monotonic increase within 20–40 min from the substorm onset and with oth-ers showing a more gradual increase with some variation. The response times exhibited some dependence on the storm onset location with longer delays observed for sub-storm onsets that were detected eastward of TIGER. The analysis of the response times detected by the two closely-separated TIGER radars suggested that the region with en-hanced velocities expands westward and equatorward fol-lowing the energetic ions that drift from the substorm
in-jection region. Examination of the LANL proton fluxes
measured at geostationary orbit showed that the velocity in-crease was associated with the dispersionless ion injection including the case when the velocity increase started before the substorm onset (negative response time). The time vari-ation of the electric fields within the SAPS suggests that it
is a two-stage process. The initial velocity increase is as-sociated with the establishment of the polarization electric field near substorm onset with delays dependent on the loca-tion of the ion injecloca-tion region. The time evoluloca-tion follow-ing the initial increase may depend on both the ionospheric conditions through the ionosphere-magnetosphere coupling processes and additional supply of energetic ions during sub-sequent intensifications.
Acknowledgements. This research was supported by the Australian Research Council Discovery grant to R.A.M. (project DP0770366). TIGER is supported by the ARC Discovery grant DP0664424, the Australian Antarctic Science grant program, and a consortium of institutions: La Trobe University, University of Newcastle, Monash University, Australian Government Antarctic Division, ISR Divi-sion DSTO and IPS Radio and Space Services. Additional funding towards construction of the TIGER radars was received from the ARC, US Air Force Office of Scientific Research, British Antarctic Survey and RLM Systems Pty Ltd, Australia. The authors grate-fully acknowledge the Center for Space Sciences at the University of Texas at Dallas and the US Air Force for providing the DMSP thermal plasma data. The DMSP particle detectors were designed by D. Hardy of AFRL, and data obtained from JHU/APL. The au-thors thank D. Hardy, F. Rich, and P. Newell for its use. D. DeLapp and G. Reeves of Los Alamos National Laboratory are thanked for providing the SOPA LANL particle flux data. R. A. Makarevich thanks A. V. Koustov and J.-P. St.-Maurice for fruitful discussions. Topical Editor Mike Pinnock thanks K. Oksavik and another anonymous referee for their help in evaluating this paper.
References
Anderson, P. C., Hanson, W. B., Heelis, R. A., Craven, J. D., Baker, D. N., and Frank, L. A.: A proposed production model of rapid subauroral ion drifts and their relationship to substorm evolution, J. Geophys. Res., 98, 6069–6078, 1993.
Bristow, W. A. and Jensen, P.: A superposed epoch study of Super-DARN convection observations during substorms, J. Geophys. Res., 112, A06232, doi:10.1029/2006JA012049, 2007.
Chisham, G., Lester, M., Milan, S. E., Freeman, M. P., Bristow, W. A., Grocott, A., McWilliams, K. A., Ruohoniemi, J. M., Yeoman, T., Dyson, P. L., Greenwald, R. A., Kikuchi, T., Pin-nock, M., Rash, J. P. S., Sato, N., Sofko, G. J., Villain, J.-P., and Walker, A. D. M.: A decade of the Super Dual Auro-ral Radar Network (SuperDARN): scientific achievements, new techniques and future directions, Surv. Geophys., 28, 33–109, doi:10.1007/s10712-007-9017-8, 2007.
Drayton, R. A., Koustov, A. V., Hairston, M. R., and Villain, J.-P.: Comparison of DMSP cross-track ion-drifts and SuperDARN line-of-sight velocities, Ann. Geophys., 23, 2479–2486, 2005, http://www.ann-geophys.net/23/2479/2005/.
Evans, J. V., Holt, J. M., Oliver, W. L., and Wand, R. H.: The fossil theory of nighttime high latitude F region troughs, J. Geophys. Res., 88, 7769–7782, 1983.
Foster, J. C. and Burke, W. J.: SAPS: A new categorization for sub-auroral electric fields, EOS, 83, 393–394, 2002.
Foster, J. C. and Vo, H. B.: Average characteristics and activity dependence of the subauroral polarization stream, J. Geophys. Res., 17, 1475, doi:10.1029/2002JA009409, 2002.
Foster, J. C., Erickson, P. J., Lind, F. D., and Rideout, W.: Millstone Hill coherent-scatter radar observations of electric field variabil-ity in the Sub-Auroral Polarization Stream, Geophys. Res. Lett., 31, L21803, doi:10.1029/2004GL021271, 2004.
Freeman, M. P., Southwood, D. J., Lester, M., Yeoman, T. K., and Reeves, G. D.: Substorm-associated radar auroral surges, J. Geo-phys. Res., 97, 12 173–12 185, 1992.
Frey, H. U. and Mende, S. B.: Substorm onset as observed by IMAGE-FUV, Proceedings of the 8th International Conference on Substorms, 71–75, 2006.
Galperin, Y. I.: Polarization jet: Characteristics and a model, Ann. Geophys., 20, 391–404, 2002,
http://www.ann-geophys.net/20/391/2002/.
Galperin, Y. I., Ponomarev, V. N., and Zosimova, A. G.: Direct mea-surements of ion drift velocity in the topside ionosphere during a magnetic storm, Cosmicheskie Issled., 11, 273–283, 1973. Greenwald, R. A., Baker, K. B., Dudeney, J. R., Pinnock, M., Jones,
T. B., Thomas, E. C., Villain, J.-P., Cerisier, J.-C., Senior, C., Hanuise, C., Hunsuker, R. D., Sofko, G., Koehler, J., Nielsen, E., Pellinen, R., Walker, A. D. M., Sato, N., and Yamagishi, H.: DARN/SuperDARN: A global view of the dynamics of high-latitude convection, Space Sci. Rev., 71, 763–796, 1995. Huang, C., Sazykin, S., Spiro, R., Goldstein, J., Crowley, G., and
Ruohoniemi, J. M.: Storm-time penetration electric fields and their effects, EOS, 87, 131–132, 2006.
Karlsson, T., Marklund, G. T., and Blomberg, L. G.: Subauroral electric fields observed by the Freja satellite: A statistical study, J. Geophys. Res., 103, 4327–4341, 1998.
Koustov, A. V., Drayton, R. A., Makarevich, R. A., McWilliams, K. A., St-Maurice, J.-P., Kikuchi, T., and Frey, H. U.: Obser-vations of high-velocity SAPS-like flows with the King Salmon SuperDARN radar, Ann. Geophys., 24, 1591–1608, 2006, http://www.ann-geophys.net/24/1591/2006/.
Makarevitch, R. A., Honary, F., and Koustov, A. V.: Simultaneous HF measurements of E- and F-region Doppler velocity at large flow angles, Ann. Geophys., 22, 1177–1188, 2004,
http://www.ann-geophys.net/22/1177/2004/.
Mishin, E. V. and Mishin, V. M.: Prompt response of SAPS to stormtime substorm, J. Atmos. Sol. Terr. Phys., 69, 1233–1240, 2007.
Oksavik, K., Greenwald, R. A., Ruohoniemi, J. M., Hairston, M. R., Paxton, L. J., Baker, J. B. H., Gjerloev, J. W., and Barnes, R. J.: First observations of the temporal/spatial vari-ation of the sub-auroral polarizvari-ation stream from the Super-DARN Wallops HF radar, Geophys. Res. Lett., 33, L12104, doi: 10.1029/2006GL026256, 2006.
Parkinson, M. L., Pinnock, M., Ye, H., Hairston, M. R., Devlin, J. C., Dyson, P. L., Morris, R. J., and Ponomarenko, P.: On the lifetime and extent of an auroral westward flow channel (AWFC) observed during a magnetospheric substorm, Ann. Geophys., 21, 893–913, 2003,
http://www.ann-geophys.net/21/893/2003/.
Provan, G., Lester, M., Mende, S. B., and Milan, S. E.: Statistical study of high-latitude plasma flow during magnetospheric sub-storms, Ann. Geophys., 22, 3607–3624, 2004,
http://www.ann-geophys.net/22/3607/2004/.
Ruohoniemi, J. M., Greenwald, R. A., Baker, K. B., Villain, J.-P., and Hanuise, C.: Mapping high-latitude plasma convection with coherent HF radars, J. Geophys. Res., 94, 13 463–13 477, 1989. Sergeev, V. A., Shukhtina, M. A., Rasinkangas, R., Korth, A.,
Reeves, G. D., Singer, H. J., Thomsen, M. F., and Vagina, L. I.: Event study of deep energetic particle injections during sub-storm, J. Geophys. Res., 103, 9217–9234, 1998.
Southwood, D. J. and Wolf, R. A.: An assessment of the role of pre-cipitation in magnetospheric convection, J. Geophys. Res., 83, 5227–5232, 1978.
Spiro, R. W., Heelis, R. A., and Hanson, W. B.: Rapid subauroral ion drifts observed by Atmospheric Explorer C, Geophys. Res. Lett., 6, 657–660, 1979.
Unwin, R. S. and Cummack, C. H.: Drift-spikes; The ionospheric signature of large poleward directed electric fields at subauroral latitudes, Mem. Nat. Inst. Polar Res., 16, 72–83, 1980.
Wolf, R. A., Spiro, R. W., Sazykin, S., and Toffoletto, R.: How the Earth’s inner magnetosphere works: An evolving picture, J. Atmos. Sol. Terr. Phys., 69, 288–302, 2007.