HAL Id: hal-00297497
https://hal.archives-ouvertes.fr/hal-00297497
Submitted on 14 Oct 2004
HAL is a multi-disciplinary open access
archive for the deposit and dissemination of
sci-entific research documents, whether they are
pub-lished or not. The documents may come from
teaching and research institutions in France or
abroad, or from public or private research centers.
L’archive ouverte pluridisciplinaire HAL, est
destinée au dépôt et à la diffusion de documents
scientifiques de niveau recherche, publiés ou non,
émanant des établissements d’enseignement et de
recherche français ou étrangers, des laboratoires
publics ou privés.
Natural isotopic composition of nitrogen in suspended
particulate matter in the Bay of Bengal
S. Kumar, R. Ramesh, N. B. Bhosle, S. Sardesai, M. S. Sheshshayee
To cite this version:
S. Kumar, R. Ramesh, N. B. Bhosle, S. Sardesai, M. S. Sheshshayee. Natural isotopic composition of
nitrogen in suspended particulate matter in the Bay of Bengal. Biogeosciences, European Geosciences
Union, 2004, 1 (1), pp.63-70. �hal-00297497�
www.biogeosciences.net/bg/1/63/ SRef-ID: 1726-4189/bg/2004-1-63
Biogeosciences
Natural isotopic composition of nitrogen in suspended particulate
matter in the Bay of Bengal
S. Kumar1, R. Ramesh1, N. B. Bhosle2, S. Sardesai2, and M. S. Sheshshayee3
1Planetary and Geosciences Division, Physical Research Laboratory, Navrangpura, Ahmedabad- 380 009, India 2Chemical Oceanography Divivsion, National Institute of Oceanography, Dona Paula, Goa-403 004, India 3Department of Crop Physiology, University of Agricultural Sciences, GKVK Campus, Bangalore-560 065, India
Received: 26 April 2004 – Published in Biogeosciences Discussions: 4 June 2004 Revised: 11 September 2004 – Accepted: 6 October 2004 – Published: 14 October 2004
Abstract. We present the first measurements of nitrogen
isotopic composition (δ15N) in suspended particulate matter (SPM) of the surface Bay of Bengal (BOB) at 24 different lo-cations during pre- (April–May 2003) and post- (September– October 2002) monsoon seasons. The δ15N values of partic-ulate organic nitrogen (PON) in surface suspended matter of coastal and northern open BOB show mixing between con-tinental inputs and marine sources. Dilution by continen-tal material brought in by rivers leads to consistently lower
δ15N, evident from the relationship between surface salin-ity and δ15N. δ15N values of surface PON of open ocean locations during both seasons, and also at coastal locations during premonsoon suggest nitrate from deeper waters to be a predominant source of nutrients for phytoplankton. The depth profiles of δ15N of PON during the premonsoon sea-son at nine different locations indicate an increase in δ15N by a maximum of 2.8‰ between euphotic depth and 300 m. These changes are less than those observed in the far eastern Indian Ocean, indicating higher sinking rates of particles bal-lasted by aggregates of organic and mineral matter in BOB.
1 Introduction
Particulate organic matter (POM) is known to play an im-portant role in marine nitrogen and carbon cycles (Saino and Hattori, 1980). The study of the nitrogen isotope ra-tio 15N/14N (δ15N, expressed as deviation in per mil (‰) from that of atmospheric N2) of POM provides an insight
into the availability and utilization of nutrients and the trans-formation processes it undergoes during its transportation to greater depths. Several such studies have been done in dif-ferent parts of the world ocean (Wada and Hattori, 1976; Saino and Hattori, 1980; Altabet, 1996). Similar studies on ocean sediments have been used for the reconstruction of past
Correspondence to: S. Kumar
changes in surface ocean nutrient utilization (e.g. Altabet and Francois, 1994; Farrell et al., 1995).
The δ15N of the marine particulate organic nitrogen (PON) has a strong dependence on the δ15N of source nitrogen (at-mospheric N2, NO−3 and NH+4). δ15N of marine PON shows
a wide variation (Saino and Hattori, 1980; Altabet, 1988; Rau et al., 1998), due to the changes in δ15N of source, caused by fractionation of isotopes during various biogeo-chemical/biological processes involved during its formation. These processes are N2fixation, denitrification, nitrification,
and nitrate assimilation. Denitrification leads to 15N en-richment of the remaining nitrate while nitrification causes enrichment of 15N in the ammonium pool (Mariotti et al., 1984). Enrichment of up to 20‰ in the remaining pool has been found due to denitrification (Miyake and Wada, 1971; Cline and Kaplan, 1975), nitrification (Miyake and Wada, 1971) and nitrate assimilation (Wada et al., 1971). During the uptake of dissolved nitrogen in eutrophic waters, phytoplank-ton prefer14N to15N (Wada and Hattorri, 1978). Cynobac-terial fixation of atmospheric nitrogen is known to lower the
δ15N of PON (0.6‰; Emerson et al., 1991) because of the depleted source (atmospheric N2, 0‰). Therefore, the areas
with lower δ15N may involve N2fixation. Furthermore, the
δ15N of PON in marine organic matter also depends on phy-toplankton species (composition), physiology and the rate and phase of growth of phytoplankton (Montoya and Mc-Carthy, 1995).
This study reports the first detailed observations of δ15N of suspended PON in the Bay of Bengal (BOB), the east-ern counterpart of Arabian Sea in the northeast-ern Indian Ocean, where data on δ15N of suspended matter is scarce (Saino and Hattori, 1980). We examined the observed varia-tion in 15N and PON content in two different seasons i.e. post- (September–October 2002) and premonsoon (April– May 2003). The vertical profiles of δ15N in suspended matter at different locations, and the depth related changes during the premonsoon season are discussed.
64 S. Kumar et al.: Natural isotopic composition of nitrogen 66 72 78 84 90 66 72 78 84 90 30 6 12 18 24 30 6 12 18 24 Latitude (oE) L on gi tu d e ( oN ) Y amu n a G an ga G ha gh ara Kos i Gan dak Krishn a Kaveri Mahanadi Bh ima Brah map utra Godavar i 1 24 13 9 5 17 21 3 7 11 19 15 Bay of Bengal Arabian Sea
Fig. 1. Cruise track along which the study was performed during
both seasons. Major rivers draining into the Bay of Bengal are also shown. Dots are the stations.
2 Material and methods
Sampling was performed along the cruise track shown in Fig. 1, onboard ORV Sagar Kanya, as a part of Bay of Bengal process study (BOBPS). The duration of sampling was from 17 September to 11 October 2002 (postmonsoon; SK-182) and from 16 April to 6 May 2003 (premonsoon; SK-191). Surface seawater samples were collected using a clean plas-tic bucket and thirty litre Go Flo bottles attached to a CTD rosette were used to collect seawater samples from various depths (up to 500 m). Immediately after collection, four to six litres of sea water were filtered through a precombusted (400◦C for 4 h) Whatman GF/F glass fibre filter (47 mm di-ameter, 0.7 µm pore size). After the filtration the samples were dried at 60◦C and stored at room temperature for iso-topic analysis in the shore laboratory.
Measurements of nitrogen isotope ratio and PON were car-ried out using a Carlo Erba elemental analyser interfaced via ConfloIII to a Finnigan Delta Plus mass spectrometer. Due to the small amount of nitrogen gas recovered from the sam-ples (typically <1 µM N), for precise analysis, the method of Owens and Rees (1989) with a modification in oxygen injection time was used. Integration of areas under the mass-peaks 28, 29 and 30 after calibration with standard material (IAEA-NO-3, KNO3)of known stoichiometry provided the
measurement of PON. The advantage of this technique lies in the simultaneous measurement of isotope ratio and PON in the same sample. PON was measured to a precision of less than 10%, while that for δ15N was 0.3‰. δ15N measurement of the standard (IAEA-NO-3, KNO3, δ15N=4.7‰) yielded
a value of 4.9±0.3‰ (n=19). Ambient nitrate concentration
during present study was measured by the column reduction technique (Strickland and Parson, 1972).
3 Study area: hydrography and nutrients
The BOB is a semi-enclosed tropical basin in the northern Indian Ocean. It experiences seasonal changes in circula-tion and weather due to the seasonally reversing monsoons. BOB receives excess precipitation (∼2 m) and large quan-tities of freshwater influx (1.6×10¹²m3yr−1 compared to 0.3×10¹²m3yr−1of Arabian Sea; Subramanian, 1993) from the major rivers draining the Indian subcontinent. This fresh-water input results in considerable salinity variations dur-ing and after the monsoon over the whole basin, thereby inducing stratification of the upper 100m of the water col-umn (Prasanna Kumar et al., 2002). The surface salinity of the open ocean stations during postmonsoon decreased from south to north (34 psu at 7◦N to 32 psu at 16◦N) and dropped by 3 psu at 17◦N. The coastal stations showed a similar pat-tern of salinity but the drop was more pronounced from 16◦N to 17◦N (34 psu to 21 psu). During premonsoon the overall variation in salinity was between 32 to 34 psu.
Sea surface temperature (SST) during postmonsoon along open BOB varied marginally from 28.2 to 29◦C from south to north, while along coastal transect it did not show any trend and the average was around 30◦C. During premonsoon SST varied from 29 to 31.4◦C in the open ocean and showed a decrease of ∼2◦C from 14◦N to 15◦N. For the coastal loca-tions, it varied from 29.1◦C to 30.4◦C.
The riverine inputs are a major potential source of nutri-ents such as nitrate, phosphate and silica to the Bay. Also, one of the major suppliers of the nutrients to the surface Bay is mixing due to cyclones, frequent in the BOB during post-monsoon season. The formation of localized intense blooms and also the intensification of bloom generated by anticlonic gyre is known due to injection of nutrients by cy-clonic activity (Vinaychandran and Mathew, 2003). During the premonsoon period there is a poleward East India Coastal Current (EICC) active at north of 10◦N which brings cooler, more saline water with nutrients to the surface (Shetye et al., 1993). Upwelling has also been observed along the west-ern boundary of the basin in a 40 km wide band due to local longshore wind stress (Shetye et al., 1991). The measured ni-trate concentrations in the surface Bay are presented in Fig. 2. In general, the surface nitrate during postmonsoon was very low (mostly below detection limit, <0.1 µM) and for pre-monsoon it was mostly around 0.2 µM. However, it increased sharply between 40 and 60 m (maximum ∼15 µM and aver-age ∼7 µM during premonsoon). The Bay of Bengal water is well oxygenated relative to the Arabian Sea. During the pre-monsoon oxygen concentrations ranging from 150–175 µM in surface mixed layer were observed in open and coastal regions. During the postmonsoon oxygen minimum zone (OMZ) with oxygen concentration <10 µM was observed
0 2 4 6 8 10 12 14 0.0 0.2 0.4 0.6 0.8 1.0 1.2 p o stmo n so o n Premonsoon
Stations
14 16 18 20 22 24 0.0 0.2 0.4 0.6 0.8 1.0 1.2 Postmonsoon PremonsoonNitrate
(
µ
M)
Fig. 2. Surface nitrate concentrations at different stations during
post- (dark bars) and pre- (light bars) monsoon. The absence of bars indicates values below the detection limit (<0.1 µM).
between depths of around 60 to 400 m from 14 to 20◦N in the open Bay. During premonsoon the OMZ was confined to a smaller area i.e. from 19 to 20◦N between 80 to 120 m which extended to 14◦N between 100 to 300 m. OMZ was much thicker and was seen from 11 to 20◦N between approx-imately 120 to 500 m in the coastal region during postmon-soon but showed shoaling up to 60 m around 17◦N during premonsoon. Pockets of very low concentration of oxygen (<5 µM) were also observed in the coastal region. Despite such low oxygen concentrations significant secondary nitrite levels or decrease in nitrate levels in the region of OMZ to suggest denitrification during the study period were not en-countered.
4 Results
Stations studied are divided into two transects: one along the 88◦E longitude (Stn.1–Stn.13), defined here as open ocean stations (transect) and the other parallel to the Indian coast (Stn.14 to Stn.24) as the coastal stations (transect).
0.0 0.5 1.0 1.5 2.0 2.5 3.0 1 2 3 4 5 6 7 8
PON (µM N)
δ
1 5N
(
%
o)
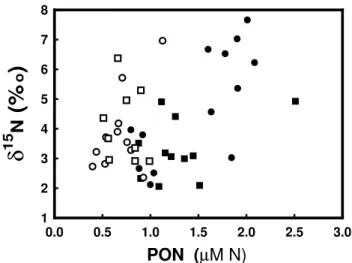
Fig. 3. The relationship between δ15N and PON during post- (filled
circles and squares represent open ocean and coastal stations) and premonsoon (open circle and squares represent open ocean and coastal stations).
4.1 Surface suspended matter
Overall, it has been observed that the average surface PON concentration during postmonsoon season (1.4 µM N) is nearly twice that of premonsoon (0.7 µM N). During the postmonsoon the difference in average coastal (1.3 µM N) and open ocean (1.4 µM N) surface PON is insignificant. The same is true for the premonsoon season, where it averages 0.7 µM N for coastal and 0.6 µM N for open ocean locations. During the whole period of study, the maximum surface PON of 2.5 µM N has been observed at Stn.15, which is the near-est to the coast with the shallownear-est water column depth of 620 m. The δ15N values of surface PON for both pre- and postmonsoon season range from 2 to 7.6‰ and fall in the general range of known oceanic PON δ15N. The overall δ15N of surface PON averages around 4.1‰ for postmonsoon and 3.8‰ for premonsoon season, which agree within analyti-cal error. There is a significant difference of 1.5‰ between average δ15N of open ocean (4.8‰) and coastal (3.3‰) sta-tions during postmonsoon. However, no such difference has been observed for the samples collected during premonsoon, where both average around 4‰. There is no significant lati-tudinal variation in δ15N during either season. There exists a positive linear correlation between PON and δ15N (Fig. 3). This relationship is more significant during postmonsoon (R2=0.42, n=24, p=0.005; δ15N=2.35*PON+0.78) than pre-monsoon (R2=0.21, n=22, p=0.025; δ15N=4.05*PON+0.74). During postmonsoon the coastal stations show less variabil-ity and data points lie in the lower regime i.e. low PON- low
δ15N zone. On the other hand, the open ocean stations show two clusters of data points, one with low PON-low δ15N which averages around 3.0‰ and other with high PON-high
66 S. Kumar et al.: Natural isotopic composition of nitrogen cut distinction exists between δ15N of PON in coastal and
open ocean transects.
4.2 Depth profiles of suspended matter
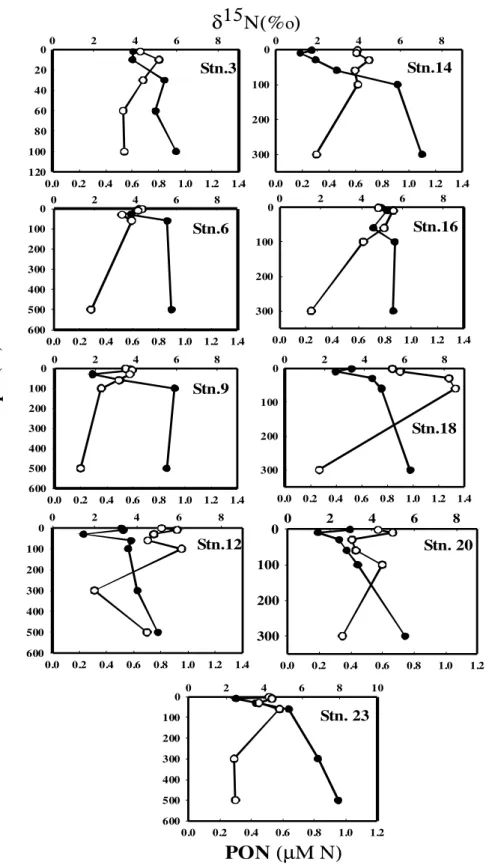
Figure 4 presents the vertical profiles of δ15N and PON for
premonsoon season at different locations upto 300 m or more except Stn.3, where it is only up to 100 m. Average δ15N of PON in the top ∼60 m varies between 1.9 to 4.9‰ for dif-ferent stations with an average of 4.2‰. Below this, δ15N increases with depth and reaches an average value of 5.9‰ at 300 m. For the open ocean stations the average euphotic zone δ15N shows a decreasing trend from south to north with a maximum of 4.5‰ for southernmost station (Stn.23) and minimum of 2.9‰ for northern station (Stn.12). δ15N also shows subsurface minima between 10 to 60 m varying with location. PON, in general, decreases with depth showing subsurface maxima within the euphotic zone. Euphotic zone average of PON is 0.7 µM N which decreases to 0.3 µM N at 300 m.
5 Discussion
In oceanic environments, PON is mainly derived form phy-toplankton, micro-zooplankton, bacteria and detritus. The nitrogen isotopic signature of PON in suspended matter de-pends on the isotopic fractionation associated with its for-mation, and in turn upon the isotopic composition of inor-ganic form of dissolved nitrogenous sources (such as NO−3, 3–7‰; NH+4, 6–8‰; and atmospheric N2, 0‰; Miyake and
Wada, 1967) available for the utilization by phytoplankton. The variation in δ15N of PON reveals the utilization of dif-ferent nitrogen sources by planktons as these sources have distinct isotopic compositions. Microscopic study suggested absence of Trichodesmium during the postmonsoon and di-atoms were found to be the dominant species. However, there were sporadic occurrences of Trichodesmium during premonsoon but it did not dominate in terms of N contribu-tion to the PON (N. Ramaiah, personal communicacontribu-tion). Our
δ15N data also precludes the possibility of significant N2
fix-ation in BOB, as the cyanobacteria Trichodesmium; a well known N2 fixer generates PON with a δ15N value (0.6‰)
nearer to the atmospheric N2 in equilibrium with seawater
(Emerson et al., 1991). δ15N values around −2 to 0‰ has also been reported for cyanobacteria Trichodesmium (Mina-gawa and Wada, 1986). All our δ15N data are above the re-quired value for an area dominated by N2fixers.
5.1 Surface suspended matter
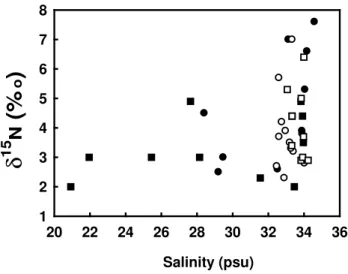
For the purpose of discussion, stations in BOB may be clas-sified into two based on the surface salinity of the stations. The first includes the stations with salinity less than 32 psu (the six coastal stations and three open ocean stations during postmonsoon; Fig. 5) and second includes the stations with
surface salinity more than 32 psu (all the rest). The former are influenced by the riverine discharge whereas the latter are not.
The salinity and δ15N of suspended PON (Fig. 5) for the two seasons indicate that when salinity is low (<32 psu), the
δ15N is consistently on the lower side (2–3‰) (except at one location each in coastal and open ocean, which have δ15N values of 4.9 and 4.6‰ respectively). The rivers draining the BOB bring a lot of terrestrial organic as well as detrital ma-terial (Unger et al., 2003). The consistent low δ15N suggests that isotopic signature of PON at these locations have been influenced by terrestrial inputs. Terrestrial particulate matter, brought by major rivers, might have diluted the overall δ15N signal of PON, although there exists no literature regarding the δ15N of such particulate matter draining into BOB. But, the naturally occurring land derived materials are known to have low δ15N (mean of 2.5‰ for terrestrial organic mat-ter, Sweeney et al., 1978; and 1.5‰ for terrestrial detrital component, Mariotti et al., 1984). Also, the C:N values in suspended matter during postmonsoon at locations under ter-restrial influence have been found to be relatively higher (9.5, 9.3 and 8.2 at stations 12, 16 and 18 respectively) compared to stations without influence (5, 3.4, 4.6, 6.2 and 6.4 for sta-tions 3, 6,9,20 and 23 respectively), indicating the contribu-tion of continental inputs at these stacontribu-tions.
The stations which are not influenced by riverine discharge show a wide isotopic variability (2–7.6‰). However, high average δ15N of surface suspended matter (5.3‰ for open ocean stations during postmonsoon and 4‰ for both open and coastal stations during premonsoon) have been observed for these stations. Since these locations are unaffected by the terrestrial influence the variability observed may be at-tributed to the two possible reasons: first, uptake of regener-ated ammonium (Wada and Hattori, 1976); and second, sup-ply of nitrate from deeper waters due to the presence of shal-low nitracline, which is between 50–100 m (Prasanna Kumar et al., 2002).
In the former case, regenerated ammonium produced by excretion of zooplankton and heterotrophs in the surface layer has been considered as a source. In most oceanic re-gions, ammonium is the preferred substrate and normally does not accumulate in the surface layer (Mino et al., 2002). Soon after regeneration of ammonium, it is rapidly taken up by the algae; there is little time for isotopic fractionation and the δ15N of ammonium is imprinted in PON without much modification. Unfortunately, δ15N of ammonium in the BOB has not been measured to directly assess the role of ammonium on δ15N of PON. Values in the range of 6–8‰ have been reported for ammonium in other oceans (Miyake and Wada, 1967). However, indirect estimation of degree of contribution of ammonium in δ15N of PON may be ob-tained from new production (Dugdale and Goering, 1967) measurements in the region (Kumar et al., 2004). If the new production is less, there could be a prominent effect of the regenerated ammonium on the δ15N of PON. But in BOB, in
0 2 4 6 8 10 0 100 200 300 400 500 600 0.0 0.2 0.4 0.6 0.8 1.0 1.2 0 2 4 6 8 0 20 40 60 80 100 120 0.0 0.2 0.4 0.6 0.8 1.0 1.2 1.4 Stn.3 0 2 4 6 8 0 100 200 300 400 500 600 0.0 0.2 0.4 0.6 0.8 1.0 1.2 1.4 Stn.6 0 2 4 6 8 0 100 200 300 400 500 600 0.0 0.2 0.4 0.6 0.8 1.0 1.2 1.4 Stn.9 0 2 4 6 8 0 100 200 300 400 500 600 0.0 0.2 0.4 0.6 0.8 1.0 1.2 1.4 Stn.12 0 2 4 6 8 0 100 200 300 0.0 0.2 0.4 0.6 0.8 1.0 1.2 1.4 Stn.14 0 2 4 6 8 0 100 200 300 0.0 0.2 0.4 0.6 0.8 1.0 1.2 1.4 Stn.16 0 2 4 6 8 0 100 200 300 0.0 0.2 0.4 0.6 0.8 1.0 1.2 1.4 Stn.18 0 2 4 6 8 0 100 200 300 0.0 0.2 0.4 0.6 0.8 1.0 1.2 Stn. 20 Stn. 23
PON
(µΜ Ν)
δ15Ν(% )
οD
ep
th
(m
)
Fig. 4. The depth profiles of δ15N and PON during premonsoon at different stations. The filled and unfilled circles indicate δ15N and PON
68 S. Kumar et al.: Natural isotopic composition of nitrogen 20 22 24 26 28 30 32 34 36 1 2 3 4 5 6 7 8 Salinity (psu)
δ
1 5N
(
%
o)
Fig. 5. The relationship between salinity and δ15N for pre- and
postmonsoon seasons. Legend same as Fig. 3.
general, high new production has been observed by us dur-ing both post- (average ∼4 mmol N m−2d−1)and pre- (av-erage ∼5.4 mmol N m−2d−1)monsoon. Therefore, regener-ated ammonium is likely to have played a limited role in ob-served δ15N of PON. However, significant ammonium con-tributions cannot be ruled out for three locations in the open ocean during postmonsoon and at one location during pre-monsoon, where values higher than 6‰ have been observed. The nitrate from deeper water is a known source of nutri-ents in the Indian Ocean for phytoplankton (Vinaychandran and Mathew, 2003); however, its possible imprint on δ15N of PON and related fractionation mechanism could only be esti-mated if the nitrate δ15N is known. But, as in the case of am-monium, nitrate δ15N has also not been measured in the Bay.
δ15N values of 3–7‰ have been reported for nitrate in deeper waters lacking significant column denitrification as in BOB (Miyake and Wada, 1967; Cline and Kaplan, 1975). The av-erage value reported here for δ15N of PON in open ocean during both post- and premonsoon seasons (5.3 and 4%) are found to be of similar magnitude. However, the observed variability can be explained in two different ways: first, the rapid uptake of the nitrate without fractionation and second, the fractionation of nitrate during uptake by the phytoplank-ton. In the first scenario, the consumption of nitrate has to be fast enough for little or no isotopic fractionation and the orig-inal δ15N of nitrate would be reflected in the δ15N of PON (Altabet and McCarthy, 1985; Wada and Hattori, 1991). In this case, complete consumption of nitrate from the surface would be expected. The open ocean stations during post-monsoon show the virtual absence of nitrate (below the level of detection; Fig. 2) from the surface, implying its complete consumption. However, there is variability (2.1 to 7.6‰) in the δ15N of PON at these open ocean stations despite unde-tectable ambient nitrate. Out of the thirteen stations, ten have
δ15N ranging from 3 and 7.6‰, falling in the range of δ15N
Table 1. δ15N of particulate organic nitrogen in surface suspended
matter from different oceanic regions of the world.
Oceanic regions δ15N (‰) References
Southern Ocean
Subantarctic zone ∼1 Lourey et al. (2003)
Polar Frontal zone 0 to −4 Lourey et al. (2003)
Atlantic Ocean −0.8 to 5.4 Mino et al. (2002)
Monterey Bay 1.3 to 7.6 Rau et al. (1998)
Sargasso Sea (annual Av) 0.2 Altabet (1988)
Northeastern Indian Ocean 2.1 to 10.1 Saino and Hattori (1980)
Bay of Bengal 2 to 7.6 Present Study
for oceanic nitrate as mentioned earlier. This variability in
δ15N of PON indicates the possibility of change in isotopic composition of source nitrate. δ15N for 3 stations falls below 3‰ and cannot be explained by above mentioned complete consumption argument.
The δ15N at premonsoon locations vary from 2.7 to 7‰ with relatively higher surface nitrate concentration (0.2 to 1.1 µM). This availability of nitrate pool in the surface water suggests that the phytoplankton have the luxury of discrimi-nating in favour of14N during uptake. The exact mechanism by which these nutrients reach the surface in the open Bay during premonsoon is a subject of speculation. However, nitrate for coastal locations during premonsoon might have been supplied by the EICC acting north of about 10◦N. The EICC is best developed during March-Apr and decays only by June (Shetye et al., 1993).
As mentioned earlier, δ15N of suspended matter in BOB varies from 2 to 7.6‰ falling in the known oceanic range (−5 to +15‰; Wada and Hattori, 1991). However, the latter is known to fall in different ranges depending on the nitro-gen source and fractionation by the phytoplankton. Table 1 compares a few recent studies of δ15N in suspended mat-ter of the world ocean. Rau et al. (1998) observed values in the Monterey Bay varying beween 1.3 to 7.6‰, similar to our range. Mino et al. (2002) have studied near surface waters along 50◦N to 50◦S in the Atlantic Ocean and the values ranged from −0.8 to 5.4‰. The negative relationship between δ15N of PON and nitrate concentration as observed by Rau et al. (1998) and Mino et al. (2002) was not observed by us. Relatively higher values (4–6‰) observed by Mino et al. (2002) have been attributed to the rapid consumption of nitrate from deeper waters similar to a few open ocean stations during the postmonsoon of the present study.
Overall, the δ15N values of PON in the surface waters observed in the Bay may be explained in terms of mixing between (i) the terrestrial particulate matter with low δ15N, which has mostly influenced the six coastal locations and three open ocean locations during postmonsoon, and (ii) ma-rine phytoplankton, which has mainly inherited the δ15N of
nitrate from deeper waters. However, the phytoplankton have a wide spectrum of values because of two extremes: one due to uptake of nitrate without fractionation (highest δ15N) and other with high degree of fractionation (lowest δ15N). 5.2 Depth profile of δ15N suspended matter
The depth related distribution of δ15N in suspended matter is in agreement with the general pattern observed in the world ocean i.e. it increases with depth (Saino and Hattori, 1980). At most locations there is an increase in δ15N below 60 m. This increase is 0.21 to 2.8‰ between 60 and 300 m. High
δ15N below euphotic depth has been observed mainly due to two reasons: (1) degradation of suspended matter itself caus-ing the preferential release of14N leaving the remaining PON enriched in15N. (2) Production of PON due to fragmentation of sinking particles below the euphotic depth (Bacon et al., 1985). These sinking particles are enriched in δ15N by 3–4‰ relative to suspended particle in euphotic zone because these particles are formed as a by-product of zooplankton feeding, causing an increase in δ15N with each trophic step (DeNiro and Epstein, 1981). There is no data regarding δ15N of sink-ing particles for BOB at 300 or 500 m depths. However, the sediment traps placed at around 2000 m show δ15N variation in the range of 2.2–6.2‰ (Schafer and Ittekkot, 1995). But
δ15N of deeper PON (∼2000 m) is known to be less (Saino and Hattori, 1987) as it starts decreasing below 500 m. Based on this argument the δ15N of sinking particles around 300 m during the present study should have been more than 6‰. Saino and Hattori (1980) have found δ15N as high as ∼12‰ at 300 m depth in the far eastern Indian Ocean. However our data suggest the average value of ∼6‰ for BOB at the same depth. This may be due to the high sinking rate of particles in the BOB allowing it lesser time for degradation. Here, the particle removal to the deep sea occurs in the form of large aggregates formed by the interaction of organic and mineral matter introduced from external sources like rivers and wind. This increases their density and consequently the settling rate in water column (Ittekkot, 1991). Minima in the
δ15N of PON within the surface layer as reported by Saino and Hattori (1980), has been observed during present study too, possibly due to the isotopic fractionation during nitrate uptake in light limited conditions.
6 Conclusions
The first systematic measurements of δ15N of surface PON in BOB shows it to be a mixing between continental inputs and marine phytoplankton which consumes NO−3 with or with-out fractionation. δ15N values and spatial salinity variation suggest that the surface PON of open ocean locations during both pre and postmonsoon and coastal locations during pre-monsoon is primarily supported by nutrients of marine ori-gin. However, during postmonsoon coastal as well as
north-ern open ocean stations are influenced by the continental run off, which leads to a dilution of δ15N. The depth dependent increase in δ15N of suspended PON appears to be a general feature. This increase to a maximum of 2.8‰ is lower than that observed for the eastern Indian Ocean (Saino and Hat-tori, 1980) possibly due to the high settling rates of sinking particles in BOB.
Acknowledgements. We thank M. Madhupratap (deceased),
co-ordinator, BOBPS and S. Prasanna Kumar, Chief Scientist, SK-182 and SK-191, for the opportunity to participate in the cruises. We also thank the Department of Ocean Development for providing the ship time to carry out this work, funded by ISRO-GBP, Department of Space, Government of India.
Edited by: J. Chanton
References
Altabet, M. A. and McCarthy, J. J.: Temporal and spatial variations
in the natural abundance of15N in PON from warm core ring,
Deep Sea Res., Part A, 32, 755–772, 1985.
Altabet, M. A.: Variations in nitrogen isotopic composition between sinking and suspended particles: Implications for nitrogen cy-cling and particle transformation in the open ocean, Deep Sea Res., Part A, 35, 535–554, 1988.
Altabet, M. A. and Francois, R.: The use of nitrogen isotopic ratio for reconstruction of past changes in the surface ocean nutrient utilization, Carbon Cycling in the Glacial Ocean: Constraints on the Ocean’s Role in Global Change, edited by: Zahn, R., Kamin-ski, M. A., Labeyrie, L., and Pederson, T. F., Springer-Verlag, New York, 281–306,1994.
Altabet, M. A.: Nitrogen and carbon isotopic tracers of the source and transformation of particles in the deep sea, Particle Flux in the Ocean, edited by: Ittekkot, V., Schafer, P., Honjo, S., and Depetris, P. J., John Wiley, New York, 155–184, 1996.
Bacon, M. P., Huh, C. A., Fleer, A. P., and Deuser, W. G.: Seasonal-ity in the flux of natural radionuclides and plutonium in the deep Sargasso Sea, J. Mar. Res., 44, 185–201, 1985.
Cline, J. D. and Kaplan, I. R.: Isotopic fractionation of dissolved nitrate during denitrification in the eastern tropical North Pacific Ocean, Mar. Chem., 3, 271–299, 1975.
DeNiro, M. J. and Epstein, S.: Influence of diet on the distribution of nitrogen isotopes in animals, Geochimica et Cosmochimica Acta, 45, 341–351, 1981.
Dugdale, R. C. and Goering, J. J.: Uptake of new and regenerated forms of nitrogen in primary productivity, Limnol. Oceanogr., 12, 196–206, 1967.
Emerson, S. P., Quay, P., Stump, C., Wilbur, S., and Knox, M.:
O2, Ar, N2and222Rn in surface waters of subarctic ocean: net
biological O2production, Global Biogeochemical Cycles, 5, 49–
69, 1991.
Farrell, J. W., Pederson, T. F., Calvert, S. E., and Nielsen, B.: Glacial-interglacial changes in nutrient utilization in equatorial Pacific Ocean, Nature, 377, 514–517, 1995.
Ittekkot, V.: Particle flux studies in the Indian Ocean, Eos, 72, 527-530, 1991.
Kumar, S., Ramesh, R., Sardesai, S., and Seshshayee, S.:
70 S. Kumar et al.: Natural isotopic composition of nitrogen
causes and implications, Geophys. Res. Lett., 31, L18304, doi:10.1029/2004GL021005, 2004.
Lourey, M. J., Trull, T. W., and Sigman, D. M.:
Sensitiv-ity of δ15N of nitrate, surface suspended and deep
sink-ing particulate nitrogen to seasonal nitrate depletion in the Southern Ocean, Global Biogeochemical Cycles, 17(3), 1081, doi:10.1029/2001GB001973, 2003.
Mariotti, A., Lancelot, C., and Billen, G.: Natural isotopic com-position of nitrogen as a tracer of origin for suspended organic matter in the Scheldt estuary, Geochim. Cosmochim. Acta, 48, 549–555, 1984.
Minagawa, M. and Wada, E.: Nitrogen isotope ratios of red tide organisms in the East Chine Sea: A characterization of biological nitrogen fixation, Mar. chem., 19, 245–259, 1986.
Mino, Y., Saino, T., Suzuki, K., and Maranon, E.: Isotopic
com-position of suspended particulate nitrogen (δ15Nsus)in surface
waters of the Atlantic Ocean from 50◦N to 50◦S, Global
Bio-geochemical Cycles, 16, 4, 1059, doi:10.1029/2001GB001635, 2002.
Miyake, Y. and Wada, E.: The abundance ratio of15N/14N in
ma-rine environments, Rec. Oceanogr. Works Jpn. 9, 37–53, 1967. Miyake, Y. and Wada, E.: The isotope effect on the nitrogen in
bio-chemical, oxidation-reduction reactions, Rec. Oceanogr. Works Jpn. 11, 1–6, 1971.
Montoya, J. P. and McCarthy, J. J.: Isotopic fractionation during nitrate uptake by phytoplankton grown in continuous culture, J. Plankton Res., 17, 439–464, 1995.
Owens, N. J. P. and Rees, A. P.: Determination of nitrogen-15 at sub-microgram levels of nitrogen using automated continuous-flow isotope ratio mass spectrometer, Analyst, 114, 1655–1657, 1989.
Prasanna Kumar, S., Muraleedharan, P. M., Prasad, T. G., Gauns, M., Ramaiah, N., De Souza, S. N., Sardesai, S., and Mad-hupratap, M.: Why is the Bay of Bengal less productive during summer monsoon compared to the Arabian Sea? Geophysical Research Letters, 29 (24), 2235, doi:10.1029/2002GL016013, 2002.
Rau, G. H., Low, C., Pennington, J. T., Buck, K. R., and Chavez,
F. P.: Suspended particulate nitrogen δ15N versus nitrate
utiliza-tion: Observations in Montery Bay, CA, Deep Sea Res., Part II, 45, 1603–1616, 1998.
Saino, T. and Hattori, A.: 15N natural abundance in oceanic
sus-pended particulate matter, Nature, 283, 752–754, 1980.
Saino T. and Hattori, A.: Geographical variation of the water
col-umn distribution of suspended particulate nitrogen and its15N
natural abundance in the Pacific and its marginal seas, Deep Sea Research, 34, 807–827, 1987.
Schafer, P. and Ittekkot, V.: Isotopic biogeochemistry of nitrogen in the northern Indian Ocean, Mitt. Geol. -Palaont. Inst. Univ. Hamburg, 78, 67–93, 1995.
Shetye, S. R., Shenoi, S. S. C., Gouveia, A. D., Michael, G. S., Sun-dar, D., and Nampoothiri, G.: Wind- driven coastal upwelling along the western boundary of the Bay of Bengal during the southwest monsoon, Cont. Shelf Res., 11, 1397–1408, 1991. Shetye, S. R., Gouveia, A. D., Shenoi, S. S. C., Sundar, D., Michael,
G. S., and Nampoothiri, G.: The western boundary current of the seasonal subtropical gyre in the Bay of Bengal, J. Geophys. Res., 98, 945–954, 1993.
Strickland, J. D. H. and Parson, T. R.: A practical handbook of seawater analysis, Fisheries Research Board, Canada, 127–130, 1972.
Subramanian, V.: Sediment load of Indian Rivers, Current Science, 64, 928–930, 1993.
Sweeney, R. E., Liu, K. K., and Kaplan, I. R.: Oceanic nitrogen iso-topes and their use in determining the source of sedimentary ni-trogen, in: Stable isotopes in the earth sciences, edited by Robin-son, B.W., DSIR 220 New Zealand dept. Scientific and industrial, Wellington, 9–26, 1978.
Unger, D., Ittekkot, V., Schafer, P., Tiemann, J., and Reschke, S.: Seasonality and interannual variability of particle fluxes to the deep Bay of Bengal: influence of riverine input and oceano-graphic processes, Deep Sea Res. II, 50, 897–923, 2003. Vinaychandran, P. N. and Mathew, S.: Phytoplankton bloom in
the Bay of Bengal during the northeast monsoon and its in-tensification by cyclones, Geophys. Res. Lett., 30 (11), 1572, doi:10.1029/2002GL016717, 2003.
Wada, E., Miyazaki, T., and Hattori, A.:15N abundance in
nitroge-nous compounds in the sea, Proc. 1971 Fall Meet. Oceanogr. Soc. Japan, 227–231, 1971.
Wada, E. and Hattori, A.: Natural abundance of15N in
particu-late organic matter in the North Pacific Ocean, Geochim. Cos-mochim. Acta, 40, 249–251, 1976.
Wada, E. and Hattori, A.: Nitrogen isotope effects in the assimi-lation of inorganic nitrogenous compounds by marine diatoms, Geomicrobiol. J., 1, 85–101, 1978.
Wada, E. and Hattori, A.: Nitrogen in the sea: Forms, Abundances, and rate processes, CRC Press, Boca Raton, Fla, 208–212, 1991.