HAL Id: hal-00298920
https://hal.archives-ouvertes.fr/hal-00298920
Submitted on 4 Jan 2008HAL is a multi-disciplinary open access
archive for the deposit and dissemination of sci-entific research documents, whether they are pub-lished or not. The documents may come from teaching and research institutions in France or abroad, or from public or private research centers.
L’archive ouverte pluridisciplinaire HAL, est destinée au dépôt et à la diffusion de documents scientifiques de niveau recherche, publiés ou non, émanant des établissements d’enseignement et de recherche français ou étrangers, des laboratoires publics ou privés.
Food consumption patterns and their effect on water
requirement in China
J. Liu, H. H. G. Savenije
To cite this version:
J. Liu, H. H. G. Savenije. Food consumption patterns and their effect on water requirement in China. Hydrology and Earth System Sciences Discussions, European Geosciences Union, 2008, 5 (1), pp.27-50. �hal-00298920�
HESSD
5, 27–50, 2008 Effect of food consumption on water J. Liu and H. H. G. Savenije Title Page Abstract Introduction Conclusions References Tables Figures ◭ ◮ ◭ ◮ Back Close Full Screen / EscPrinter-friendly Version Interactive Discussion Hydrol. Earth Syst. Sci. Discuss., 5, 27–50, 2008
www.hydrol-earth-syst-sci-discuss.net/5/27/2008/ © Author(s) 2008. This work is licensed
under a Creative Commons License.
Hydrology and Earth System Sciences Discussions
Papers published in Hydrology and Earth System Sciences Discussions are under open-access review for the journal Hydrology and Earth System Sciences
Food consumption patterns and their
effect on water requirement in China
J. Liu1and H. H. G. Savenije2,3
1
Swiss Federal Institute of Aquatic Science and Technology (Eawag), Ueberlandstrasse 133, 8600, Duebendorf, Switzerland
2
UNESCO-IHE, Delft, The Netherlands
3
Delft University of Technology, P.O. Box 5048, 2601 DA, Delft, The Netherlands Received: 24 October 2007 – Accepted: 30 October 2007 – Published: 4 January 2008 Correspondence to: Junguo Liu ([email protected])
HESSD
5, 27–50, 2008 Effect of food consumption on water J. Liu and H. H. G. Savenije Title Page Abstract Introduction Conclusions References Tables Figures ◭ ◮ ◭ ◮ Back Close Full Screen / EscPrinter-friendly Version Interactive Discussion
Abstract
It is widely recognized that food consumption patterns significantly impact water re-quirements. The aim of this paper is to quantify how food consumption patterns influ-ence water requirements in China. The findings show that per capita water requirement for food (CWRF) has increased from 250 m3cap−1y−1 in 1961 to 780 m3cap−1y−1
5
in 2003, largely due to an increase in the consumption of animal products in recent decades. Although steadily increasing, the CWRF of China is still much lower than that of many developed countries. The total water requirement for food (TWRF) has been determined as 1023 km3y−1 in 2003. Three scenarios are proposed to project future TWRF, representing low, medium, and high levels of modernization (S1, S2, and
10
S3, respectively). Analysis of these three scenarios indicates that TWRF will reach a maximum between 2020 and 2025, after which it is expected to decline. Accord-ing to S2, the shift in food consumption patterns together with population growth may lead to an additional amount of required water of 114 km3y−1 in 2025, even after tak-ing technological advances into consideration. This will undoubtedly put high pressure
15
on China’s already scarce water resources. China needs to strengthen “green water” management and to take advantage of “virtual water” import to meet the additional TWRF.
1 Introduction
Besides population growth and externalities of uncontrolled economic growth, water
20
scarcity is more and more recognized as a major threat to sustainable development (Koudstaal et al., 1992; Postel et al., 1996; V ¨or ¨osmarty et al., 2000; Oki and Kanae, 2006). While water stress is often a direct result of population growth and economic development, this paper shows that changing consumption patterns may potentially be-come the main cause of water scarcity. Currently, approximately one third of the world’s
25
population lives in countries suffering water stress (Oki and Kanae, 2006). Many au-28
HESSD
5, 27–50, 2008 Effect of food consumption on water J. Liu and H. H. G. Savenije Title Page Abstract Introduction Conclusions References Tables Figures ◭ ◮ ◭ ◮ Back Close Full Screen / EscPrinter-friendly Version Interactive Discussion thors have projected that a large share of the world’s population – up to two-thirds –
will be affected by water scarcity over the next decades (Shiklomanov, 1991; Raskin et al., 1997; Seckler et al., 1998; Alcamo et al., 2000; V ¨or ¨osmarty et al., 2000; Oki and Kanae, 2006).
The problem of water scarcity, in essence, originates from insufficient water for the
5
production of food. Almost 90% of an individual’s water requirement is needed for food production (Savenije, 2000). As a general rule, about 1-2 m3of water is required to pro-duce 1 kg of cereal (Allan, 1998; Yang et al., 2003). More water is needed to propro-duce one kilogram of meat. For example, it takes about 13.5 m3of water to produce 1 kg of beef in California (Rijsberman, 2006). This means that the water requirement for
con-10
suming 1 kg of beef is equivalent to almost three-fourths of the recommended human’s annual basic water requirement for drinking, human hygiene, sanitation, and modest household needs for preparing food (i.e. 50 liters cap−1d−1 per d, or 18 m3cap−1y−1) (Gleick, 1996).
A human being “eats” thousands of liters of water each day; however, the exact
15
amount largely depends on food consumption patterns. Renault and Wallender (2000) estimated that a typical American diet requires twice as much water as a vegetarian diet with the same nutritional intake. Unraveling the effects of various food consumption patterns on water requirement help formulate appropriate water and food policies.
This paper aims to quantitatively examine the effects of food consumption patterns
20
on water requirements in China. China has been selected for three reasons. First, with a population of about 1.3 billion, China feeds the largest number of consumers in the world; second, the constraint of water scarcity on food production has led to growing concerns regarding China’s food production, food security, and their impacts on the global food market (Liu et al., 2007b); third, China has experienced fast economic
25
growth with an annual GDP growth rate of 8% over the past two decades; the highest rate in recent world history. Consumers’ incomes have risen substantially, resulting in a rapid dietary change towards more meat consumption (FAO, 2006; Du et al., 2004). The shift in food consumption patterns will undoubtedly have profound effects on water
HESSD
5, 27–50, 2008 Effect of food consumption on water J. Liu and H. H. G. Savenije Title Page Abstract Introduction Conclusions References Tables Figures ◭ ◮ ◭ ◮ Back Close Full Screen / EscPrinter-friendly Version Interactive Discussion requirements, but in-depth analysis on these effects is rarely found in literature.
2 Materials and methods
2.1 Food requirements at three scale levels
In this paper, food requirements are classified into three levels of scale: the basic level, the subsistence level and the cultural level, as suggested by Gerbens-Leenes and
5
Nonhebel (2002). At the basic level, food requirements are only sufficient to prevent starvation, but one may suffer from malnutrition in the long run because many essen-tial nutrients are lacking. At this level, the main purpose of food intake is to provide enough energy for basic survival and physical activity. At the subsistence level, food requirements are based on a selected number of nutrient-dense foods recommended
10
that enable one to lead a healthy life over an entire life span. At the cultural level, food requirements correspond to the actual consumption pattern, which is embedded in different types and quantities of food and their combination in different dishes or meals. In order to analyze food requirements at the cultural level, food items have been grouped in six categories: (1) cereals and starchy roots (including rice, wheat,
15
maize, other cereals, potatoes and other starchy roots); (2) sugar and sweeteners; (3) oil crops and vegetable oils; (4) vegetables and fruits; (5) alcoholic beverages; and (6) animal products (including beef, pork, poultry, mutton and goat, fish and seafood, eggs, milk, animal fats). In 2003, these foods accounted for 98% of both the total food consumption in weight and the total calorie intake (FAO, 2006).
20
2.2 Virtual water content (VWC)
VWC can be defined as the volume of water used to produce a unit of a product at the place where the product was actually produced, or it can also be defined as the volume of water that would have been required to produce the product in the place where the
HESSD
5, 27–50, 2008 Effect of food consumption on water J. Liu and H. H. G. Savenije Title Page Abstract Introduction Conclusions References Tables Figures ◭ ◮ ◭ ◮ Back Close Full Screen / EscPrinter-friendly Version Interactive Discussion product is consumed (Chapagain and Hoekstra, 2004). In China, food consumption
mainly originates from domestic food production. Food imports are marginal compared to domestic production. For example, in 2003, the imports of cereals and meats were only equivalent to about 3% of the domestic production in weight (FAO, 2006). Due to the small share of food imports, the VWC values are determined on the basis of
5
China’s specific production conditions. The VWC of cereals, soybean, vegetables and fruits is obtained from Liu et al. (2007b), who estimated VWC based on yields and evaporation in the major producing regions in China. The VWC of meats, eggs, milk, sugar and sweeteners, vegetable oils, and alcoholic beverages has been taken from Chapagain and Hoekstra (2004). The VWC of fish and seafood is from Zimmer and
10
Renault (2003).
2.3 Energy water productivity
Energy water productivity is defined as the caloric energy produced by one unit of wa-ter, and is calculated by dividing energy content by VWC. The data on energy content have been taken from FAO Food Balance Sheets for China’s food consumption in 2003
15
(FAO, 2006).
2.4 Per capita water requirement for food (CWRF)
CWRF is defined as the amount of water used to produce certain food requirements on a per capita basis. The CWRF is calculated by multiplying the food requirements per food item by the VWC of the corresponding food item and then summing the
re-20
sults for the food categories. Three levels of CWRF (basic CWRF, subsistence CWRF, and cultural CWRF) have been estimated based on the three scale levels of food re-quirements. The basic CWRF is determined based on two considerations. First, the caloric energy requirements are hypothesized to be met only by the consumption of wheat (Gerbens-Leenes and Nonhebel, 2002); second, according to the Chinese
Nu-25
HESSD
5, 27–50, 2008 Effect of food consumption on water J. Liu and H. H. G. Savenije Title Page Abstract Introduction Conclusions References Tables Figures ◭ ◮ ◭ ◮ Back Close Full Screen / EscPrinter-friendly Version Interactive Discussion male and female Chinese adults, respectively, to carry out light physical activities
un-der healthy live conditions. Thus, the average of 2250 kcal cap−1d−1 has been used as the recommended energy intake at the basic level. The calculation of subsistence CWRF is based on the recommended daily amounts of food intake from the food guide pagoda of the CNS (http://www.cnsoc.org). The food guide pagoda is available in
5
the supporting information SI (http://www.hydrol-earth-syst-sci-discuss.net/5/27/2008/ hessd-5-27-2008-supplement.pdf) Fig. 5. According to CNS, 100 g of milk and milk products are equivalent to 200 g of fresh milk, and 50 g bean and bean products are equivalent to 40 g of soybean. These equivalences are used in the calculation of sub-sistence CWRF. Further, the consumption ratio of different cereals (in weight) and meat
10
has been assumed identical to the cereal consumption pattern in 2003. The cultural CWRF is calculated based on actual food consumption patterns. Annual consumption of various food items over 1961–2003 is obtained from FAOSTAT (FAO, 2006).
In order to assess regional variation, cultural CWRF values have been estimated in different regions based on the food consumption patterns in 2003 and the VWC values
15
shown in Table 1. The regions analyzed are the European Union (the 15 member countries as a whole prior to the accession of the candidate countries on 1 May 2004, termed as EU15 here), USA, Japan, South Korea, developing countries as a whole (Developing), developed countries as a whole (Developed), and the world as a whole (World). Developed and developing countries have been distinguished according to
20
the classification by the Food and Agriculture Organization of the United Nations (FAO, 2006).
2.5 Total water requirement for food (TWRF)
TWRF is the total amount of water consumed to produce certain food requirements for all the individuals in a country. It was calculated for China by multiplying CWRF
25
by the population. Historical population data have been obtained from FAO (2006) for the period of 1961–2003. TWRF at the basic and subsistence levels have not been calculated, because these two levels are purely hypothetical situations which do not
HESSD
5, 27–50, 2008 Effect of food consumption on water J. Liu and H. H. G. Savenije Title Page Abstract Introduction Conclusions References Tables Figures ◭ ◮ ◭ ◮ Back Close Full Screen / EscPrinter-friendly Version Interactive Discussion provide any information on the current and future water requirement situation.
The future levels of TWRF largely depend on food consumption patterns and future population. In addition, technological changes can also have a profound impact on TWRF via their influence on VWC. Accurate estimation of future food consumption pat-terns is very difficult. Several studies presented estimates of future meat consumption,
5
such as 30–50 kg cap−1y−1 for 2025 (Heilig, 1999), 51.3 kg cap−1y−1 for 2020 (World Bank, 1997), and 63 kg cap−1y−1 for 2020 (Christopher et al., 1998). In 2003, meat consumption reached 55 kg cap−1y−1 (FAO, 2006) showing that the first two studies notably underestimated actual consumption. Hence, future CWRF estimation based on these cited projections may lead to large errors. In this paper, future CWRF values
10
have been determined based on the general trend of historical CWRF values.
The projection of China’s future population has been collected from the latest re-leased World Population Prospects: The 2006 Revision (United Nation, 2006). Tech-nological changes will likely lead to a decrease in VWC values. Shi and Lu (2001) forecasted that, to meet China’s food demand, crop water productivity needs to be
im-15
proved by 56% for the option of food self-sufficiency and 66% for the option of balanced agricultural water supply and demand over the next three decades. To meet these pre-dictions, the VWC would need to decrease by−1.2% y−1 and−1.3% y−1, respectively. These two rates have been used for the slow and fast modernization scenarios. The average rate or−1.25% y−1has been used for the medium modernization scenario.
20
In this paper, the period prior to 2030 has been selected for the scenario analysis. According to the medium variant of the UN’s projection, China’s population may reach the maximum in 2030 and then decline. Thus, in the nearest future China will face its greatest challenge in meeting the domestic food demand.
HESSD
5, 27–50, 2008 Effect of food consumption on water J. Liu and H. H. G. Savenije Title Page Abstract Introduction Conclusions References Tables Figures ◭ ◮ ◭ ◮ Back Close Full Screen / EscPrinter-friendly Version Interactive Discussion
3 Results and discussion
3.1 Virtual water content and energy water productivity
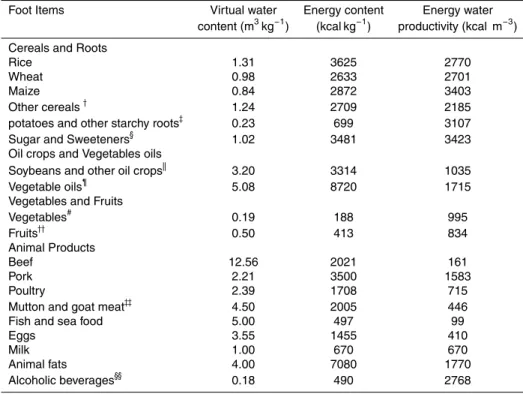
Table 1 shows the VWC values for the main food items in China. Generally, animal products, oil crops and vegetable oils have relatively high VWC values compared to other food items. Particularly, beef has the highest VWC of 12.6 m3kg−1among all food
5
items. In contrast, vegetables and fruits have the lowest VWC. The VWC of cereals are between 0.84 and 1.3 m3kg−1.
Cereals and starchy roots have the highest energy water productivity, ranging be-tween 2200 kcal m−3 and 3400 kcal m−3 (Table 1). Animal products generally have much lower energy water productivity than plant products. For instance, beef needs 17
10
times more water than wheat to supply the same amounts of energy. If the average en-ergy requirement of 2250 kcal cap−1d−1is covered by wheat, then 0.8 m3cap−1d−1 of water is required. However, if this amount of energy is covered by beef 14 m3cap−1d−1 is needed.
3.2 Historical food consumption patterns
15
Chinese diets have shifted towards animal products, particularly meat. Meat used to be luxury food in China, and its consumption remained at low levels prior to 1980. How-ever, meat consumption has risen rapidly, by a factor of 3.7, from 1980 to 2003. The large increase in meat consumption is mainly due to the rapid increase in per capita income, urbanization, and market expansion (Hsu et al., 2002; Huang et al., 1999).
20
In the past four decades, the consumption of rice and wheat increased gradually until it peaked in the late 1990s. Since then, cereal consumption has dropped. The con-sumption of maize changed little over time, with only a slight decline in recent years. The consumption of starchy roots steadily declined until 1995, and then bounced back in the early 2000s. Another remarkable change was the significant increase in
veg-25
etable and fruit consumption. On average, the consumption of fruits and vegetables 34
HESSD
5, 27–50, 2008 Effect of food consumption on water J. Liu and H. H. G. Savenije Title Page Abstract Introduction Conclusions References Tables Figures ◭ ◮ ◭ ◮ Back Close Full Screen / EscPrinter-friendly Version Interactive Discussion reached 320 kg cap−1y−1 in 2003, which is a four fold increase compared to that in
1961, and is now the most abundantly eaten food type in weight. The consumption of sugar and sweeteners, oil crops and vegetable oils and alcoholic beverages is also increasing. The historical food consumption of various food items over time is available as supporting information SI (http://www.hydrol-earth-syst-sci-discuss.net/5/27/2008/
5
hessd-5-27-2008-supplement.pdf) Table 2.
3.3 Per capita water requirement for food
Basic CWRF is estimated to lie around 300 m3cap−1y−1. Subsistence CWRF ranges from 480 to 680 m3cap−1y−1. These two numbers correspond to low and high sub-sistence levels respectively. CWRF at the high subsub-sistence level is more than double
10
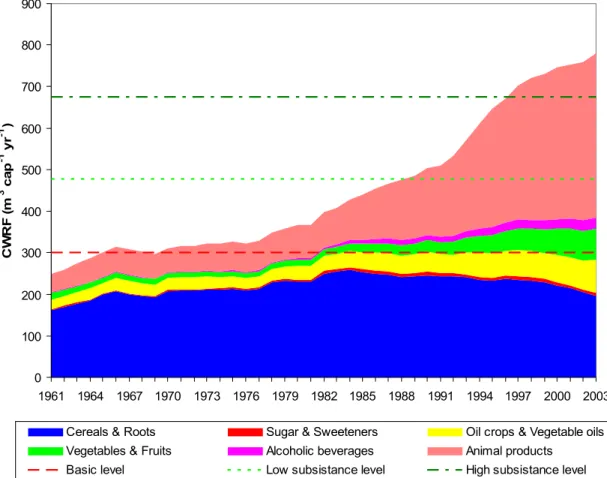
the basic CWRF. Figure 1 presents the estimated cultural CWRF from 1961 to 2003, indicating the basic and subsistence CWRF levels.
The cultural CWRF in the early 1960s was lower than the basic CWRF (Fig. 1). The year 1961 is the last year of the so-called “three bad years”, which contained a series of calamities that resulted in the deaths of tens of millions directly caused by starvation.
15
In 1961, the Chinese government started to introduce a series of new economic poli-cies known as “readjustment, consolidation, filling-out, and raising standards” to boost agricultural production. Consequently, cereal consumption (particularly wheat and rice consumption) rose steadily, which led to an increase in CWRF from 1961 to 1965. Afterwards, the Cultural Revolution, 1966–1976, which involved devastating social
tur-20
moil, had adverse effects on agricultural production. Over this period, cultural CWRF remained close to the basic level. After the Cultural Revolution, China abandoned col-lective agriculture and in 1978 assigned most agricultural land to families under the household responsibility system. The adoption of this system contributed to technolog-ical changes, which played an important role in driving productivity, particularly in the
25
1980s (Liu and Yin, 2004). Between 1978 and 1984, the rise of cultural CWRF was largely due to higher consumption of cereals and starchy roots and animal products.
HESSD
5, 27–50, 2008 Effect of food consumption on water J. Liu and H. H. G. Savenije Title Page Abstract Introduction Conclusions References Tables Figures ◭ ◮ ◭ ◮ Back Close Full Screen / EscPrinter-friendly Version Interactive Discussion After 1984, consumption of cereals and starchy roots showed a slight decline. The
increase in cultural CWRF was mainly caused by higher consumption of animal prod-ucts, oil crops and vegetable oils, and vegetables and fruits. Cultural CWRF reached low subsistence CWRF in the late 1980s, and then arrived at high subsistence CWRF in the middle 1990s. In 2003, the cultural CWRF reached 780 m3cap−1y−1, which is
5
about 15% higher than the CWRF at the high subsistence level. This is mainly due to meat and fish consumption being higher than the CNS recommended amount by about 50%. The contribution of animal products to CWRF has increased from 18% to 50% from 1961 to 2003. The contribution of cereals and starchy roots decreased from 61% to 25% during the same time span. Water requirement for the consumption
10
of both vegetables and fruits and oil crops and vegetable oils steadily increased over time, contributing to 20% of CWRF in 2003.
Per capita water requirement for animal products has increased by about 3.3% y−1 since 1996. In contrast, water requirement for the consumption of non-animal products almost leveled off over this period. Increasing water requirement for vegetables and
15
fruits and oil crops and vegetable oils is almost compensated by decreasing water requirement for cerealsand starchy roots.
Water requirements for the consumption of specific food items or categories depend not only on food consumption in weight but also on the VWC of these foods. For in-stance, even though animal products accounted for only 16% of total food consumption
20
in weight in 2003, their production required over half the cultural CWRF (Fig. 2). In con-trast, vegetables and fruits accounted for 44% of the total food consumption in weight, but their consumption only resulted in about 10% of CWRF. The VWC of animal prod-ucts generally has much higher values than that of vegetables and fruits, as shown in Table 1. As a result, some food items take a disproportional share of the water
require-25
ments. Similarly, some food groups have a disproportional share of the dietary energy intake and cultural CWRF (Fig. 2). in this regard, the energy water productivity plays a key role.
It should be pointed out that the VWC values used in this study (Table 1) are based 36
HESSD
5, 27–50, 2008 Effect of food consumption on water J. Liu and H. H. G. Savenije Title Page Abstract Introduction Conclusions References Tables Figures ◭ ◮ ◭ ◮ Back Close Full Screen / EscPrinter-friendly Version Interactive Discussion on estimations for the years around 2000. VWC values fluctuate. For example, Xu and
Zhao (2001) report that VWC of rice decreased from 4.3 m3kg−1in 1949 to 1.1 m3kg−1 in 1996 in Fengqiu County in China. This decrease in VWC is mainly caused by tech-nological innovations including the establishment of water conservation facilities, bet-ter soil management, extension of new crop varieties, and a continuous increase in
5
fertilizer application (Xu and Zhao, 2001). Annual VWC values of various food items in China are, unfortunately, rarely available. However, this should not influence the presented analysis, as its main objective is to demonstrate the effect of consumption patterns alone on CWRF, while holding all other variables constant. Therefore, the in-fluence of technological changes has not been included. However, it will be taken into
10
account in the scenario analysis of the future TWRF below.
3.4 Cultural CWRF and energy intake
Cultural CWRF and energy intake has changed at almost equal annual growth rates between 1961 and 1984 (see supporting information SI (http: //www.hydrol-earth-syst-sci-discuss.net/5/27/2008/hessd-5-27-2008-supplement.pdf)
15
Fig. 6). They both increased at a rate of 5% y−1 from 1961 to 1965, remained almost zero from 1966 to 1976, and increased again at a rate of about 4% y−1 from 1977 to 1984. Over the period 1961–1984, consumption of animal products hardly varied; and energy intake from animal products remained relatively constant. The variation in total energy intake was mainly caused by changes in the consumption of cereal crops
20
and starchy roots (FAO, 2006). Cereals and starchy roots have similar energy water productivity, resulting in the similar increase rates of cultural CWRF and energy intake. From 1985 to 1997, however, the CWRF increased much faster than total energy intake. Growth rates of CWRF and total energy intake were 5% y−1 and 1% y−1, re-spectively. The main reason for the faster growth of CWRF was the increase in the
25
consumption of food items with low energy water productivity (e.g. animal products) and less consumption of the food items with high energy water productivity (e.g. starchy roots). Although total energy intake from non-animal products only increased slightly,
HESSD
5, 27–50, 2008 Effect of food consumption on water J. Liu and H. H. G. Savenije Title Page Abstract Introduction Conclusions References Tables Figures ◭ ◮ ◭ ◮ Back Close Full Screen / EscPrinter-friendly Version Interactive Discussion consumption of various plant products changed. Consumption of cereals and starchy
roots declined, while consumption of vegetables and fruits increased significantly, thus causing a further growth of CWRF.
Since 1997, energy intake has slightly declined. The decrease in energy intake from cereals and starchy roots outweighed the increase in energy intake from animal
5
products. Lower energy water productivity of animal products led to a further increase in CWRF.
3.5 Comparison with other regions
Cultural CWRF values vary significantly among regions (Fig. 3). The largest value is for the USA (3074 m3cap−1y−1), and the smallest for the developing countries
10
(658 m3cap−1y−1). The CWRF of China is similar to that of the world average, but is much lower than that of developed countries, particularly EU15 and the USA (Fig. 3). Two other Asian countries, Japan and South Korea, have a cultural CWRF value of about one-third higher than China. The relatively low CWRF of China is mainly due to lower consumption of animal products. For example, in the USA, the
consump-15
tion of animal products corresponds to almost 900 m3cap−1y−1 of water, of which 465 m3cap−1y−1 is due to beef consumption. This volume alone is much larger than the CWRF of China. Additionally, developed countries also consume more sugar and sweeteners and alcoholic beverages than China. Water requirements for the consump-tion of cereals and starchy roots hardly vary among regions.
20
In the near future, dietary changes in China, directed towards higher consumption of animal products, will continue to bear on water requirements. If China shifts towards the American level of animal product consumption, the cultural CWRF will rise by almost 400%. Similarly, if consumption patterns in developing countries would shift towards the affluent diets of western countries, the CWRF values would rise up to a three fold
25
increase. Such a change in food consumption pattern would play a much greater role in increasing water requirements than population growth.
HESSD
5, 27–50, 2008 Effect of food consumption on water J. Liu and H. H. G. Savenije Title Page Abstract Introduction Conclusions References Tables Figures ◭ ◮ ◭ ◮ Back Close Full Screen / EscPrinter-friendly Version Interactive Discussion 3.6 Total water requirement for food (TWRF): present and future
The TWRF has been estimated at 1023 km3y−1 in China in 2003. To analyze the TWRF in the period of 2004–2030, three scenarios have been developed.
Slow modernization scenario (S1). The per capita water requirement for animal products increases with an annual growth rate of 1.6% y−1, half that of recent years.
5
Per capita water requirement for non-animal products remains at the consumption level of 2003. Population growth follows the high variant of the UN population projection. Technological innovation decreases the VWC by−1.2% y−1.
Medium modernization scenario (S2). The current growth rates of per capita water requirement for animal products (3.3% y−1) and non-animal products (0.2% y−1) will
10
remain constant until 2030. Population growth follows the medium variant of the UN population projection. Technological innovation decreases the VWC by −1.25%˙y−1, the average of S1 and S3.
High modernization scenario (S3). Food consumption in 2030 will reach the average level of developed countries. Consumption of each food item changes linearly over
15
2004–2030. Population growth follows the low variant of the UN population projection. Technological innovation decreases the VWC by−1.3% y−1.
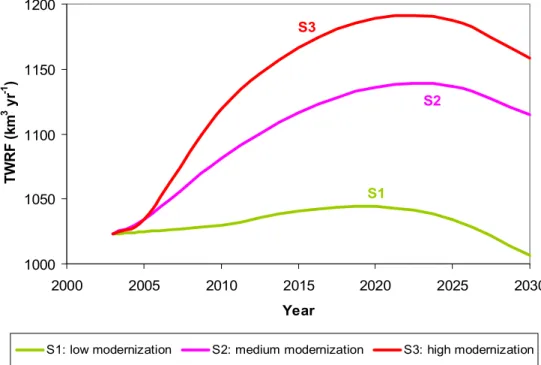
The results of future TWRF scenarios S1–S3 are presented in Fig. 4. Under S1, a peak in TWRF will occur around 2020. During this period, the shift in food consumption patterns alone will result in 14% more TWRF compared to that in 2003, while
popu-20
lation growth alone will lead to 13% more TWRF. Both factors combined increase the TWRF by 28% over 2003–2020. Technological changes decrease the VWC by about 20%. As a result, TWRF reaches 1044 km3y−1in 2020, about 2% higher than in 2003. Afterwards, the TWRF will decrease.
Under S2, TWRF will reach a maximum in 2025 (Fig. 4). Around this time the shift
25
in food consumption and population growth will lead to a 39% and 10% increase com-pared to 2003, respectively (all other factors remaining equal). Both factors combined will increase the TWRF by 53%. Technological innovation alone will decrease the VWC
HESSD
5, 27–50, 2008 Effect of food consumption on water J. Liu and H. H. G. Savenije Title Page Abstract Introduction Conclusions References Tables Figures ◭ ◮ ◭ ◮ Back Close Full Screen / EscPrinter-friendly Version Interactive Discussion by 28%. As a result, TWRF arrives at 1137 km3y−1in 2025, 11% higher than in 2003.
Under S3, TWRF will reach a maximum in 2020 (Fig. 4). The shift in food con-sumption patterns and population growth will result in 44% and 4% increase compared to 2003, respectively, whereas both factors combined increase the TWRF by 50%. Technological innovation decreases the VWC by 22%. As a result, TWRF arrives at
5
1189 km3y−1in 2020, about 16% higher than in 2003.
The TWRF will most likely reach a peak between 2020 and 2025. Before that, an additional amount of water ranging between 21 and 166 km3y−1 will be required. This is a substantial increase, which amounts to 10–74% of current consumptive irrigation water use (MWR, 2005). The analysis also suggests that the shift in food
consump-10
tion pattern will contribute more to the growth of the TWRF than population growth, especially under S2 and S3.
4 Conclusions
There are three sources of water that can be managed to meet the additional TWRF requirements. The first source is blue water, which is defined as the water in rivers,
15
lakes, reservoirs, ponds and aquifers (Falkenmark, 2003). For food production, blue water means irrigation. However, increasing water scarcity and competition from other sectors have put agricultural blue water use under great pressure. There has been a reallocation of irrigation water to industrial and domestic sectors, and environmental water needs are give more and more weight (Yang and Zehnder, 2001). In China,
20
irrigation water use declined by 15% over 1997–2003 (MWR, 2005). It is difficult to allocate more blue water to future domestic agricultural production.
The second source of water is green water. Green water refers to the water coming from precipitation, stored in unsaturated soil, and taken up by plants as transpiration (Savenije, 2000). Green water accounts for 73% of the consumptive water use for
do-25
HESSD
5, 27–50, 2008 Effect of food consumption on water J. Liu and H. H. G. Savenije Title Page Abstract Introduction Conclusions References Tables Figures ◭ ◮ ◭ ◮ Back Close Full Screen / EscPrinter-friendly Version Interactive Discussion mestic crop production in China (Liu et al., 2007c1), and likely constitutes the majority
of water used for the production of animal products. In particular grazing production systems use mostly green water, in which water has almost zero opportunity cost. Although important, green water is often ignored by water managers, largely due to the difficulty to assess or manage it and its low opportunity cost (Liu et al., 2007c).
5
Capturing more green water can be achieved by expanding agricultural land areas, water conservation and by more effectively utilizing local rainfall. Expanding agricul-tural land areas will not likely be feasible in China. Recent land use trends show a reallocation of agricultural land to other uses (Tan et al., 2005). Effective rainfall man-agement seems a more feasible option to increase the future water supply. Rockstr ¨om
10
et al. (2003) demonstrated that rainwater harvesting is a promising approach for green water management in the semi-arid tropics of Asia and Africa. Rainfall harvesting has been adopted in the past by many households in the semiarid areas in China to provide water storage for both irrigation and household usage (Zhao et al., 1995). So far, it has been practiced in 15 provinces, mainly in the North, Northwest, and Southwest China.
15
The potential of additional water supply through rainwater harvesting has never been quantitatively assessed for China.
The third source of water is virtual water. Virtual water describes the amount of water consumed in the production process of a product (Allan, 1998). The concept of virtual water implies that water scarce countries could mitigate water scarcity by importing
20
water intensive food (Chapagain et al., 2006; Hoekstra and Hung, 2005; Yang et al., 2003; Liu et al., 2007a). Based on the food items looked at in this study, it is estimated that China had a total net virtual water import of 81 km3y−1 in 2003, equivalent to 8% of the TWRF. The virtual water strategy has not been consciously used by the Chinese government, largely due to its emphasis on the principle of self-sufficiency in
25
food supply (Liu et al., 2007b). With intensified water scarcity, China’s decision makers may have to consider loosening its stance on the self-sufficiency principle and, thereby,
1
Liu, J., Zehnder, A. J. B., and Yang, H.: Global consumptive water use for crop production: The importance of green water and virtual water, Water Resour. Res., under review, 2007c.
HESSD
5, 27–50, 2008 Effect of food consumption on water J. Liu and H. H. G. Savenije Title Page Abstract Introduction Conclusions References Tables Figures ◭ ◮ ◭ ◮ Back Close Full Screen / EscPrinter-friendly Version Interactive Discussion taking advantage of virtual water through the trade of water-intensive foods.
To conclude, the additional TWRF triggered by the shift of food consumption patterns and population growth will impose high pressure on China’s finite water resources. Amongst the other options, two seem feasible to meet the additional water required for food consumption, namely effectively rainfall management and increased virtual water
5
imports. Both options need further study to provide realistic estimates of their potential contribution to China’s water supply. Since the requirement of additional water largely depends on food consumption patterns, it is theoretically possible to reduce the addi-tional water requirement by consuming lower amounts of food items with high VWC, such as animal products. Fish could serve as an alternative to meat as a source of
10
protein. Production of sea fish does not require freshwater; hence, replacement of part of meat with sea fish can also save freshwater. Although food consumption pat-terns are closely related to increasing affluence, awareness-raising may play a role in affecting the food preference of China’s population. Currently, China’s meat consump-tion has exceeded the recommended amounts by the CNS. In addiconsump-tion, some authors
15
have argued that the contemporary Chinese diet shifts may be detrimental to health, by introducing higher incidence of diet-related diseases (Du et al., 2004). Raising pub-lic awareness and encouragement of the CNS diet may help mitigate the future water scarcity problem in China.
Acknowledgements. This study was supported by European Commission within the
GEO-20
BENE project framework (Global Earth Observation – Benefit Estimation: Now, Next and Emerging, Proposal No 037063). We thank N. van de Giesen (Delft University of Technol-ogy, the Netherlands), J. Huang (Chinese Academy of Sciences), S. Christoph (University of Applied Sciences, Switzerland) and H.-P. Arp (Swiss Federal Institute of Technology) for their valuable comments and suggestion. Special thanks are also given to A. J. B. Zehnder and 25
H. Yang for their supervision of J. Liu’s PhD. Any remaining errors are solely our responsibility.
HESSD
5, 27–50, 2008 Effect of food consumption on water J. Liu and H. H. G. Savenije Title Page Abstract Introduction Conclusions References Tables Figures ◭ ◮ ◭ ◮ Back Close Full Screen / EscPrinter-friendly Version Interactive Discussion
References
Alcamo, J., Henrichs, T., and R ¨osch, T.: World water in 2025: Global modeling and scenario analysis for the world commission on water for the 21st century, Report A0002, Center for Environmental Systems Research, University of Kassel, Kassel, Germany, 2000.
Allan, J. A.: Virtual water: A strategic resource global solutions to regional deficits, Ground 5
Water, 36, 545–546, 1998.
Chapagain, A. K. and Hoekstra, A. Y.: Water footprints of nations, Value of Water Research Report Series No.16, UNESCO-IHE, Delft, the Netherlands, 2004.
Chapagain, A. K., Hoekstra, A. Y., and Savenije, H. H. G.: Water saving through international trade of agricultural products, Hydrol. Earth Syst. Sc., 10, 455–468, 2006.
10
Christopher, L. D., Courbois, C. B., and Rosegrant, M. W.: Global food demand and the con-tribution of livestock as we enter the new millennium, International Food Policy Research Institute, Washington, D.C., 1998.
Du, S., Mroz, T. A., Zhai, F., and Popkin, B. M.: Rapid income growth adversely affects diet quality in china – particularly for the poor! Soc. Sci. Med., 59, 1505–1515, 2004.
15
Falkenmark, M.: Freshwater as shared between society and ecosystems: From divided ap-proaches to integrated challenges, Philos. T. R. Soc. B., 358, 2037–2049, 2003.
FAOSTAT: FAO statistical databases:http://faostat.fao.org/default.aspx, 2006.
Gerbens-Leenes, P. W. and Nonhebel, S.: Consumption patterns and their effects on land required for food, Ecol. Econ., 42, 185–199, 2002.
20
Gleick, P. H.: Basic water requirements for human activities: Meeting basic needs, Water Int, 21, 83–92, 1996.
Heilig, G. K.: Chinafood. Can china feed itself? IIASA, Laxenburg, Austria, 1999.
Hoekstra, A. Y. and Hung, P. Q.: Globalisation of water resources: International virtual water flows in relation to crop trade, Global Environ. Change A, 15(1), 45–56, 2005.
25
Hsu, H. H., Chern, W. S., and Gale, F.: How will rising income affect the structure of food demand? in: China’s food and agriculture: Issues for the 21st century, edited by: Gale, F., Economic research service/USDA, Washington, DC, 2002.
Huang, J., Rozell, S., and Rosegrant, M. W.: China’s food economy to the twenty-first century; supply, demand, and trade, Econ. Dev. Cult. Change, 47, 737–766, 1999.
30
Koudstaal, R., Rijsberman, F. R., and Savenije, H. H. G.: Water and sustainable development, Nat. Resour. Forum, 16, 277–290, 1992.
HESSD
5, 27–50, 2008 Effect of food consumption on water J. Liu and H. H. G. Savenije Title Page Abstract Introduction Conclusions References Tables Figures ◭ ◮ ◭ ◮ Back Close Full Screen / EscPrinter-friendly Version Interactive Discussion
Liu, C. and Yin, R.: Poverty dynamics revealed in production performance and forestry in im-proving livelihoods: The case of west Anhui, China, Forest Policy Econ., 6, 391–401, 2004. Liu, J., Williams, J. R., Zehnder, A. J. B., and Yang, H.: GEPIC – modelling wheat yield and crop
water productivity with high resolution on a global scale, Agr. Syst., 94, 478–493, 2007a. Liu, J., Zehnder, A. J. B., and Yang, H.: Historical trends in china’s virtual water trade, Water 5
Int., 32, 78–90, 2007b.
MWR: China water resources bulletins, Ministry of Water Resources, Beijing, available at:http:
//www.mwr.gov.cn/, 2005.
Oki, T. and Kanae, S.: Global hydrological cycles and world water resources, Science, 313, 1068–1072, 2006.
10
Postel, S. L., Daily, G. C., and Ehrlich, P. R.: Human appropriation of renewable fresh water, Science, 271, 785–788, 1996.
Raskin, P., Gleick, P., Kirshen, P., Pontius, G., and Strzepek, K.: Water futures: Assessment of long-range patterns and prospects, Stockholm Environment Institute, Stockholm, Sweden, 1997.
15
Renault, D. and Wallender, W. W.: Nutritional water productivity and diets, Agr. Water Manage., 45, 275–296, 2000.
Rijsberman, F. R.: Water scarcity: Fact or fiction? Agr. Water Manage., 80, 5–22, 2006. Rockstr ¨om, J.: Water for food and nature in drought-prone tropics: Vapour shift in rain-fed
agriculture, Philos. T. R. Soc. B , 358, 1997–2009, 2003. 20
Savenije, H. H. G.: Water scarcity indicators; the deception of the numbers, Phys. Chem. Earth, 25, 199–204, 2000.
Seckler, D., Amarasinghe, U., Molden, D. J., de Silva, R., and Barker, R.: World water demand and supply, 1990 to 2025: Scenarios and issues, Iwmi research report 19, IWMI Research Report 19, IWMI, Colombo, Sri Lanka, 1998.
25
Shi, Y. and Lu, L.: China agricultural water demand and water-saving and efficient agricul-ture, in: China sustainable water resources strategy research report series volume 4, China WaterPower Press, Beijing, China, ISBN:7-5084-0709-1/TV.148, 2001.
Shiklomanov, I. A.: The world’s water resources, in: Proceedings of the international sympo-sium to commemorate 25 years of the ihp, UNESCO/IHP, Paris, France, 93–126, 1991. 30
Tan, M., Li, X., Xie, H., and Lu, C.: Urban land expansion and arable land loss in china–a case study of beijing-tianjin-hebei region, Land Use Policy, 22, 187–196, 2005.
United Nation: World population prospects: The 2006 revision, United Nations, New York,
HESSD
5, 27–50, 2008 Effect of food consumption on water J. Liu and H. H. G. Savenije Title Page Abstract Introduction Conclusions References Tables Figures ◭ ◮ ◭ ◮ Back Close Full Screen / EscPrinter-friendly Version Interactive Discussion
2006.
V ¨or ¨osmarty, C. J., Green, P., Salisbury, J., and Lammers, R. B.: Global water resources: Vul-nerability from climate change and population growth, Science, 289, 284–288, 2000. World Bank: China 2020 – at china’s table. Food security options, World Bank, Washington,
D.C., 1997. 5
Xu, F. A. and Zhao, B. Z.: Development of crop yield and water use efficiency in fengqiu county, china, Acta Pedologica Sinica, 38, 491–497, 2001.
Yang, H. and Zehnder, A. J. B.: China’s regional water scarcity and implications for grain supply and trade, Environ. Plann. A, 33, 79–95, 2001.
Yang, H., Reichert, P., Abbaspour, K. C., and Zehnder, A. J. B.: A water resources threshold 10
and its implications for food security, Environ. Sci. Technol., 37, 3048–3054, 2003.
Zhao, S. L., Li, F. R., and Wang, J.: On the development of water harvesting agriculture in the semiarid area northwest china, Acta Bot. Boreal. Occident. Sin., 15, 9–13, 1995.
Zimmer, D. and Renault, D.: Virtual water in food production and global trade: Review of methodological issues and preliminary results, in: Virtual water trade, Proceedings of the 15
international expert meeting on virtual water trade, edited by: Hoekstra, A. Y., UNESCO-IHE, Delft, the Netherlands, 25–47, 2003.
HESSD
5, 27–50, 2008 Effect of food consumption on water J. Liu and H. H. G. Savenije Title Page Abstract Introduction Conclusions References Tables Figures ◭ ◮ ◭ ◮ Back Close Full Screen / EscPrinter-friendly Version Interactive Discussion Table 1. Virtual water content and energy water productivity for mostly consumed food items.
Foot Items Virtual water Energy content Energy water
content (m3kg−1) (kcal kg−1) productivity (kcal m−3) Cereals and Roots
Rice 1.31 3625 2770
Wheat 0.98 2633 2701
Maize 0.84 2872 3403
Other cereals† 1.24 2709 2185
potatoes and other starchy roots‡ 0.23 699 3107
Sugar and Sweeteners§ 1.02 3481 3423
Oil crops and Vegetables oils
Soybeans and other oil crops|| 3.20 3314 1035
Vegetable oils¶ 5.08 8720 1715
Vegetables and Fruits
Vegetables# 0.19 188 995 Fruits†† 0.50 413 834 Animal Products Beef 12.56 2021 161 Pork 2.21 3500 1583 Poultry 2.39 1708 715
Mutton and goat meat‡‡ 4.50 2005 446
Fish and sea food 5.00 497 99
Eggs 3.55 1455 410
Milk 1.00 670 670
Animal fats 4.00 7080 1770
Alcoholic beverages§§ 0.18 490 2768
†
based on data for sorghum ‡ based on data for potatoes
§ based on data for refined sugars || based on data for soybeans ¶ based on data for soybean oil #
based on data for tomatoes
††based on data for apples ‡‡based on average data for goat meat and sheep meat §§based on data for beer
HESSD
5, 27–50, 2008 Effect of food consumption on water J. Liu and H. H. G. Savenije Title Page Abstract Introduction Conclusions References Tables Figures ◭ ◮ ◭ ◮ Back Close Full Screen / EscPrinter-friendly Version Interactive Discussion 0 100 200 300 400 500 600 700 800 900 1961 1964 1967 1970 1973 1976 1979 1982 1985 1988 1991 1994 1997 2000 2003 C W R F ( m 3 c a p -1 y r -1 )
Cereals & Roots Sugar & Sweeteners Oil crops & Vegetable oils
Vegetables & Fruits Alcoholic beverages Animal products
Basic level Low subsistance level High subsistance level
Fig. 1. The per capita water requirement for food (CWRF) at the basic, subsistence and cultural
HESSD
5, 27–50, 2008 Effect of food consumption on water J. Liu and H. H. G. Savenije Title Page Abstract Introduction Conclusions References Tables Figures ◭ ◮ ◭ ◮ Back Close Full Screen / EscPrinter-friendly Version Interactive Discussion 0 20 40 60
Cereals & Roots
Vegetables & Fruits
Animal products
Oil crops & vegetable oils Sugar & Sweeteners
Alcoholic beverage
Food consumption in weight % Dietary energy intake % CWRF %
Fig. 2. Sources of food consumption in weight, dietary energy intake and CWRF. All are
pre-sented as the percentage of the total.
HESSD
5, 27–50, 2008 Effect of food consumption on water J. Liu and H. H. G. Savenije Title Page Abstract Introduction Conclusions References Tables Figures ◭ ◮ ◭ ◮ Back Close Full Screen / EscPrinter-friendly Version Interactive Discussion 0 500 1000 1500 2000 China EU15 USA Japan South Korea World Developing Developed
Per capita wate r re quireme nt for food (m3 cap-1 yr-1)
Cereals & Starchy roots Sugar & Sweeteners Oil crops & Vegetable oils Vegetables & Fruits Alcoholic beverages Animal products
Fig. 3. Per capita water requirement for food (CWRF) at the cultural level in 2003 in different
HESSD
5, 27–50, 2008 Effect of food consumption on water J. Liu and H. H. G. Savenije Title Page Abstract Introduction Conclusions References Tables Figures ◭ ◮ ◭ ◮ Back Close Full Screen / EscPrinter-friendly Version Interactive Discussion S1 S2 S3 1000 1050 1100 1150 1200 2000 2005 2010 2015 2020 2025 2030 Year T W R F ( k m 3 y r -1 )
S1: low modernization S2: medium modernization S3: high modernization
Fig. 4. Forecasted total water requirement for food (TWRF) in 2003–2030 under three
scenar-ios.