HAL Id: hal-00317295
https://hal.archives-ouvertes.fr/hal-00317295
Submitted on 2 Apr 2004
HAL is a multi-disciplinary open access
archive for the deposit and dissemination of
sci-entific research documents, whether they are
pub-lished or not. The documents may come from
teaching and research institutions in France or
abroad, or from public or private research centers.
L’archive ouverte pluridisciplinaire HAL, est
destinée au dépôt et à la diffusion de documents
scientifiques de niveau recherche, publiés ou non,
émanant des établissements d’enseignement et de
recherche français ou étrangers, des laboratoires
publics ou privés.
The 22-year cycle in the geomagnetic 27-day recurrences
reflecting on the F2-layer ionization
E. M. Apostolov, D. Altadill, M. Todorova
To cite this version:
E. M. Apostolov, D. Altadill, M. Todorova. The 22-year cycle in the geomagnetic 27-day recurrences
reflecting on the F2-layer ionization. Annales Geophysicae, European Geosciences Union, 2004, 22
(4), pp.1171-1176. �hal-00317295�
SRef-ID: 1432-0576/ag/2004-22-1171 © European Geosciences Union 2004
Annales
Geophysicae
The 22-year cycle in the geomagnetic 27-day recurrences reflecting
on the F2-layer ionization
E. M. Apostolov1, D. Altadill1, and M. Todorova2
1Observatorio del Ebro, (URL-CSIC), Horta Alta 38, E43520 Roquetes, Spain
2Geophysical Institute, Bulgarian Academy of Sciences, Acad. G. Bonchev bl.3, 1113 Sofia, Bulgaria
Received: 21 March 2003 – Revised: 10 October 2003 – Accepted: 21 October 2003 – Published: 2 April 2004
Abstract. Solar cycle variations of the amplitudes of the
27-day solar rotation period reflected in the geomagnetic activity index Ap, solar radio flux F10.7 cm and critical frequency
foF2 for mid-latitude ionosonde station Moscow from the maximum of sunspot cycle 18 to the maximum of cycle 23 are examined. The analysis shows that there are distinct en-hancements of the 27-day amplitudes for foF2 and Apin the
late declining phase of each solar cycle while the amplitudes for F10.7 cm decrease gradually, and the foF2 and Ap
am-plitude peaks are much larger for even-numbered solar cy-cles than for the odd ones. Additionally, we found the same even-high and odd-low pattern of foF2 for other mid-latitude ionosonde stations in Northern and Southern Hemispheres. This property suggests that there exists a 22-year cycle in the F2-layer variability coupled with the 22-year cycle in the 27-day recurrence of geomagnetic activity.
Key words. Ionosphere (mid-latitude ionosphere;
iono-sphere-magnetosphere interactions) – Magnetospheric physics (solar wind-magnetosphere interactions)
1 Introduction
The 22-year cycle of geomagnetic activity is the least well examined of the long-period geomagnetic variations which are longer than the solar cycle. The reality of the geomag-netic 22-year cycle has not gone unquestioned. There are some investigations based on spectral analysis of long-term series of geomagnetic indices or geomagnetic data of indi-vidual stations which have provided no evidence for a 22-year periodicity (Fraser-Smith, 1972; Delouis and Mayaud, 1975; Gonzalez et al., 1993), but, on the other hand, there are studies showing the strong 22-year periodicity, for instance, those of Currie (1973) and Courtillot et al. (1977). More-over, some investigations reveal an important 22-year cycle in some properties of the geomagnetic activity variations as the vernal-autumnal asymmetry in the seasonal variation of Correspondence to: E. M. Apostolov
geomagnetic activity (Triskova, 1989). The 22-year variation in the geomagnetic activity was clearly demonstrated by en-hanced 27-day recurrent activity during the declining phase of even-numbered solar cycles (Ondoh and Nakamura, 1980; Hapgood, 1993) and also by transient activity in the rising phase of odd-numbered cycles (Cliver et al., 1996). The pe-riod of activations of strong geomagnetic 27-day recurrent activity is longer in the even-numbered cycles – nearly 4 years – than in the odd cycles, nearly 2 years (Ondoh and Nakamura, 1980). The significant peaks of occurrences are in the second half of the declining phase of each cycle, but the peaks are much higher for the even cycles than for the odd ones (Hapgood, 1993).
A large part of the F2-layer variability is linked to the geomagnetic activity (Forbes et al., 2000; Rishbeth and Mendillo, 2001) and, therefore, we would expect to observe a 22-year cycle in the F2-layer characteristics. The investi-gation of Feichter and Leitinger (1997) of two consecutive solar cycles, 21 and 22, show the existence of a 22-year pe-riod in the daytime total electron content (TEC) and over four solar cycles (19–22) for F-layer peak electron density (NmF2) over Europe. They found that the annual variation of TEC and NmF2 shows the change in the maximum from autumn in odd cycles to a spring maximum in even cycles in European mid-latitudes. The authors conclude that the ob-served annual asymmetry of F-layer ionization in European mid-latitudes is in anti-phase with the vernal-autumnal asym-metry of geomagnetic activity (Triskova, 1989) because of the ionization depression caused by “negative storm effects”. In this investigation we present another aspect of a 22-year cycle manifestation in upper ionosphere ionization based on the long-term variations of the 27-day amplitudes of the ge-omagnetic activity in even/odd numbered solar cycles.
2 Data and method
The following parameters have been used in our analysis. The hourly values of the F2-layer critical frequency (foF2) for the period from 1947 to 2001 from Moscow (55.5◦N, 37.3◦E) are retrieved from the COST251 database for the
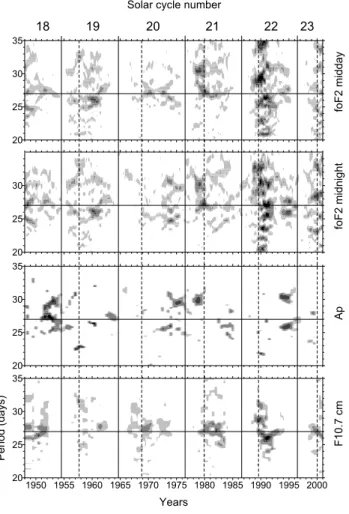
1172 Apostolov et al.: 22-year cycle in the F2-layer 20 25 30 35 20 25 30 20 25 30 35 1950 1955 1960 1965 1970 1975 1980 1985 1990 1995 2000 Years 20 25 30 35 Peri od ( day s) foF2 midday foF2 midnight Ap F10.7 cm 18 19 20 21 22 23
Solar cycle number
Fig. 1. Dynamic amplitude spectra in the period range from 20 to 35
days of solar radio flux F10.7 cm, geomagnetic activity index Ap
and critical frequencies foF2 for midday and midnight (Moscow) over the years 1947–2001. Solar cycle maxima and minima are marked with dashed and thin vertical lines, respectively. Highest amplitudes are painted in a black tone. The 27-day period is indi-cated by a horizontal line in each panel.
period 1947–1998 and for the period 1999–2001 from the World Data Centre for Solar-Terrestrial Physics, Boulder, via the http://ngdc.noaa.gov/spidr. This time series has been used as a base for the purpose of our investigation because it is very long – it covers the interval from the maximum of solar cycle 18 to the maximum of solar cycle 23 – and it is characterized by a scarcity of missing values. Two sequences of average hourly foF2 for midday (10–14 LT) and midnight (22–02 LT) bins for each day have been retrieved for the anal-ysis. Additionally, the foF2 hourly data for some ionosonde stations in the mid-latitude belt of the Northern and Southern Hemisphere used in the present analysis are retrieved from WDC for STP, Chilton, via the http://wdc.rl.ac.uk. Because the F-layer ionization variability is linked to the geomagnetic activity and solar EUV variations, we also use daily values of the geomagnetic activity index Ap, and solar radio flux
at 10.7 cm (F10.7 cm), as proxies of geomagnetic and solar EUV variations for the time interval being investigated. Note that the time series of F10.7 cm starts on 14 February 1947.
In order to investigate the spectral composition of the solar rotation period reflected in the geomagnetic, ionospheric and solar radio flux variations, we use the Lomb-Scargle peri-odogram method. The periperi-odogram algorithm given by Scar-gle (1982) for the general case is for an unevenly sampled time series. The application of this periodogram method is very convenient in the case of ionospheric sounding time se-ries which are characterized by data gaps. The probability that a given periodicity is a true signal can be estimated when the periodogram power is normalized by the total variance of the data (Horne and Baliunas, 1986; Press et al., 1992). Hocke (1998) has extended the methodology for calculating the amplitude and phase spectra.
3 Results
To investigate the temporal variations of the spectral power or amplitude of solar rotation period reflected in the inves-tigated time series, dynamic spectra were calculated. The Lomb-Scargle periodogram was applied to a 2-year window within each time series and the window is then slid through the series in 73-day (0.2-year) increments. The 2-year win-dow length was selected to reveal the dominant character-istics of temporal variations of the 27-day period ampli-tude by diminishing the seasonal variations and emphasizing the intervals with long-lived structures. The periodograms for Ap and F10.7 cm are computed in the frequency
inter-val 0.05–0.0285 day−1 and for foF2 in the interval 0.002– 0.0012 hour−1, both corresponding to the period range be-tween 20 and 35 days, with an over sampling factor of four.
Figure 1 depicts the dynamic amplitude spectra for F10.7 cm, Ap and foF2 for Moscow. The amplitudes which
exceed 95% confidence level are taken for spectrograms only. Three features of the dynamic amplitude spectra of in-terest of the present study should be immediately noted: (1) The figure reveals a distinct 22-year cycle of the geomagnetic activity around 27-day period. The highest Ap-amplitudes
occur strongly in the late declining phase of the even cy-cles 18, 20 and 22. (2) The highest amplitudes of F10.7 cm are near solar cycle maxima and negligible in the declining phases before solar cycle minima. (3) There are significant activations of foF2-amplitudes in both midday and midnight during the declining phases of each solar cycle. These activa-tions coincide in time, near 4-years intervals before sunspot minimum, with those of the geomagnetic activity for the even cycles (18, 20 and 22). This is an indication of the expected manifestation of a 22-year cycle in F2-layer ionization due to the 22-year cycle of geomagnetic 27-day period.
The spectral behaviour of the investigated parameters in the late declining phase of solar cycles is more clearly seen in Fig. 2. This figure depicts the amplitude spectra in the pe-riod range from 20 to 35 days for foF2, Apand F10.7 cm over
4-year intervals before sunspot minimum of the cycles 18 to 22. First of all, we see a clear double cycle variation in Ap
-and foF2-spectra with higher amplitudes near the solar rota-tion period for solar cycles 18, 20 and 22 in comparison with
20 25 30 35 0 1 2 3 A m pl itude ( 0 .1 M H z) 20 25 30 35 0 1 2 3 4 5 A m pl itude ( n T ) 20 25 30 35 0 2 4 6 8 10 A m pl itude ( sf u ) 20 25 30 35 20 25 30 35 20 25 30 35 20 25 30 35 20 25 30 35 20 25 30 35 Period (days) 20 25 30 35 20 25 30 35 20 25 30 35 20 25 30 35 20 25 30 35 20 25 30 35 18 19 20 21 22 fo F 2 Ap F 10. 7 c m
Solar cycle number
Fig. 2. Amplitude spectra of foF2 (Moscow), Apand F10.7cm in the period range from 20 to 35 days over 4-year intervals in the late declining
phase of solar cycles 18–22 before sunspot minima. The thick and dashed lines mean midday and midnight foF2 spectra, respectively.
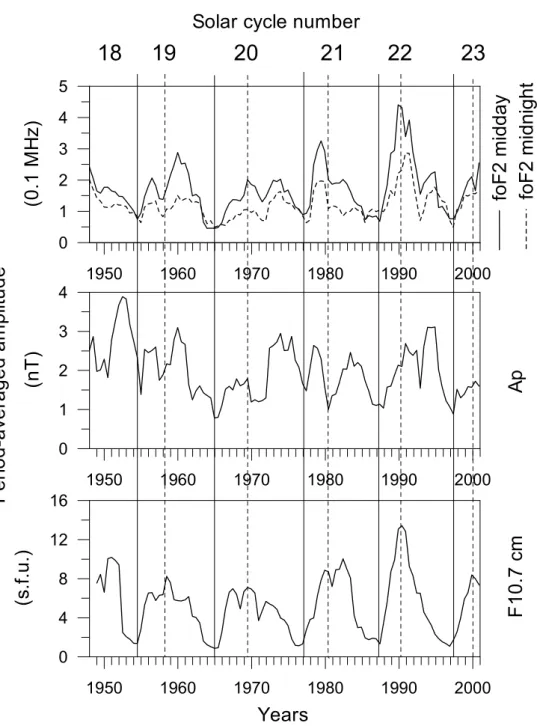
those for solar cycles 19 and 21. For F10.7 cm-amplitudes there is no such variation, they are nearly equal in the cy-cles 19 to 22. The amplitude spectra of the three param-eters have similar features including a significant band of sharply defined peaks around the 27-day solar rotation pe-riod, between 25 and 31 days. The causes of the appear-ance of this multi-peaked structure were analyzed mainly for solar and geomagnetic parameters. According to the stud-ies of Fenimore et al. (1978), Letfus and Apostolov (1980), and Bouwer (1992), the combined effects of solar rotation and active region evolution, or its longitudinal distribution, may produce this structure. The power (or amplitude) spec-tra over long-time intervals of geomagnetic activity indices performed in many studies show dominant subsidiary peaks at 25.2 and 29.5 days around the peak of 27–27.4 days. Cole-man and Smith (1966) argued that these subsidiary peaks re-sult from amplitude modulation of the 27.4-day period by the period of 1 year. However, the power of the solar rotation period reflected in the three parameters is distributed in a se-ries of spectral lines mainly between 25 and 31 days. This is why we have calculated the period-averaged amplitude as an integrated measure of the amplitude distributed within the periods from 25 to 31 days for the three parameters, over 2-year windows sliding by 73 days (Fig. 3). To some ex-tent, Fig. 3 represents a section of the results in Fig. 1 for the
limited periodic band of interest. Figure 3 shows that there are enhancements of the period-averaged amplitudes in the declining phase of each solar cycle for both foF2 and Ap.
These enhancements are better expressed and they coincide in time during the even cycles 20 and 22.
The observed vernal-autumnal asymmetry of the annual variation of the F-layer ionization, coupled with the 22-year cycle in geomagnetic activity (Feichter and Leitinger, 1997) has been obtained for European mid-latitudes but not for the Southern Hemisphere because of the lack of difference be-tween vernal and autumnal maxima (Titheridge et al., 1996). However, the solar rotation period in the EUV and geomag-netic variations is reflected strongly in the components of the F-layer variability in both hemispheres. We have reason to believe that the long-term variations of 27-day period char-acteristics on the F-layer variability should show a 22-year variation in the Southern Hemisphere as well. Figure 4 shows the amplitude spectra of midday and midnight foF2 for south-ern station Canberra (35.3◦S, 149◦E) for the late declining
phases of solar cycles 18 to 21, obtained by the same method as for foF2 (Moscow) in Fig. 2. Again, the amplitudes for the even cycles are higher than for the odd ones.
Analogous results are also obtained for some mid-latitude sounding stations in Northern Hemisphere and for Southern Hemisphere in the Australian sector (Table 1). The values of
1174 Apostolov et al.: 22-year cycle in the F2-layer
1950
1960
1970
1980
1990
2000
0
1
2
3
4
(n
T
)
1950
1960
1970
1980
1990
2000
Years
0
4
8
12
16
(s
.f.u.)
18
19
20
21
22
Ap
F
1
0.7 c
m
23
Solar cycle number
P
e
ri
od-a
ve
raged am
pl
itude
1950
1960
1970
1980
1990
2000
0
1
2
3
4
5
foF2 midday
(0
.1 M
H
z)
foF2 mi
dni
ght
Fig. 3. Behaviour of the period averaged amplitude of the period band 25–31 days for foF2 (Moscow) for midday and midnight, Apand
F10.7 cm for the interval 1947–2001. The solar cycle maxima and minima are marked as in Fig. 1.
the period-averaged amplitude from the 25- to 31-day period of foF2, using all the hourly data, over 4-year intervals, be-fore sunspot minima for all stations, show that the amplitudes for even cycles are greater than for the odd ones.
4 Conclusions
The present investigation indicates the existence of 22-year cycle in the F2-layer ionization at mid-latitudes for both Northern and Southern Hemisphere. The midday and mid-night foF2 variations that reflect the 27-day solar rotation pe-riod, more precisely in the period range from 25 to 31 days,
show distinct enhancements in the late declining phases be-fore sunspot minima of the investigated solar cycles 18–22. These foF2 enhancements coincide strongly in time with the significant peaks of 27-day geomagnetic activity in the sec-ond half of the declining phase of each cycle. The even-high and odd-low pattern of the 27-day geomagnetic activity in the late declining phase of solar cycles is one of the main char-acteristics of the 22-year cycle in geomagnetic activity (Hap-good, 1993; Cliver et al., 1996), and the same pattern is well developed for the investigated foF2 time series (Figs. 1–4). Such behaviour is not typical for solar radio flux F10.7 cm variations as a proxy of ionizing EUV-radiation. There are
Table 1. Period-averaged amplitudes from 25- to 31-day periods of foF2 (all the hourly data, 0.1 MHz) over 4-year intervals before sunspot
minima. Note that time intervals are in a fraction of years. The last two rows show the period-averaged amplitudes for daily Apand F10.7 cm,
respectively. Solar cycle 18 19 20 21 22 Time interval 1950.3–1954.3 1960.9–1964.9 1972.5–1976.5 1982.8–1986.8 1992.4–1996.4 Slough (51.5◦N, 359.4◦E) 0.67 0.97 0.55 0.75 Moscow (55◦N, 37.3◦E) 0.88 0.68 1.05 0.71 0.88 Alma Ata (43.2◦N, 77◦E) 0.60 0.75 0.50 Tomsk (56.5◦N, 84.9◦E) 0.70 0.92 0.57 0.68 Irkutsk (52.5◦N, 104◦E) 0.72 0.92 0.50 Akita (39.7◦N, 140◦E) 0.75 0.82 0.68 Boulder (40◦N, 256.7◦E) 0.75 0.87 0.56 0.70 Mundaring (32◦S, 116.2◦E) 0.66 1.02 0.51 Hobart (42.9◦S, 147.3◦E) 0.90 0.50 1.10 0.49 Canberra (35.3◦S, 149◦E) 0.87 0.68 1.05 0.51 Christchurch (43.4◦S, 172.3◦E) 0.90 1.16 0.58 Ap(nT) 2.38 0.98 1.95 1.13 1.75 F10.7 cm (s.f.u.) 4.92 2.30 2.50 2.45 2.50
20
25
30
35
0
1
2
3
4
20
25
30
35
0
1
2
3
4
20
25
30
35
20
25
30
35
18
19
20
21
Period (days)
A
m
pl
itude (
0
.1 M
H
z)
1176 Apostolov et al.: 22-year cycle in the F2-layer no peaks of 27-day amplitudes in F10.7 cm during the
sec-ond half of the declining phases of solar cycles, particularly in the even cycles 20 and 22. Instead of that, the amplitudes of F10.7 cm decrease gradually, while for those of the geo-magnetic index Ap there are strong peaks also reflected in
the foF2 (Fig. 3). As an exception, the peak of the 27-day amplitude of F10.7 cm coincides in time with that of Ap for
solar cycle 18, but this coincidence does not contradict the existence of a 22-year variation in foF2 caused by geomag-netic activity, clearly expressed in the behaviour of Ap and
foF2 during solar cycles 19–22 (Fig. 2).
The obtained results are not surprising. A large part of F2-layer variability is linked to the geomagnetic activity (Forbes et al., 2000; Rishbeth and Mendillo, 2001). The possible causes of F2-layer variability related to the geomagnetic activity by means of Joule heating and energetic particle pre-cipitation, are linked with the substorms, magnetic storms, and interplanetary magnetic field/solar wind structures that depict strong solar rotation and a 22-year cycle variation.
Acknowledgements. This work was supported by the international
cooperation project 2001BG0012 between Geophysical Institute (Bulgarian Academy of Sciences) and Observatori de l’Ebre (Con-sejo Superior de Investigaciones Cientificas, Spain), and by project BTE2000-0825 MCYT of Spain.
Topical Editor M. Lester thanks M. F¨orster and R. Leitinger for their help in evaluating this paper.
References
Bouwer, S. D.: Periodicities of solar irradiance and solar activity indices, II, Solar Phys., 142, 365–389, 1992.
Cliver, E. W., Boriakoff, V., and Bounar, K. H.: The 22-year cycle of geomagnetic and solar wind activity, J. Geophys. Res., 101, 27 091–27 109, 1996.
Coleman Jr., P. J., and Smith, E. J.: An interpretation of the sub-sidiary peaks at periods near 27 days in the power spectra of Ci and Kp, J. Geophys. Res., 71, 4685–4691, 1966.
Courtillot, V., Le Mouel, J. L., and Mayaud, P. N.: Maximum en-tropy spectral analysis of the geomagnetic activity index aa over a 107-year interval, J. Geophys. Res., 82, 2641–2649, 1977. Currie, R. G.: Geomagnetic line spectra – 2 to 70 years, Astrophys.
Space Sci., 21, 425–438, 1973.
Delouis, H. and Mayaud, P. N.: Spectral analysis of the geomag-netic activity index aa over a 103-year interval, J. Geophys. Res., 80, 4681–4688, 1975.
Feichter, E. and Leitinger, R.: A 22-year cycle in the F-layer ioniza-tion of the ionosphere, Ann. Geophysicae, 15, 1015–1027, 1997. Fenimore, E. E., Asbridge, J. R., Bame, S. J., Feldman, W. C., and Gosling, J. T.: The power spectrum of the solar wind speed for periods greater than 10 days, J. Geophys. Res., 83, 4353–4357, 1978.
Forbes, J. M., Palo, S. E., and Zhang, X.: Variability of the iono-sphere, J. Atmos. Sol.-Terr. Phys., 62, 685–693, 2000.
Fraser-Smith, A. C.: Spectrum of the geomagnetic activity index Ap, J. Geophys. Res., 77, 4209–4220, 1972.
Gonzalez, A. L. C., Gonzalez, W. D., and Dutra, S. L. G.: Periodic variation in the geomagnetic activity: A study based on the Ap
index, J. Geophys. Res., 98, 9215–9231, 1993.
Hapgood, M. A.: A double solar cycle in the 27-day recurrence of geomagnetic activity, Ann. Geophysicae, 11, 248–254, 1993. Hocke, K.: Phase estimation with the Lomb-Scargle periodogram
method, Ann. Geophysicae, 16, 356–358, 1998.
Horne, J. H. and Baliunas, S. L.: A prescription for periodic analysis of unevenly sampled time series, Astrophys. J., 302, 757–763, 1986.
Letfus, V. and Apostolov, E. M.: Longitudinal distribution of re-current solar activity sources and its reflection in geomagnetic variations, Bull. Astron. Inst. Czechosl., 31, 119–122, 1980. Ondoh, T. and Nakamura, Y.: Solar cycle effect of 27-day
recur-rent geomagnetic storms, in Solar-Terrestrial Predictions Pro-ceedings, vol. IV, edited by Donnely, R.F., Space Environ. Lab., Boulder, Co., A-46–A-52, 1980.
Press, W. H., Teukolsky, S. A., Vetterling, W. T., and Flannery, B. P.: Numerical recipes in Fortran, Cambridge Univ. Press, 569–577, 1992.
Rishbeth, H. and Mendillo, M.: Patterns of F2-layer variability, J. Atmos. Sol.-Terr. Phys., 63, 1661–1680, 2001.
Scargle, J. D.: Studies in astronomical time series analysis. II. Sta-tistical aspects of spectral analysis of unevenly spaced data, As-trophys. J., 263, 835–853, 1982.
Titheridge, J., Leitinger, E. R., and Feichter, E.: Comparison of the long-term behaviour of the F-layer of the ionosphere, northern versus southern hemisphere, Kleinheubacher Ber., 39, 749–755, 1996.
Triskova, L.: The vernal-autumnal asymmetry in the seasonal varia-tion of geomagnetic activity, J. Atmos. Terr. Phys., 51, 111–118, 1989.