HAL Id: hal-00302545
https://hal.archives-ouvertes.fr/hal-00302545
Submitted on 29 Jan 2007HAL is a multi-disciplinary open access
archive for the deposit and dissemination of sci-entific research documents, whether they are pub-lished or not. The documents may come from teaching and research institutions in France or abroad, or from public or private research centers.
L’archive ouverte pluridisciplinaire HAL, est destinée au dépôt et à la diffusion de documents scientifiques de niveau recherche, publiés ou non, émanant des établissements d’enseignement et de recherche français ou étrangers, des laboratoires publics ou privés.
Application of synchrotron radiation for measurement of
iron red-ox speciation in atmospherically processed
aerosols
B. J. Majestic, J. J. Schauer, M. M. Shafer
To cite this version:
B. J. Majestic, J. J. Schauer, M. M. Shafer. Application of synchrotron radiation for measurement of iron red-ox speciation in atmospherically processed aerosols. Atmospheric Chemistry and Physics Discussions, European Geosciences Union, 2007, 7 (1), pp.1357-1390. �hal-00302545�
ACPD
7, 1357–1390, 2007 Iron speciation in atmospherically processed aerosols B. J. Majestic et al. Title Page Abstract Introduction Conclusions References Tables Figures ◭ ◮ ◭ ◮ Back Close Full Screen / EscPrinter-friendly Version Interactive Discussion
EGU
Atmos. Chem. Phys. Discuss., 7, 1357–1390, 2007 www.atmos-chem-phys-discuss.net/7/1357/2007/ © Author(s) 2007. This work is licensed
under a Creative Commons License.
Atmospheric Chemistry and Physics Discussions
Application of synchrotron radiation for
measurement of iron red-ox speciation in
atmospherically processed aerosols
B. J. Majestic, J. J. Schauer, and M. M. Shafer
Environmental Chemistry and Technology Program, University of Wisconsin – Madison, 660 N. Park St, Madison, WI 53706, USA
Received: 10 January 2007 – Accepted: 17 January 2007 – Published: 29 January 2007 Correspondence to: J. J. Schauer (jschauer@engr.wisc.edu)
ACPD
7, 1357–1390, 2007 Iron speciation in atmospherically processed aerosols B. J. Majestic et al. Title Page Abstract Introduction Conclusions References Tables Figures ◭ ◮ ◭ ◮ Back Close Full Screen / EscPrinter-friendly Version Interactive Discussion
EGU Abstract
In this study, ambient atmospheric particulate matter (PM) samples were collected using a size-resolved impactor sampler from three urban sites. The purpose of this study is to gain a better understanding of transformations of aerosol-bound iron as it is processed in the atmosphere. Thus, the aerosol samples were artificially aged to
5
represent long-term transport (10 to 40 days) or short-term transport (1 to 10 days) and were measured for iron at several time points. At each time point, iron was measured in each size fraction using three different techniques; 1) inductively coupled plasma-mass spectrometry (ICPMS) for total iron, 2) x-ray absorbance near edge structure (XANES) spectroscopy for the measurement of total Fe(II) and Fe(III), and 3) a
wet-10
chemical method to measure soluble Fe(II) and Fe(III). Prior to aging, the XANES spectroscopy results show that a majority (>60% for each size fraction) of the total iron
in the PM is in the form of Fe(III). Fe(III) was shown to be a significant fraction of the soluble iron (sometimes> 50%), but the relative significance of Fe(III) was found to
vary depending on the site. Overall, the total soluble iron depended on the sampling
15
site, but values ranged from less than 1% up to about 18% of the total iron. Over the course of the 40 day aging period, we found moderate changes in the relative Fe(II)/Fe(III) content. A slight increase was noted in the coarse (>2.5 µm) fraction
and a slight decrease in the 0.25 to 0.5µm fraction. The soluble fraction generally
showed (excepting one day) a decrease of soluble Fe(II) prior to 10 days of aging,
20
followed by a relatively constant concentration. In the short-term transport condition, we found that the sub-micron fraction of soluble Fe(II) spikes at 1 to 3 days of aging, then decreases to near the initial value at around 6 to 10 days. Very little change in soluble Fe(II) was observed in the super-micron fraction. These results show that changes in the soluble iron fraction occur within the lifetime of urban aerosols (1–
25
3 days) and, therefore, atmospheric processing can have a large effect on human exposure to soluble iron.
ACPD
7, 1357–1390, 2007 Iron speciation in atmospherically processed aerosols B. J. Majestic et al. Title Page Abstract Introduction Conclusions References Tables Figures ◭ ◮ ◭ ◮ Back Close Full Screen / EscPrinter-friendly Version Interactive Discussion
EGU 1 Introduction
Iron has proven to be a key element for the cycling of bulk components in atmospheric particulate matter (Conklin and Hoffmann, 1988; Zuo and Hoigne, 1994). In general, the release of hydroxyl radicals in aqueous aerosol extracts has been correlated to water-soluble iron concentration (Arakaki et al., 2006; Donaldson et al., 1997) which
5
can lead to oxidation of other aerosol species such as sulfur (as SO2) (Faust and
Hoffmann, 1986). The cycling of organic matter can also be affected by the chemical form of iron. Zuo and Deng (1997) have shown that the photo-catalytic decomposition of oxalic acid, a common component in atmospheric aerosols, is more efficiently driven by Fe(III), as compared to Fe(II) (Zuo and Deng 1997)
10
Results of a study performed by Zhuang et al. (1992) reveal that significant amounts of soluble Fe(II) can be found in remote marine aerosols. In addition, this study in-dicates that iron in atmospheric particles which are transported over long distances may undergo oxidation and reduction transformations in which Fe(II) and Fe(III) can be inter-converted. As atmospheric aerosols are generally complex, intra-mixed species
15
containing a variety of organic and inorganic species, it is extremely difficult to predict how the red-ox active transition metals will behave in atmospheric particulate matter (PM). Laboratory studies on iron-containing particles have shown that the oxidation and reduction of Fe(II) and Fe(III) species in atmospheric PM can depend on many factors including the electron donors present and the pH. One study revealed that a
20
formate solution is most effective for the photo-reduction of Fe(III) when compared to other common electron donors such as acetate and oxalate (Pehkonen et al., 1993). This study also found that the different chemical form of Fe(III) (e.g. hematite or amor-phous Fe(OH)3) is an important determining factor in the rate of photolysis. The red-ox
chemistry of iron has been shown to be an integral part of the sulfur cycle (Conklin and
25
Hoffmann, 1988). One study performed by Zhu et al. found that aerosols which are high in inorganic sea salt components (chloride, nitrate, and sulfate) tend to resist the photo-reduction of Fe(III) to Fe(II) during atmospheric transport (Zhu et al., 1993).
ACPD
7, 1357–1390, 2007 Iron speciation in atmospherically processed aerosols B. J. Majestic et al. Title Page Abstract Introduction Conclusions References Tables Figures ◭ ◮ ◭ ◮ Back Close Full Screen / EscPrinter-friendly Version Interactive Discussion
EGU
Quantification of iron into Fe(II) and Fe(III) in atmospheric particles has been achieved using a multitude of techniques including HPLC (Zhuang et al., 1992), com-plexation methods (Donaldson et al., 1997; Valavanidis et al., 2000), ion chromatog-raphy, and M ¨ossbauer spectroscopy (Hoffmann et al., 1996; Hoffmann et al., 1994). Aside from M ¨ossbauer spectroscopy, all of these techniques are wet-chemical
tech-5
niques and require the iron to be extracted into an aqueous solution. These studies show that, despite the relatively high solubility of Fe(II) compared to Fe(III), Fe(II) was often just a minor component of the soluble iron fraction with the Fe(II) in the soluble fraction ranging from below the detection limit up to about 15% of the total soluble iron. The Fe(II) content in fog and cloud water, however, was shown to have a much greater
10
Fe(II) content ranging from 20 up to 90%. This difference may be due to the pH of cloud water versus atmospheric PM (Jacob et al., 1985; Kieber et al., 2005).
Of the techniques used to quantify Fe(II) and Fe(III) in atmospheric PM, M ¨ossbauer spectroscopy is the only method which can directly measure the chemical speciation, however significant sample mass is needed, which limits the applicability of the
tech-15
nique to ambient and personal atmospheric PM exposure samples. Other techniques, such as ray absorption near edge structure (XANES) spectroscopy and extended x-ray absorption fine structure (EXAFS), can be used to directly measure the oxidation state of a metal in a solid matrix and requires no wet-chemical extraction step. XANES and EXAFS have both been used to determine the oxidation states of iron in
environ-20
mental samples and in the emissions from atmospheric pollution sources (Torok et al., 1994; Zaw et al., 2002), where analyte concentrations are elevated. However, work addressing the oxidation state of transition metals in atmospheric samples using these techniques has not been reported. It is currently known that iron can be inter-converted between Fe(II) and Fe(III) in ambient aerosols however, the time-scales of these
pro-25
cesses have not been studied. Using atmospheric PM collected from three different urban locations, in this study we investigate the processing of iron in the atmosphere. The aerosols are artificially aged in a tightly regulated temperature, relative humidity, and light environment where the total iron, total Fe(II) and Fe(III), and soluble Fe(II) and
ACPD
7, 1357–1390, 2007 Iron speciation in atmospherically processed aerosols B. J. Majestic et al. Title Page Abstract Introduction Conclusions References Tables Figures ◭ ◮ ◭ ◮ Back Close Full Screen / EscPrinter-friendly Version Interactive Discussion
EGU
Fe(III) are measured as a function of exposure time.
2 Materials and methods
2.1 Sampling
Size-fractionated PM10 (particles with an aerodynamic diameter <10 µm) samples
were collected for two days each in East St. Louis, IL, Los Angeles, CA, and
Wauke-5
sha, WI. The East St. Louis site is a US EPA-funded Supersite and is in an urban residential/light commercial area is about 3 km east of St. Louis, MO (Bae et al., 2004). Waukesha, WI is approximately 20 km west of Milwaukee, WI and the site is on a four-lane suburban road. The site is fenced in and the samplers were raised to fence level approximately 2.5 meters above the ground. The area is a mix of residences and
10
heavy industry, and the site itself is adjacent to an automobile body shop (Sheesley et al., 2005). The Los Angeles site is located in the Los Angeles Basin at the Rancho Los Amigos Medical Research Center facility. This site is dominated by mobile sources and is known to have some of the highest PM10 levels in the US, often exceeding the National Ambient Air Quality Standards (NAAQS) of 150µg m−3 (Singh et al. 2002).
15
For PM collection, four co-located Sioutas personal cascade impactor samplers (Misra et al., 2002; Singh et al., 2003) were used, each operated at 9 Lpm for 24 h. This sampler separates the PM into five different size fractions: >2.5 µm, 2.5–1 µm, 1– 0.5µm, 0.5–0.25 µm, and <0.25 µm. In three of the samplers, Teflon (Zefluor, 3.0 µm
pore size) impactor substrates were utilized. In the fourth sampler, high purity
alu-20
minum foil substrates (99.9995% metals basis, Alfa Aesar) were used. In all samplers, the after filter was a 37 mm Telfon (Teflo, 2.0µm pore size) substrate. Particulate matter
samples collected on the Teflon and aluminum substrates were placed in acid-cleaned Petri dishes, sealed with Teflon tape, double bagged under nitrogen, and stored in a cooler for shipment to UW-Madison.
25
par-ACPD
7, 1357–1390, 2007 Iron speciation in atmospherically processed aerosols B. J. Majestic et al. Title Page Abstract Introduction Conclusions References Tables Figures ◭ ◮ ◭ ◮ Back Close Full Screen / EscPrinter-friendly Version Interactive Discussion
EGU
ticulate matter collection, sampling handling, and analysis phases. All pre- and post-sampling handling of the substrates were performed in a dedicated trace-metal clean room. Before use, all collection substrates were subjected to rigorous acid-washing protocols, which have been show to minimize trace-metal contamination. For Teflon materials, this procedure includes a series of three rinses: trace-metal grade
hy-5
drochloric acid (Fisher), trace-metal grade nitric acid (Fisher), followed by>18.0 MΩ
water. Prior to sampling, the aluminum substrates were rinsed and sonicated in dichloromethane followed by methanol. All substrates were conditioned in a constant temperature and relative humidity environment for at least 24 h and weighed on a mi-crobalance pre- and post-sampling.
10
2.2 Aerosol aging
In a trametal clean room, the substrates were cut into sections using either a ce-ramic knife or cece-ramic scissors. For each size fraction on each sampling day, the Teflon filters (25 mm Zefluor and 37 mm Teflo) were cut in half while the aluminum foil substrates were cut into fourths. This resulted in six identical Teflon and four
identi-15
cal aluminum substrates for each size fraction (no aluminum substrates were used for the after filter) for each day. One aluminum quarter and one Teflon half were imme-diately placed in a dark, nitrogen atmosphere at –20◦C. This corresponds to the Time t=0 day time point. The others were artificially aged in a tightly controlled temper-ature (20.7±0.2◦C), relative humidity (42.8±1.1%) and light (250 µEinsteins, 16 h on,
20
8 h off) environment at the Biotron at the UW-Madison for varying aging times. The East St. Louis and the Los Angeles filters were selected to represent long-term aerosol transport and were aged for periods of 0, 10, 20, and 40 days. The Waukesha, WI aerosols were selected to represent short-term aerosol transport and were aged for 0, 1, 3, 6, and 10 days.
25
For each stage, total iron was measured by high resolution – ICPMS by using 1/2
of a Teflon filter digested using a low-volume microwave-assisted acid digestion. At each time point and each size fraction, iron LII and LIII edge XANES spectra were
ac-ACPD
7, 1357–1390, 2007 Iron speciation in atmospherically processed aerosols B. J. Majestic et al. Title Page Abstract Introduction Conclusions References Tables Figures ◭ ◮ ◭ ◮ Back Close Full Screen / EscPrinter-friendly Version Interactive Discussion
EGU
quired from the aluminum substrates on the high energy and resolution monochromator (HERMON) beamline Synchrotron Radiation Center (SRC). In parallel with the XANES measurement of total Fe(II)/Fe(III), soluble Fe(II) and Fe(III) was determined from the Teflon sections using the Ferrozine method as applied to atmospheric aerosols (Ma-jestic et al., 2006) at each time point.
5
2.3 Total iron determination
Total iron measurements were achieved using a low-volume microwave-assisted di-gestion method shown to minimize trace-metal contamination followed by analysis by inductively coupled plasma-mass spectrometry (ICPMS). The polypentene support ring from the Teflo filter is removed and the filter membrane is placed in a Teflon digestion
10
bomb with a mixture of high purity acids (1.5 mL 16 N HNO3, 0.5 mL 12 N HCl, 0.2 mL
28 N HF). Solubilization of the PM was achieved by subjecting the sealed Teflon bombs to a programmed microwave digestion (Ethos, Milestone) [9 minute temperature ramp to 180◦C followed by a 10 min hold at 180◦C] and diluted to 30 mL with>18.0 MΩ
wa-ter. A typical analytical batch consisted of 22 unknowns, 6 standard reference materials
15
(SRMs), 4 matrix blanks, 2 method blanks, and 2 matrix spikes. These included the National Institute of Standards and Technology (NIST) SRMs: Recycled Auto Catalyst (SRM #2556), Urban Dust (SRM #1649a), and San Joaquin Soil (SRM #2709). More details of the method can be found elsewhere (Lough et al., 2005)
2.4 Total Fe(II) and Fe(III) determination
20
XANES data were collected at the Synchrotron Radiation Center (SRC), operated, in part by the University of Wisconsin – Madison, in Stoughton, WI on the high energy and resolution monochromator (HERMON) beamline. Initial beam current was approx-imately 280 mA and the electron energy was constant at 800 MeV. Experiments were performed under ultra-high vacuum (UHV) conditions (∼10−10 torr) using a total
elec-25
ACPD
7, 1357–1390, 2007 Iron speciation in atmospherically processed aerosols B. J. Majestic et al. Title Page Abstract Introduction Conclusions References Tables Figures ◭ ◮ ◭ ◮ Back Close Full Screen / EscPrinter-friendly Version Interactive Discussion
EGU
replicates of 10 across a scan range that included the zero-valent Fe LII(719.9 eV) and LIII(706.8 eV) edges and were normalized against a gold mesh current to account for beam decay.
There are currently no well-established methods for performing UHV XANES spec-troscopy on ambient atmospheric particulate matter. The choice of both particulate
5
matter sampler and substrate are critical for successful UHV TEY analysis. We found that the Sioutas personal cascade impactor sampler (Singh et al., 2002) was ideal for this application as it concentrates the particulate into a narrow line (1–2 mm) at which the x-ray beam can be focused. In terms of the collection substrate, we determined in our preliminary studies that the particulate matter must be collected on a substrate
10
with the following attributes, if direct analysis on the substrate is sought: Conducting, smooth surface, low interference with target species, and compatible with particulate matter samplers. Teflon filters which are commonly used for trace metal collection and, while Teflon is not a conducting material, products such as silver pastes can be used to increase conductivity. However, use of Teflon substrates is problematic in that the
15
fluorine in the material has a very strong K-edge absorption at around 697 eV. The extreme intensity of this edge causes a strong interference with the iron L-edge at around 707 eV and, therefore, cannot be used in this measurement. Quartz is another substrate which is commonly used in atmospheric samplers, however, the lack of a smooth surface precludes its use in iron L-edge measurements. High purity aluminum
20
foil possesses all of the required substrate attributes to be used in TEY XANES spec-troscopy analysis. Therefore, a Sioutas personal cascade impactor sampler (Singh et al., 2002) was used with high-purity (99.9995%) aluminum foil as impactor substrates for all XANES spectroscopy analyses.
At the LIII edge, divalent iron shows a sharp absorption at 707.8 eV followed by a
25
less intense peak at 710.5 eV, while trivalent iron shows a less intense peak around 708.0 eV followed by a very intense peak at 709.5 eV (van Aken et al., 1998). Several methods have been used to calculate the Fe(II)/Fe(III) ratio from an unknown XANES spectrum (Garvie and Buseck, 1998; van Aken and Liebscher, 2002; van Aken et al.,
ACPD
7, 1357–1390, 2007 Iron speciation in atmospherically processed aerosols B. J. Majestic et al. Title Page Abstract Introduction Conclusions References Tables Figures ◭ ◮ ◭ ◮ Back Close Full Screen / EscPrinter-friendly Version Interactive Discussion
EGU
1998). In general, these methods include calculations based on both the LII and the LIII regions on the spectra. As can be seen in Fig. 1 (example spectra showing a 70% Fe(II) standard and an actual ambient sample) the LII edge in our samples is
generally not observed, or is very noisy due to the relatively low iron concentration in our samples compared to the iron standards and unknown samples used by other
5
researchers. Therefore, a method to calculate Fe(II)/Fe(III) in dilute Fe samples was devised using only the LIII edge as a reference. The LIII edge (or “white – line”) portion
of the mesh-normalized spectrum was first baseline-subtracted, then the relative Fe(II) and Fe(III) peak heights were determined individually and the ratio of the peak heights was found to depend on the Fe(II)/Fe(III) ratio.
10
Fe(II) and Fe(III) standards were prepared from Fe(II) and Fe(III) ammonium sulfate salts in various proportions. A standard curve was prepared using Fe(II)/Fe(III) ratios of 0, 0.1, 0.3, 0.5, 0.7, 0.9, and 1 (Fig. 2). Figure 2 shows that the calibration curve is best described as a 2nd power polynomial (r2=1.000).
External precision for the XANES spectroscopy measurement on actual samples
15
was estimated by measuring the 0.5–0.25µm size fraction at the 40 day time point
collected on 13 February 2006 from Los Angeles. This sample was measured at five different spots on the PCIS sample line. The Fe(II) concentration was found to be 5.94±0.84 ng m−3, which corresponds to a RSD of 14.2% and is the overall uncertainty associated with this measurement.
20
2.5 Soluble Fe(II) and Fe(III) determination
Soluble Fe(II) and Fe(III) was quantified using the Ferrozine (FZ) method as applied to atmospheric aerosols (Majestic et al., 2006). In short, Teflon filters were leached in pH = 4.3 acetate buffer (500 µM total acetate) under gentle agitation for two hours. After this extraction period, the leachate was immediately filtered through an acid-cleaned
25
0.2µm polypropylene filter (Whatman) where stock Ferrozine solution was added to the
filtrate up to a final concentration of 55µM Ferrozine. About 1.5 mL of this solution was
ACPD
7, 1357–1390, 2007 Iron speciation in atmospherically processed aerosols B. J. Majestic et al. Title Page Abstract Introduction Conclusions References Tables Figures ◭ ◮ ◭ ◮ Back Close Full Screen / EscPrinter-friendly Version Interactive Discussion
EGU
Instruments Inc., Sarasota, FL) and the absorption spectrum was obtained from 400 to 700 nm. The peak at 562 nm (the maximum absorption of the Fe(II)-FZ complex) was monitored and compared against previously made calibration curves in order to determine the labile Fe(II) content on the filter. To the remaining filtrate, hydroxylamine hydrochloride was added (final concentration = 55 µM) in order to reduce any Fe(III)
5
in solution to Fe(II). Then, FZ solution was again added and the total soluble iron was measured. Soluble Fe(III) was determined by subtracting the soluble Fe(II) from the total soluble iron.
3 Results
3.1 Aerosol sourcing
10
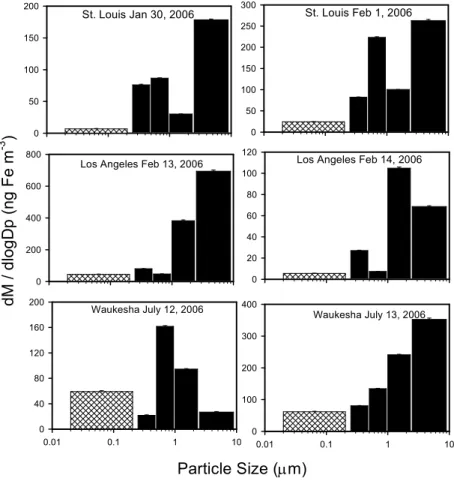
The size-resolved iron concentrations as measured by ICPMS for the East St. Louis, Los Angeles, and Waukesha, WI sites are presented in Fig. 3. East St. Louis and Los Angeles show modes in the coarse fraction signifying resuspended soil, automobile brake dust, and road dust as a source as well as smaller modes in the sub-micron mode indicating combustion source contributions. The 12 July date in Waukesha, WI
15
shows very little contribution in the coarse fraction, and therefore we expect very little contribution from crustal elements (aluminum, magnesium, calcium) in these samples. For the 13 July date in Waukesha, we observe most of the iron occurring in the coarse fraction of particles, but there is no mode in the submicron fraction as in East St. Louis and Los Angeles. The solid bars in these graphs indicate that speciation
[determina-20
tion of both Fe(II) and Fe(III)] in these size fractions were measured by both XANES spectroscopy and the Ferrozine method while the hatched bars (smallest size fraction) indicate speciation by only the Ferrozine method.
In order to better understand the sources of the aerosols (and iron), size-resolved plots of sulfur with common crustal elements (aluminum, calcium, and magnesium) and
25
ACPD
7, 1357–1390, 2007 Iron speciation in atmospherically processed aerosols B. J. Majestic et al. Title Page Abstract Introduction Conclusions References Tables Figures ◭ ◮ ◭ ◮ Back Close Full Screen / EscPrinter-friendly Version Interactive Discussion
EGU
in Fig. 4 and Fig. 5, respectively. On 12 July 2006 in Waukesha and on 14 February 2006 in Los Angeles, only a small portion of the crustal elements (Fig. 4) are present in the coarse fraction, which is consistent with the total iron data shown in Fig. 3. In Waukesha, WI on 13 July, we observe about a 5 times increase in crustal contribution relative to 12 July in the coarse fraction, which is also consistent with the total iron
5
size-distribution shown in Fig. 3.
The particulate matter collected in Los Angeles on 14 February 2006 shows very low air concentrations of industrial source indicator metals (Fig. 5) indicating that con-tribution from anthropogenic sources such as chrome plating and steel manufacturing (manganese and chromium) are small compared to the other sites. The Los Angeles
10
PM shows a higher relative contribution from barium and copper which implies a sig-nificant contribution from mobile sources (Garg et al., 2000). The East St. Louis PM shows a very high relative contribution from lead on 30 January 2006 and from both lead and barium on 1 February 2006. To a lesser extent, copper and manganese are also significant in the 1 February 2006 aerosols. Overall, the Waukesha, WI sampling
15
site shows the greatest amount of industrial source indicator metals with a consistent relative metals distribution over the course of the two days. These values are about 2 times those in East St. Louis and about 10 times those in Los Angeles. Los Angeles is impacted by mobile sources much more so than the other two sites and the much lower metal levels in Los Angeles demonstrate the impact of industrial sources on
concen-20
tration of metals associated with particulate matter. Relative to the other two sites, the particulate matter collected in Waukesha showed extremely high levels of chromium and manganese, especially in the ultra-fine fraction, which is likely due to the presence of a casting foundry less than 1.5 km directly east of the sampling site and stainless steel fabrication facility approximately 0.3 km south of the site. A significant amount of
25
ACPD
7, 1357–1390, 2007 Iron speciation in atmospherically processed aerosols B. J. Majestic et al. Title Page Abstract Introduction Conclusions References Tables Figures ◭ ◮ ◭ ◮ Back Close Full Screen / EscPrinter-friendly Version Interactive Discussion
EGU
3.2 XANES speciation
In Fig. 6, we show the total size-resolved Fe(II) (solid fraction) and total Fe(III) (hatched fraction) as measured by XANES spectroscopy. Note that there is no data for the size fraction<0.25 µm as it is not possible to use the necessary aluminum substrate as the
after-filter in the PCIS. The dominance of Fe(III) in all size fractions and samples is
5
clearly evident. Our experiments were not able to determine in which chemical form the Fe(III) is bound, but it is likely found as goethite, hematite, or magnetite (Hoffmann et al., 1996). The “ *” in the 13 July 2006 Waukesha size-distribution indicates that no XANES data was available for this size-fraction on this day.
Figure 7 presents the size-resolved total Fe(II) and Fe(III) content after aging the
10
30 January 2006 sample collected at the St. Louis Midwest Supersite over the course of 40 days in the BioTron. In this sample, a sharp increase (100% increase) in Fe(II) is observed in the coarse fraction between zero and ten days. Following 10 days, however, there is very little change in the Fe(II)/Fe(III) ratio in this size fraction. In contrast, the smallest size fraction measured (0.5–0.25µm) shows a relatively small
15
increase (17%) in the Fe(II) fraction after 10 days, and then decreases significantly over the next 30 days of aging.
The plots in Fig. 8 summarize the Fe(II) concentrations (ng m−3) for all of the samples collected in St. Louis and Los Angeles. As each plot shows a different size-fraction, the trends for Fe(II) collected in varying sizes can be monitored over the course of the
20
aging period. In general, the Fe(II) contained in the coarse fraction (>2.5 µm) tends
to increase over time while, in the smallest fraction measured (0.5–0.25µm), the Fe(II)
shows a tendency to decrease over this time period. The intermediate size fractions show very little change over the course of the study. As most of the iron tends to be concentrated in the coarse fraction (>2.5 µm), this leads to an overall increase in Fe(II)
25
ACPD
7, 1357–1390, 2007 Iron speciation in atmospherically processed aerosols B. J. Majestic et al. Title Page Abstract Introduction Conclusions References Tables Figures ◭ ◮ ◭ ◮ Back Close Full Screen / EscPrinter-friendly Version Interactive Discussion
EGU
3.3 Soluble iron speciation
The size-fractioned soluble Fe(II) (solid portion) and Fe(III) (hatched portion) content in the unaged (t = 0 days) samples are presented in Fig. 9. Despite the total iron levels in a sample, all of the soluble iron levels [Fe(II) + Fe(III)] range from around 0.4 to 11 ng m−3. Unlike the relatively low Fe(II)/Fe(III) ratios observed in the bulk particles,
5
the soluble fraction tends to be primarily Fe(II), although significant amounts of Fe(III) are present in many samples. It is also observed that each sampling site has a different soluble iron signature for these two sampling days. The PM from Waukesha, WI shows a relatively even iron size-distribution with a very small mode around 1µm. Further,
for all size fractions on both days sampled in Waukesha, soluble Fe(II) and soluble
10
Fe(III) were approximately equal (i.e. Fe(II)sol/Fe(total)sol ∼0.5). The PM collected in
Los Angeles showed a soluble iron size distribution more similar to that of the total iron distribution from Fig. 3 prior to aging, and the greatest air concentration of solu-ble iron of any of the sites. The Los Angeles site also shows a much greater relative coarse contribution of soluble iron compared with the other two sites. In general, the
15
Fe(II)sol/Fe(total)solfractions in Los Angeles were around 0.75, with the ratio approach-ing 0.9 for the particles <0.25 µm, significantly greater than the Waukesha, WI site.
Lastly, both East St. Louis samples showed modes at around 0.5µm, but little other
similarities were present. The 1 February 2006 day showed, by far, the greatest differ-ence between coarse and PM2.5 soluble iron for all samples with the PM2.5 fraction
20
about 32 times greater than the coarse fraction. In contrast to the PM collected in Los Angeles, the PM collected in East St. Louis showed a relatively low Fe(II)sol/Fe(total)sol ratio of 0.4 for the particles<0.25 µm and an extremely high ratio (0.98) for all other
size fractions indicating that very little soluble Fe(III) is present in the PM >0.25 µm
collected in East St. Louis during this sampling period.
25
To better understand the trends of labile iron in the East St. Louis, Los Angeles, and Waukesha, WI samples, the coarse and PM2.5 fractions of per cent leachable iron relative to total iron and total Fe(II) are presented in Table 1. Table 1 shows that the
ACPD
7, 1357–1390, 2007 Iron speciation in atmospherically processed aerosols B. J. Majestic et al. Title Page Abstract Introduction Conclusions References Tables Figures ◭ ◮ ◭ ◮ Back Close Full Screen / EscPrinter-friendly Version Interactive Discussion
EGU
fraction of soluble iron can significantly vary depending on the sample with the total soluble iron fraction ranging from <1–17% of the total iron. This likely depends on
the atmospheric processing of the aerosol prior to collection as well as the source. Further, with the exception of the 14 February 2006 Los Angeles and the 12 July 2006 Waukesha, WI sampling dates, the PM2.5 aerosols have a greater labile fraction than
5
the coarse particles. Prior to both of these sampling days, there was a light rain and, as a result, the coarse particles were largely washed out of the atmosphere. This resulted in relatively low concentrations of coarse iron as well as different iron speciation relative to the other sampling days (see Table 1).
Table 1 also presents a comparison of leachable Fe(II) to total Fe(II). Of the total
10
Fe(II), the leachable fraction of PM2.5 Fe(II) ranges from 9% up to almost 40%. While this is a relatively broad range, it is clear that a majority of the Fe(II) in these urban atmospheric aerosols are not in a soluble phase. Size-fraction comparisons in Table 1 show that three of the samples have a greater labile fraction in the coarse particles while the other two show a greater labile fraction in the PM2.5 fraction. This
compari-15
son was not possible on the 13 July 2006 sample collected in Waukesha, WI as XANES data was not available. It should be noted, however, that this is not a direct compari-son as particles<0.25 µm are not included in this analysis because XANES analysis
was not possible for this size-fraction. Given that a majority of the soluble iron in the particles<0.25 µm is Fe(II), the actual fraction of soluble Fe(II) of the total Fe(II) in the
20
PM2.5 size range will be greater than shown in Table 1. This effect will be marginal, however, as the iron concentration in this fraction is generally small relative to the other size fractions.
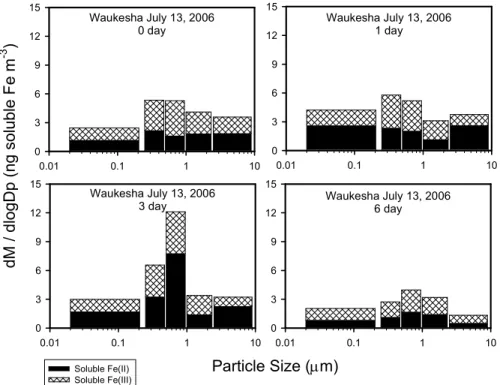
The influence of aging on size-resolved iron is shown in Fig. 10 for the samples collected on 12 July 2006 from Waukesha, WI. Over the six day aging period, the
25
soluble Fe(II) in the coarse fraction is seen to slightly increase over the first day, then decreases over 3–6 days whereas the soluble Fe(III) content in the coarse fraction remains relatively steady. This leads to an overall decrease in soluble iron in the coarse fraction over time. The most prominent feature in these plots is the Fe(II) spike at 3 days
ACPD
7, 1357–1390, 2007 Iron speciation in atmospherically processed aerosols B. J. Majestic et al. Title Page Abstract Introduction Conclusions References Tables Figures ◭ ◮ ◭ ◮ Back Close Full Screen / EscPrinter-friendly Version Interactive Discussion
EGU
in the size range of 1–0.25µm and the Fe(II) spike at 1 day for particles <0.25 µm,
while Fe(III) remains relatively constant. This indicates that Fe(II) and/or Fe(III) are undergoing chemical changes which result in a higher solubility for Fe(II). After six days, however, both species return to their approximate initial levels, suggesting that insoluble iron forms of Fe(II) and Fe(III) are being formed.
5
The particulate matter collected at the East St. Louis and Los Angeles sites were aged for 40 days and the Waukesha samples were aged for 10 days. The results of the East St. Louis and Los Angeles study are shown in Fig. 11 and the results of the Waukesha study is shown in Fig. 12. Both figures present the air concentration (ng m−3) of soluble Fe(II) versus aging time.
10
In the 40 day experiments, four data points (0, 10, 20, and 40 days) were collected (Fig. 11). For three of the four sampling days in St. Louis and Los Angeles, a sharp decrease of soluble Fe(II) within 10 days of sampling is observed. The 1 February 2006 sampling date in East St. Louis is the only one which does not follow this trend. In this day, both size fractions>1 µm actually show an increase in Fe(II) after the initial
15
measurement. The iron contained in the sub-micron particles follow the trend of the other sampling days. This reason for this difference is not yet clear, but likely is, in part, due to the very different initial soluble Fe(II) compared to the other days as seen in Fig. 9.
In order to achieve a better understanding of the chemical processes which occur
20
within 10 days of PM collection, the aerosols from Waukesha, WI were aged for shorter time periods of 0, 1, 3, 6, and 10 days. The air concentration of the soluble Fe(II) is presented in Fig. 12 for all of these time points. These plots show that in the sub-micron region, Fe(II) shows a sharp spike at all size-fractions around 1–3 days. Following this spike, the values return to near their initial state. The super-micron particles did not
25
show this behavior. In fact, these particles show very little, if any, increase in soluble Fe(II) over the course of the study, and generally showed a decreasing trend. These results are also summarized in Table 2.
ACPD
7, 1357–1390, 2007 Iron speciation in atmospherically processed aerosols B. J. Majestic et al. Title Page Abstract Introduction Conclusions References Tables Figures ◭ ◮ ◭ ◮ Back Close Full Screen / EscPrinter-friendly Version Interactive Discussion
EGU
4 Discussion
In this study, we have developed a XANES spectroscopy method to determine the total Fe(II) and Fe(III) content in limited-mass atmospheric aerosol personal exposure samples. Coupled with a wet-chemical iron speciation method, we measured how the speciation of ambient iron changes under tightly controlled atmospheric conditions.
5
In all sampling locations, we found that the total iron in all size fractions >0.25 µm
is primarily in the form of Fe(III), however most of the soluble fraction is in the form of Fe(II) with variable but significant contributions of Fe(III). It was also found that a majority of the Fe(II) in the PM2.5 fraction was not labile in our leaching solution (pH = 4.3 acetate buffer).
10
Very little similarity is observed between the total iron and the soluble iron trends. The XANES data reveals that the overall Fe(II) and Fe(III) temporal trend follows a rel-atively smooth relationship with very few (and less pronounced) Fe(II) spikes observed for any size fraction. However, the soluble iron fraction (especially in the sub-micron fraction) shows distinct peaks of Fe(II) within the 1–3 day aging window. The reason
15
for this apparent contradiction could be two-fold. First, the soluble iron is generally a very small fraction of the total iron in the sample ranging from<1% to about 20% of
the total (see Table 1). Therefore, small changes in the soluble iron fraction may be below the detection limit in the less-sensitive total iron XANES measurements. Sec-ond, even though Fe(0) was not observed in the XANES measurements, it is possible
20
that a very small fraction (<1%) of the total iron was, in fact, Fe(0). Ultra-fine Fe(0)
particles have been observed by other researchers to oxidize to Fe(II) and then Fe(III) (Papaefthymiou et al., 1990; Parkhomenko et al., 1990), which would also explain the behavior of the submicron soluble iron fraction in the Waukesha, WI samples during short-term transport.
25
The XANES results showed that Fe(II) associated with the coarse fraction had a tendency to increase over time while the Fe(II) associated with the smaller fraction (0.5–0.25µm) tended to decrease over time. These changes were sometimes
signifi-ACPD
7, 1357–1390, 2007 Iron speciation in atmospherically processed aerosols B. J. Majestic et al. Title Page Abstract Introduction Conclusions References Tables Figures ◭ ◮ ◭ ◮ Back Close Full Screen / EscPrinter-friendly Version Interactive Discussion
EGU
cant over a 40 day time-span, but this is much longer than the atmospheric residence time of most atmospheric PM. On the timescale of urban aerosols (around 1 week), there was generally very little change in the total Fe(II) concentrations. Because of the applications to long-range transport, however, a short discussion regarding the poten-tial processes which dictate species-conversion is warranted. Within atmospheric PM,
5
there likely exists a competition between the photo-reduction to Fe(II) and atmospheric oxidation to Fe(III). We expect that, because of the greater reactive surface area on the smaller particles, oxidation will be the dominating mechanism, thus pushing this balance towards Fe(III). In contrast, photo-reduction will be the dominating mechanism for the larger particles, thus shifting the equilibrium towards Fe(II).
10
In comparison to the total Fe(II) and Fe(III) trends, more drastic changes were noted in the soluble iron fraction. With the exception of the super-micron fraction on the 1 February sampling date, we observed that, after around 10 days of aging, the soluble fraction of Fe(II) was stable for at least 40 days. In the short-term time experiments, we observed a spike in soluble Fe(II) after 1–3 days, followed by a sharp decline after
15
6–10 days (see Table 3). The aerosols in this project were aged in an atmosphere which only represents one possible atmospheric condition. It is not clear what changes in the iron speciation would occur under different conditions (i.e., cloudy, very high or low relative humidities). However, since the changes in soluble iron occur rather rapidly (1–3 days), our experiments imply that atmospheric processing can have a large effect
20
on the actual exposure of soluble iron.
Acknowledgements. This study was supported by the Health Effects Institute grant #02-11. This work is based in part upon research conducted at the Synchrotron Radiation Center, University of Wisconsin-Madison, which is supported by the National Science Foundation under award no. DMR-0537588. We also wish to thank M. Severson, B. Pedley, and M. Bissen of the
25
ACPD
7, 1357–1390, 2007 Iron speciation in atmospherically processed aerosols B. J. Majestic et al. Title Page Abstract Introduction Conclusions References Tables Figures ◭ ◮ ◭ ◮ Back Close Full Screen / EscPrinter-friendly Version Interactive Discussion
EGU References
Arakaki, T., Kuroki, Y., Okada, K., Nakama, Y., Ikota, H., Kinjo, M., Higuchi, T., Uehara, M., and Tanahara, A.: Chemical composition and photochemical formation of hydroxyl radicals in aqueous extracts of aerosol particles collected in Okinawa, Japan, Atmos. Environ., 40(25), 4764–4774, 2006.
5
Bae, M. S., Schauer, J. J., DeMinter, J. T., and Turner, J. R.: Hourly and daily patterns of particle-phase organic and elemental carbon concentrations in the urban atmosphere, J. Air Waste Manage. Assoc., 54(7), 823–833, 2004.
Conklin, M. H. and Hoffmann, M. R.: Metal-Ion Sulfur(IV) Chemistry.3. Thermodynamics And Kinetics Of Transient Iron(III) Sulfur(IV) Complexes, Environ. Sci. Technol., 22(8), 899–907,
10
1988.
Donaldson, K., Brown, D. M., Mitchell, C., Dineva, M., Beswick, P. H., Gilmour, P., and MacNee, W.: Free radical activity of PM10: Iron-mediated generation of hydroxyl radicals, Environ. Health Perspect., 105, 1285–1289, 1997.
Faust, B. C. and Hoffmann, M. R.: Photoinduced Reductive Dissolution Of Alpha-Fe2O3 By
15
Bisulfite, Environ. Sci. Technol., 20(9), 943–948, 1986.
Garg, B. D., Cadle, S. H., Mulawa, P. A., Groblicki, P. J., Laroo, C., and Parr, G. A.: Brake wear particulate matter emissions, Environ. Sci. Technol., 34(21), 4463–4469, 2000.
Garvie, L. A. J. and Buseck, P. R.: Ratios of Ferrous to Ferric Iron from Nanometre-sized Areas in Minerals, Nature, 396, 667–670, 1998.
20
Hoffmann, P., Dedik, A. N., Ensling, J., Weinbruch, S., Weber, S., Sinner, T., Gutlich, P., and Ortner, H. M.: Speciation of iron in atmospheric aerosol samples, J. Aerosol Sci., 27(2), 325–337, 1996.
Hoffmann, P., Sinne, R. T., Dedik, A. N., Karandashev, V. K., Malyshev, A. A., Weber, S., and Ortner, H. M.: Iron In Atmospheric Aqueous And Particulate Samples, Fresenius J. Anal.
25
Chem., 350(1–2), 34–37, 1994.
Jacob, D. J., Waldman, J. M., Munger, J. W., and Hoffmann, M. R.: Chemical-Composition Of Fogwater Collected Along The California Coast, Environ. Sci. Technol., 19(8), 730–736, 1985.
Kieber, R. J., Skrabal, S. A., Smith, B. J., and Willey, J. D.: Organic complexation of Fe(II)
30
and its impact on the redox cycling of iron in rain, Environ. Sci. Technol., 39(6), 1576–1583, 2005.
ACPD
7, 1357–1390, 2007 Iron speciation in atmospherically processed aerosols B. J. Majestic et al. Title Page Abstract Introduction Conclusions References Tables Figures ◭ ◮ ◭ ◮ Back Close Full Screen / EscPrinter-friendly Version Interactive Discussion
EGU
Lough, G. C., Schauer, J. J., Park, J. S., Shafer, M. M., Deminter, J. T., and Weinstein, J. P.: Emissions of metals associated with motor vehicle roadways, Environ. Sci. Technol., 39(3), 826–836, 2005.
Majestic, B. J., Schauer, J. J., Shafer, M. M., Turner, J. R., Fine, P. M., Singh, M., and Sioutas, C.: Development of a Wet-Chemical Method for the Speciation of Iron in
Atmo-5
spheric Aerosols, Environ. Sci. Technol., 40, 2346–2351, 2006.
Misra, C., Singh, M., Shen, S., Sioutas, C., and Hall, P. A.: Development and evaluation of a personal cascade impactor sampler (PCIS), J. Aerosol. Sci., 33(7), 1027–1047, 2002. Papaefthymiou, V., Kostikas,, A., Simopoulos, A., Niarchos, D., Gangopadyay, S., Hadjipanayis,
G. C., Sorensen, C. M., and Klabunde, K. J.: Magnetic Hysteresis And Mossbauer Studies
10
In Ultrafine Iron Particles, J. Appl. Phys., 67(9), 4487–4489, 1990.
Parkhomenko, V. D., Kolodyazhnyi, A. T., Galivets, Y. D., and Pokholok, K. V.: Mossbauer-Spectroscopy Applied To Surfaces Of Ultrafine Iron Powders, Soviet Powder Metallurgy and Metal Ceramics, 29(2), 165–167, 1990.
Pehkonen, S. O., Siefert, R., Erel, Y., Webb, S., and Hoffmann, M. R.: Photoreduction Of Iron
15
Oxyhydroxides In The Presence Of Important Atmospheric Organic-Compounds, Environ. Sci. Technol., 27(10), 2056–2062, 1993.
Sheesley, R. J., Schauer, J. J., Hemming, J. D., Geis, S., and Barman, M. A.: Seasonal and spatial relationship of chemistry and toxicity in atmospheric particulate matter using aquatic bioassays, Environ. Sci. Technol., 39(4), 999–1010, 2005.
20
Singh, M., Jaques, P. A., and Sioutas, C.: Size distribution and diurnal characteristics of particle-bound metals in source and receptor sites of the Los Angeles Basin, Atmos. En-viron., 36(10), 1675–1689, 2002.
Singh, M., Misra, C., and Sioutas, C.: Field evaluation of a personal cascade impactor sampler (PCIS), Atmos. Environ., 37(34), 4781–4793, 2003.
25
Torok, S., Faigel, G., Jones, K. W., Rivers, M. L., Sutton, S. R., and Bajt, S.: Chemical Char-acterization Of Environmental Particulate Matter Using Synchrotron-Radiation, X-ray Spec-trometry, 23(1), 3–6, 1994.
Valavanidis, A., Salika, A., and Theodoropoulou, A.: Generation of hydroxyl radicals by urban suspended particulate air matter. The role of iron ions, Atmos. Environ., 34(15), 2379–2386,
30
2000.
van Aken, P. A. and Liebscher, B.: Quantification of Ferrous/Ferric Ratios in Minerals: New Eval-uation Schemes of Fe L23 Electron Energy-loss Near-edge Spectra, Physics and Chemistry
ACPD
7, 1357–1390, 2007 Iron speciation in atmospherically processed aerosols B. J. Majestic et al. Title Page Abstract Introduction Conclusions References Tables Figures ◭ ◮ ◭ ◮ Back Close Full Screen / EscPrinter-friendly Version Interactive Discussion
EGU
of Minerals, 29, 188–200, 2002.
van Aken, P. A., Liebscher, B., and Styrsa, V. J.: Quantitative Determination of Iron Oxidation States in Minerals Using Fe L2,3 – edge Electron Energy-loss Near-edge Structure Spec-troscopy, Physics and Chemistry of Minerals, 25, 323–327, 1998.
Zaw, M., Szymczak, R., and Twining, J.: Application of synchrotron radiation technique to
5
analysis of environmental samples, Nucl. Instrum. Methods Phys. Res. B, 190, 856–859, 2002.
Zhu, X., Prospero, J. M., Savoie, D. L., Millero, F. J., Zika, R. G., and Saltzman, E. S.: Photore-duction Of Iron(III) In Marine Mineral Aerosol Solutions, J. Geophys. Res., 98(D5), 9039– 9046, 1993.
10
Zhuang, G. S., Yi, Z., Duce, R. A., and Brown, P. R.: Link Between Iron And Sulfur Cycles Suggested By Detection Of Fe(II) In Remote Marine Aerosols, Nature, 355(6360), 537–539, 1992.
Zuo, Y. G. and Deng, Y. W.: Iron(II)-catalyzed photochemical decomposition of oxalic acid and generation of H2O2 in atmospheric liquid phases, Chemosphere, 35(9), 2051–2058, 1997.
15
Zuo, Y. G. and Hoigne, J.: Photochemical Decomposition Of Oxalic, Glyoxalic And Pyruvic-Acid Catalyzed By Iron In Atmospheric Waters, Atmos. Environ., 28(7), 1231–1239, 1994.
ACPD
7, 1357–1390, 2007 Iron speciation in atmospherically processed aerosols B. J. Majestic et al. Title Page Abstract Introduction Conclusions References Tables Figures ◭ ◮ ◭ ◮ Back Close Full Screen / EscPrinter-friendly Version Interactive Discussion
EGU Table 1. Comparison of total leachable iron to Total Iron and Total Fe(II) with no aging.
Sampling Day Size Fraction Total Iron % Leachable Fe(II) % Leachable Fe(II) % Leachable Fe (ng m−3) of Total Iron of Total Fe(II)∗∗ of Total Iron
St. Louis 30 January 2006 >2.5 µm 107.4 4.1 24.0 4.1 St. Louis 30 January 2006 PM 2.5 68.6 7.1 21.3 7.8 St. Louis 1 February 2006 >2.5 µm 158.5 0.23 0.7 0.33 St. Louis 1 February 2006 PM 2.5 158.9 4.8 8.8 6.1 Los Angeles 13 February 2006 >2.5 µm 417.8 2.1 14.3 2.6 Los Angeles 13 February 2006 PM 2.5 241.0 6.2 16.9 7.4 Los Angeles 14 February 2006 >2.5 µm 41.4 17.0 49.1 22.8 Los Angeles 14 February 2006 PM 2.5 58.2 14.5 38.6 18.6 Waukesha 12 July 2006 >2.5 µm 16.2 17.5 77.8 23.0 Waukesha 12 July 2006 PM 2.5 157.6 4.3 24.5 8.5 Waukesha 13 July 2006 >2.5 µm 212.2 0.54 2.1 1.0 Waukesha 13 July 2006 PM 2.5 228.6 1.4 N / A 3.3
** XANES data is not available for particles <0.25 µm. Therefore, the PM2.5 row signifies
ACPD
7, 1357–1390, 2007 Iron speciation in atmospherically processed aerosols B. J. Majestic et al. Title Page Abstract Introduction Conclusions References Tables Figures ◭ ◮ ◭ ◮ Back Close Full Screen / EscPrinter-friendly Version Interactive Discussion
EGU Table 2. Time (in days) for soluble Fe(II) to reach a maximum value in both Waukesha samples.
Oxidation times are the time it takes for the soluble iron values to come back to equilibrium (from time t = 0). Note that Fe(II) peaks are observed only in the sub-micron fractions.
Size Fraction Time to Reach Time for Fe(II) to Oxidize Maximum Fe(II) Content
>2.5 µm No Significant Peak Not Significant 2.5–1.0µm No Significant Peak Not Significant
1.0–0.5µm 3 days 6 days
0.5–0.25µm 3 days 6 days
ACPD
7, 1357–1390, 2007 Iron speciation in atmospherically processed aerosols B. J. Majestic et al. Title Page Abstract Introduction Conclusions References Tables Figures ◭ ◮ ◭ ◮ Back Close Full Screen / EscPrinter-friendly Version Interactive Discussion EGU ! " !#$ % & ! '( ) ' # ' * !!
Fig. 1. Sample XANES spectra for a standard [70 % Fe(II)/30% Fe(III)] and an ambient
atmo-spheric sample. Note that the LIIportion of the sample spectrum is relatively flat and buried in noise.
ACPD
7, 1357–1390, 2007 Iron speciation in atmospherically processed aerosols B. J. Majestic et al. Title Page Abstract Introduction Conclusions References Tables Figures ◭ ◮ ◭ ◮ Back Close Full Screen / EscPrinter-friendly Version Interactive Discussion EGU
!
" "# " "# " "# $"Fig. 2. The relative peak heights for the Fe(II) and Fe(III) peaks on the LIIIedge for varying Fe(II) content were prepared and analyzed by XANES spectroscopy as a function of Fe(II) fraction. The curve fit shown is a 2nd power polynomial.
ACPD
7, 1357–1390, 2007 Iron speciation in atmospherically processed aerosols B. J. Majestic et al. Title Page Abstract Introduction Conclusions References Tables Figures ◭ ◮ ◭ ◮ Back Close Full Screen / EscPrinter-friendly Version Interactive Discussion EGU ! " # " $ % # " $ & ' ( ) $ % * + , - $ % * + , - $
Fig. 3. Size-resolved total iron concentrations in six samples collected in East St. Louis, Los
Angeles, and Waukesha, WI as measured by inductively coupled plasma – mass spectroscopy (ICPMS). The hatched portion indicates that this size fraction was only speciated by the wet-chemical method, and not by XANES spectroscopy.
ACPD
7, 1357–1390, 2007 Iron speciation in atmospherically processed aerosols B. J. Majestic et al. Title Page Abstract Introduction Conclusions References Tables Figures ◭ ◮ ◭ ◮ Back Close Full Screen / EscPrinter-friendly Version Interactive Discussion EGU ! " # $ % &!' ! ! &!' ! ! &!' ( % # ! )! * +! , - * +! ,
-Fig. 4. Size-resolved plots of crustal elements and sulfur for the Los Angeles, East St. Louis,
ACPD
7, 1357–1390, 2007 Iron speciation in atmospherically processed aerosols B. J. Majestic et al. Title Page Abstract Introduction Conclusions References Tables Figures ◭ ◮ ◭ ◮ Back Close Full Screen / EscPrinter-friendly Version Interactive Discussion EGU !" # # # $ " #" %#& ' # # %#& ' # # %#& ( " ) # *# + ,# ! - + ,# !
-Fig. 5. Size-resolved plots of other metals as source indicators for the Los Angeles, East
ACPD
7, 1357–1390, 2007 Iron speciation in atmospherically processed aerosols B. J. Majestic et al. Title Page Abstract Introduction Conclusions References Tables Figures ◭ ◮ ◭ ◮ Back Close Full Screen / EscPrinter-friendly Version Interactive Discussion EGU ! "" ! """ # $ % & ' ( # ) * ( # ) + , - . ) + , - . )
Fig. 6. Initial size-resolved total Fe(II) (solid) and Fe(III) (hatched) concentrations in PM10
samples collected in East St. Louis and Los Angeles. Fe(II)/Fe(III) ratios were measured by x-ray absorption near edge structure (XANES) spectroscopy.
ACPD
7, 1357–1390, 2007 Iron speciation in atmospherically processed aerosols B. J. Majestic et al. Title Page Abstract Introduction Conclusions References Tables Figures ◭ ◮ ◭ ◮ Back Close Full Screen / EscPrinter-friendly Version Interactive Discussion EGU ! " # $ " % & ' % (( ' % (((
Fig. 7. Total Fe(II) (solid) and Fe(III) (hatched) size-resolved concentrations (measured by
XANES) for the 30 January 2006 sample from East St. Louis. This series of graphs shows how each size fraction changes over the course of the 40 day aging period.
ACPD
7, 1357–1390, 2007 Iron speciation in atmospherically processed aerosols B. J. Majestic et al. Title Page Abstract Introduction Conclusions References Tables Figures ◭ ◮ ◭ ◮ Back Close Full Screen / EscPrinter-friendly Version Interactive Discussion EGU
!" # $
!%
%$
&
Fig. 8. Total Fe(II) air concentrations for all four East St. Louis and Los Angeles samples aged
ACPD
7, 1357–1390, 2007 Iron speciation in atmospherically processed aerosols B. J. Majestic et al. Title Page Abstract Introduction Conclusions References Tables Figures ◭ ◮ ◭ ◮ Back Close Full Screen / EscPrinter-friendly Version Interactive Discussion EGU ! " # $ % & ' ( ) * + " % & '
Fig. 9. Initial size-resolved soluble Fe(II) (solid) and Fe(III) (hatched) concentrations in PM10
samples collected in East St. Louis, Los Angeles, and Waukesha, WI. Soluble Fe(II) and Fe(III) were measured using the Ferrozine method followed by addition of hydroxylamine hydrochlo-ride.
ACPD
7, 1357–1390, 2007 Iron speciation in atmospherically processed aerosols B. J. Majestic et al. Title Page Abstract Introduction Conclusions References Tables Figures ◭ ◮ ◭ ◮ Back Close Full Screen / EscPrinter-friendly Version Interactive Discussion EGU ! " # $$ # $$$ ! " % &'() #(* ! " ! "
Fig. 10. Soluble Fe(II) (solid) and Fe(III) (hatched) size-resolved concentrations (measured by
the Ferrozine method) for the 13 July 2006 sample from Waukesha, WI. This series of graphs shows how each size fraction changes over the course of the 10 day aging period.
ACPD
7, 1357–1390, 2007 Iron speciation in atmospherically processed aerosols B. J. Majestic et al. Title Page Abstract Introduction Conclusions References Tables Figures ◭ ◮ ◭ ◮ Back Close Full Screen / EscPrinter-friendly Version Interactive Discussion EGU
!
!"
"
#
$ % "
Fig. 11. Soluble Fe(II) air concentrations for all St. Louis and Los Angeles samples aged over
ACPD
7, 1357–1390, 2007 Iron speciation in atmospherically processed aerosols B. J. Majestic et al. Title Page Abstract Introduction Conclusions References Tables Figures ◭ ◮ ◭ ◮ Back Close Full Screen / EscPrinter-friendly Version Interactive Discussion EGU ! ! "
# $
%$
& !
Fig. 12. Soluble Fe(II) air concentrations for all Waukesha, WI samples aged over 10 days as
![Fig. 1. Sample XANES spectra for a standard [70 % Fe(II)/30% Fe(III)] and an ambient atmo- atmo-spheric sample](https://thumb-eu.123doks.com/thumbv2/123doknet/14776880.594276/24.918.192.520.100.500/fig-sample-xanes-spectra-standard-ambient-spheric-sample.webp)