HAL Id: hal-00297199
https://hal.archives-ouvertes.fr/hal-00297199
Submitted on 14 Feb 2007
HAL is a multi-disciplinary open access
archive for the deposit and dissemination of
sci-entific research documents, whether they are
pub-lished or not. The documents may come from
teaching and research institutions in France or
abroad, or from public or private research centers.
L’archive ouverte pluridisciplinaire HAL, est
destinée au dépôt et à la diffusion de documents
scientifiques de niveau recherche, publiés ou non,
émanant des établissements d’enseignement et de
recherche français ou étrangers, des laboratoires
publics ou privés.
processor from MIPAS/ENVISAT measurements
D. Y. Wang, M. Höpfner, G. Mengistu Tsidu, G. P. Stiller, T. von Clarmann,
H. Fischer, T. Blumenstock, N. Glatthor, U. Grabowski, F. Hase, et al.
To cite this version:
D. Y. Wang, M. Höpfner, G. Mengistu Tsidu, G. P. Stiller, T. von Clarmann, et al.. Validation of
nitric acid retrieved by the IMK-IAA processor from MIPAS/ENVISAT measurements. Atmospheric
Chemistry and Physics, European Geosciences Union, 2007, 7 (3), pp.721-738. �hal-00297199�
www.atmos-chem-phys.net/7/721/2007/ © Author(s) 2007. This work is licensed under a Creative Commons License.
Chemistry
and Physics
Validation of nitric acid retrieved by the IMK-IAA processor from
MIPAS/ENVISAT measurements
D. Y. Wang1,2, M. H¨opfner1, G. Mengistu Tsidu1,3, G. P. Stiller1, T. von Clarmann1, H. Fischer1, T. Blumenstock1, N. Glatthor1, U. Grabowski1, F. Hase1, S. Kellmann1, A. Linden1, M. Milz1, H. Oelhaf1, M. Schneider1, T. Steck1, G. Wetzel1, M. L´opez-Puertas4, B. Funke4, M. E. Koukouli4,5, H. Nakajima6, T. Sugita6, H. Irie7, J. Urban8,
D. Murtagh8, M. L. Santee9, G. Toon9, M. R. Gunson9, F. W. Irion9, C. D. Boone10, K. Walker10, and P. F. Bernath10 1Forschungszentrum Karlsruhe und Univ. Karlsruhe, Institut f¨ur Meteorologie und Klimaforschung, Karlsruhe, Germany 2Physics Department, University of New Brunswick, Fredericton, New Brunswick, Canada
3Department of Physics, Addis Ababa University, Addis Ababa, Ethiopia 4Instituto de Astrof´ısica de Andaluc´ıa, CSIC, Granada, Spain
5Physics Department, Aristotle University of Thessaloniki, Thessaloniki, Greece 6National Institute for Environmental Studies, Tsukuba, Japan
7Frontier Research Center for Global Change, Japan Agency for Marine-Earth Science and Technology, Kanagawa, Japan 8Chalmers Uni. of Technology, Department of Radio and Space Science, G¨oteborg, Sweden
9Jet Propulsion Laboratory, California Institute of Technology, Pasadena, California, USA 10Department of Chemistry, University of Waterloo, Waterloo, Ontario, Canada
Received: 26 June 2006 – Published in Atmos. Chem. Phys. Discuss.: 5 October 2006 Revised: 8 January 2007 – Accepted: 12 February 2007 – Published: 14 February 2007
Abstract. The Michelson Interferometer for Passive
Atmo-spheric Sounding (MIPAS) onboard the ENVISAT satellite provides profiles of temperature and various trace-gases from limb-viewing mid-infrared emission measurements. The stratospheric nitric acid (HNO3) from September 2002 to
March 2004 was retrieved from the MIPAS observations us-ing the science-oriented data processor developed at the In-stitut f¨ur Meteorologie und Klimaforschung (IMK), which is complemented by the component of non-local thermody-namic equilibrium (non-LTE) treatment from the Instituto de Astrof´ısica de Andaluc´ıa (IAA). The IMK-IAA research product, different from the ESA operational product, is vali-dated in this paper by comparison with a number of reference data sets. Individual HNO3 profiles of the IMK-IAA
MI-PAS show good agreement with those of the balloon-borne version of MIPAS (MIPAS-B) and the infrared spectrometer MkIV, with small differences of less than 0.5 ppbv through-out the entire altitude range up to abthrough-out 38 km, and below 0.2 ppbv above 30 km. However, the degree of consistency is largely affected by their temporal and spatial coincidence, and differences of 1 to 2 ppbv may be observed between 22 and 26 km at high latitudes near the vortex boundary, due to large horizontal inhomogeneity of HNO3. Statistical
com-parisons of MIPAS IMK-IAA HNO3 VMRs with respect Correspondence to: D. Y. Wang
to those of satellite measurements of Odin/SMR, ILAS-II, ACE-FTS, as well as the MIPAS ESA product show good consistency. The mean differences are generally±0.5 ppbv
and standard deviations of the differences are of 0.5 to 1.5 ppbv. The maximum differences are 2.0 ppbv around 20 to 25 km. This gives confidence in the general reliability of MIPAS HNO3 VMR data and the other three satellite data
sets.
1 Introduction
Nitric acid (HNO3) is formed in the atmosphere either by
gas phase reaction (Austin et al., 1986) and ion cluster re-actions (B¨ohringer et al., 1983) or, less probable in the higher stratosphere, by heterogeneous reactions on sulphate aerosols (de Zafra et al., 2001). It is a key component in the photochemistry of stratospheric ozone destruction through its role in the formation of Type I Polar stratospheric Clouds (PSCs) and as a main reservoir for the reactive nitrogen oxides (World Meteorological Organization, 2003). The HNO3climatology was observed by the Atmospheric Trace
Molecule Spectroscopy (ATMOS) EXPERIMENT in a se-ries of space shuttle missions during 1985 to 1994 (Gunson et al., 1996 and Abrams et al., 1996). The global distribu-tions of HNO3concentration have been measured from
satel-lite observations, such as the Limb Infrared Monitor of the Stratosphere (LIMS) instrument, mounted on the Nimbus-7 satellite (Gille and Russell, 1984), the Cryogenic Limb ar-ray etalon spectrometer (CLAES) (Kumer et al., 1996) and the Microwave Limb Sounder (MLS) onboard the Upper At-mosphere Research Satellite (UARS) (Santee et al., 1999 and Santee et al., 2004) and on Aura (Santee et al., 2005), the Im-proved Limb Atmospheric Spectrometer (ILAS) onboard the Advanced Earth Observing Satellite (ADEOS) (Koike et al., 2000 and Irie et al., 2002) and ILAS-II on ADEOS-II (Irie et al., 2006), and the Sub-Millimetre Radiometer (SMR) on Odin (Murtagh et al., 2002 and Urban et al., 2005); as well as the high-resolution Fourier transform spectrometer (FTS) on SCISAT-1, also known as Atmospheric Chemistry Exper-iment (ACE) (Bernath et al., 2005).
Recent measurements of HNO3 volume mixing ratios
(VMRs) in the troposphere and stratosphere are also pro-vided by the Michelson Interferometer for Passive Atmo-spheric Sounding (MIPAS) (Fischer et al., 1996 and Euro-pean Space Agency, 2000) onboard the ENVISAT satellite. The instrument is a high resolution Fourier transform spec-trometer and measures vertical profiles of temperature and various gas species by limb-observing mid-infrared emis-sions. Complementary to the ESA operational data prod-ucts (Raspollini et al., 2006 and Carli et al., 2004), there are six different off-line data processors at five institutions for science-oriented data analysis of the high resolution limb viewing infrared spectra (von Clarmann et al., 2003a).
The MIPAS data processor developed at Institut f¨ur Me-teorologie und Klimaforschung (IMK) and complemented by the component of non-local thermodynamic equilibrium (non-LTE) treatment from the Instituto de Astrof´ısica de An-daluc´ıa (IAA) provides simultaneous retrieval of temperature and line-of-sight parameters from measured spectra and the spacecraft ephemerides, prior to constituent retrievals (von Clarmann et al., 2003b). This scheme is different from that of the ESA operational data processor, in which the point-ing data are based on the satellite’s orbit and attitude con-trol system which uses star tracker information as a refer-ence (called engineering data hrefer-enceforth). The temperature and observation geometry derived from IMK-IAA processor are validated against a number of satellite observations and assimilation analyses and show good consistency with the other data sets (Wang et al., 2005). These derived quantities are used to retrieve profiles of HNO3and other species. This
ensures accuracy and self-consistence of the IMK-IAA data product, and is essential for retrievals of gas species, since mid-infrared emission spectra are strongly sensitive to tem-perature, and as limb observations are strongly affected by the observation geometry.
Details about the retrieval strategies and error budget for the IMK-IAA HNO3 data have been reported by Mengistu
Tsidu et al. (2005) and Stiller et al. (2005). As a preliminary step towards the HNO3 data validation, they compared the
IMK-IAA profiles with other observational data, including
climatological data sets from the MLS instrument on UARS and field campaign data obtained from balloon-borne Fourier transform infrared (FTIR) spectrometers. The IMK-IAA MI-PAS HNO3 values are in general agreement with the
refer-ence data sets. In contrast to these older data versions of the IMK-IAA MIPAS HNO3 product which were strongly
regularized and suffer from some lack of information at the highest and lowest altitudes, the retrieval set-up for the data version presented here (V3O HNO3 7/8) was adjusted to the improvements gained with re-processing of level-1b data (IPF version 4.61/62). In particular, reduced radiance gain oscillations allowed relaxation of the regularization applied which increased the number of degrees of freedom of the pro-files and allowed the retrieval of information on HNO3in the
upper stratosphere and upper troposphere, too.
This study focuses on the validation of the IMK-IAA HNO3data and, in particular, on the comparisons with other
coincident satellite observations for cross check. The pro-files of the retrieved MIPAS nitric acid are compared with 1) Field campaign data obtained from the balloon-borne ver-sion of MIPAS (MIPAS-B, hereafter) and infrared spectrom-eter MkIV; 2) Other satellite observations, such as from the SMR instrument on Odin, from ILAS-II on ADEOS-II, as well as from FTS on ACE; and 3) The MIPAS ESA opera-tional products. The characteristics of the IMK-IAA MIPAS data and other reference data sets are outlined in Sects. 2.1 and 3, while our comparison method is described in Sect. 4. The comparison results are presented in Sects. 5 and 6. Our conclusions are contained in Sect. 7.
2 The MIPAS data
The MIPAS IMK-IAA data set and the ESA operational products used for this study are described as follows. 2.1 The IMK-IAA MIPAS data
Data to be validated here are the vertical profiles of abun-dances of HNO3measured during the period from
Septem-ber 2002 to March 2004. The data sets are retrieved with the scientific IMK-IAA data processor from the MIPAS spectra, with temporal sampling of one full day per ten days for rou-tine monitoring, or at the specific time and geo-locations of the reference data for validation, or during continuous peri-ods of several days for the examination of special events (for example, the split of the Antarctic vortex in 2002).
The MIPAS observations provide global coverage with 14.4 orbits per day. The standard observation mode cov-ers nominal tangent altitudes in a scanning sequence from the top 68 km down to 60, 52, and 47 km, and between 42 and 6 km at a step width of ∼3 km. The altitude resolu-tion, defined as the full width at half maximum of a col-umn of the averaging kernel matrix, is around 3 km at 35 km level, decreasing to 6 and 8 km at lower (25 km) and higher
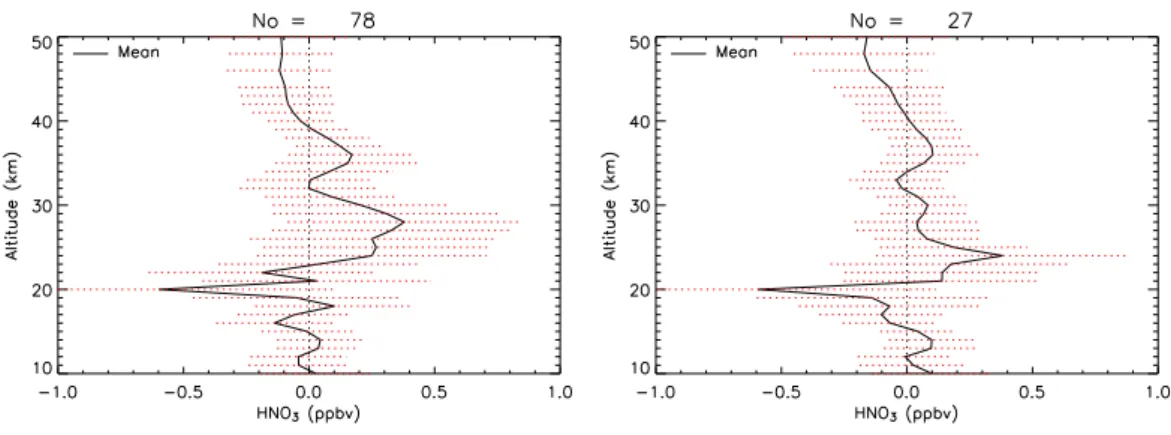
Fig. 1. Differences of the HNO3volume mixing ratios (in ppbv) retrieved by the IMK-IAA data processor from the ESA operational L1B
data version IPF/V4.61 with respect to the retrievals from IPF/V4.55 (left) and IPF/V4.59 (right). N is the total number of profiles used for the comparison.
(45 km) altitudes, respectively. The horizontal sampling in-terval is∼500 km along-track and ∼2800 km across-track at the equator. Spectra severely contaminated by clouds are re-jected from the analysis (see Spang et al., 2004, for details of the cloud-clearing technique. However, cloud indices were taken as 4.0.). The number of available measurements for each day varies from several tens to hundreds, and the alti-tude coverage also slightly changes from profile to profile.
The IMK-IAA nitric acid profiles are derived from in-frared emissions based on the operational ESA level-1B data (i.e. calibrated and geo-located radiance spectra). Version IPF V4.61/4.62 of ESA-generated calibrated radiance spec-tra was used for the IMK-IAA retrievals presented here (ver-sion V3O HNO3 7/8). Figure 1 presents comparisons of the HNO3 volume mixing ratios retrieved from the ESA
L1B data version V4.61 with respect to the retrievals from V4.55 and V4.59, representing older IMK-IAA data versions (V1 HNO3 1 to V2 HNO3 6). The differences are generally less than 0.1 to 0.2 ppbv, though larger differences of about 0.5 ppbv are seen at 20 and 26 km.
The IMK-IAA MIPAS HNO3 was retrieved sequentially
after temperature and line-of sight, water vapour, and ozone using optimized spectral regions with respect to the total retrieval error (von Clarmann and Echle, 1998) in its ν5
and 2ν9 bands. The retrieval is performed between 6 and
70 km on a fixed 1-km grid below 44 km and 2-km above. Not all selected spectral regions are used for all observation geometries in order to optimize computation time and minimize systematic errors. Therefore, height dependent combinations of microwindows (so-called occupation ma-trices) are selected with a trade-off between computation time and total retrieval error (see Mengistu Tsidu et al., 2005, Table 1). The MIPAS spectroscopic database version PF3.1 (Flaud et al., 2003) is used for our retrieval. The HITRAN2004 line data for the 11.3 µm region are the ones from the MIPAS spectroscopy data set (Flaud et al., 2003).
The HNO3 integrated band intensity in the range of 820 to
950 cm−1 is 2.266×10⁻¹⁷cm−1/(molecule cm−2) from the MIPAS database, and 2.267×10⁻¹⁷cm−1/(molecule cm−2) in the HITRAN2004 (Rothman et al., 2005), but scaled by a factor of 0.884 with respect to 2.564×10⁻¹⁷cm−1/(molecule cm−2) given by the HI-TRAN2000 database (Rothman et al., 2003). This led to an average 13% increase in HNO3VMR presented in this paper
in comparison with those retrieved with the HITRAN2000 spectroscopic database.
Dedicated error analysis and data characterization was per-formed for typical nighttime measurements inside the polar vortex and midlatitudes on 26 September 2002 (see Mengistu Tsidu et al., 2005, Tables 2 and 3) and for a typical 2003 Antarctic mid-winter profile (11 July 2003, 86.4◦S latitude, 115.5◦E longitude) (Stiller et al., 2005). The retrieval er-ror due to measurement noise and uncertain parameters in the radiative transfer forward model have been estimated by linear error analysis. The total systematic error of the con-stituent species includes the uncertainties from all interfering gases which are not jointly retrieved with the constituent gas and uncertainties from temperature, line of sight, instrumen-tal line shape, spectral shift, calibration uncertainty, forward modelling and spectroscopic errors. The precision in terms of the quadratic sum of all random error components between 25 and 45 km is between 2 and 6%, while the estimated ac-curacy, derived by quadratically adding the systematic error due to spectroscopic uncertainty to the random error budget, is between 5 and 15%. Below 32 km, measurement noise is the dominating error source, while above, residual elevation pointing uncertainty is the leading error component. 2.2 The ESA operational MIPAS data
For cross check, the IMK-IAA MIPAS HNO3 profiles are
compared with the operational data retrieved by ESA using the operational retrieval algorithm as described by Ridolfi et
-5 0 5 -5 0 5 35 40 45 35 40 45 MIPAS-B: 24 September 2002 05 37 21 69 08 32 0 5 10 VMR [ppb] 10 15 20 25 30 35 40 Altitude [km] -5 0 5 ∆VMR [ppb] 10 15 20 25 30 35 40 MB24Sep22:25 MI24Sep22:07 MB24Sep22:25 MI24Sep22:07 -5 0 5 -5 0 5 35 40 45 35 40 45 08 38 23 69 08 32 69 08 32 0 5 10 VMR [ppb] 10 15 20 25 30 35 40 -5 0 5 ∆VMR [ppb] 10 15 20 25 30 35 40 MB24Sep21:45 MI24Sep22:05 MI24Sep22:06 MB24Sep21:45 MI24Sep22:05 MI24Sep22:06
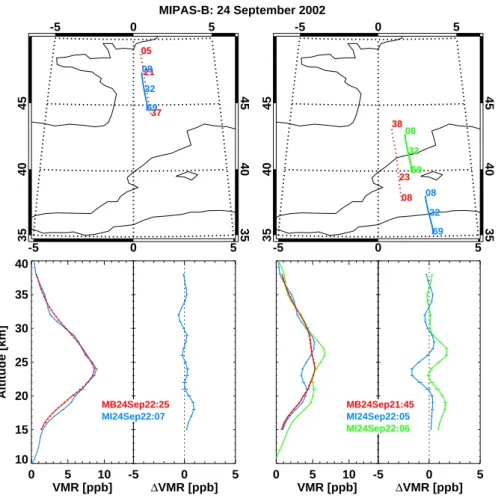
Fig. 2. Comparison of HNO3volume mixing ratio (in ppbv) profiles observed by MIPAS-B (red) and MIPAS/ENVISAT (other colors) on
24 September 2002. The top panels show the balloon flight and satellite tangent point tracks for the MIPAS-B northern (left) and southern (right) measured sequences. The numbers indicate the altitudes (in kilometers) of selected tangent points. All measurements were located outside the polar vortex, and thus the contour lines of potential vorticity are not shown. The bottom panels show the profiles (the first and third column from the left) and their differences (the second and fourth column). The red dotted lines are the original MIPAS-B results while the red solid lines show the MIPAS-B profiles after convolution with the MIPAS/ENVISAT averaging kernel. The differences shown in the second and fourth column are calculated using the red solid profiles. Error bars for MIPAS-B represent the total 1-σ uncertainty while for MIPAS/ENVISAT only the noise error is given.
al. (2000), Carli et al. (2004), and Raspollini et al. (2006). The operational HNO3 profiles are retrieved based on the
most recent re-processed L1B data version 4.61, with a ver-tical resolution of∼3 km and with the altitudes registered
by the engineering measurements. The ESA version 4.61 HNO3data have successfully been validated against
balloon-borne, aircraft and ground-based measurements (Oelhaf et al., 2004), though the reported validation cases have been confined to the re-analyzed operational MIPAS data almost only for the year 2002 and so far to mid-latitudes only. Gen-erally, the MIPAS HNO3 operational profiles as processed
with v4.61 are in good agreement with airborne observations in all cases with a good coincidence in time and space be-tween the MIPAS observations and the correlative measure-ments, with negative deviations from correlative field cam-paign data of less than 0.5 ppbv between 30 and 4 hPa, and
positive deviations of less than 1 ppbv at lower altitudes. The ESA MIPAS HNO3profiles are also validated by comparison
with the measurements from the far Infrared Balloon Exper-iment (IBEX) (Mencaraglia et al., 2006), and an agreement
of±5% is obtained in the altitudes between 15 and 70 hPa.
3 The reference data sets
The correlative data sets used for comparison with the IMK-IAA MIPAS nitric acid profiles are described as follows. 3.1 Balloon-borne MIPAS-B and MkIV measurements Balloon-borne observations are a very useful tool to obtain distributions of HNO3 with sufficiently high vertical
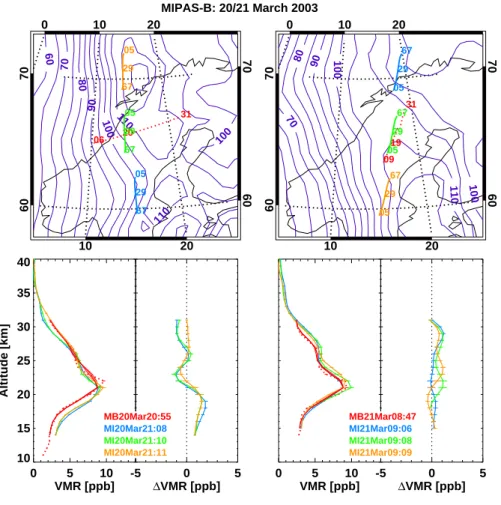
10 20 0 10 20 60 70 60 70 MIPAS-B: 20/21 March 2003 60 70 80 90 100 100 110 110 06 31 20 67 05 29 67 05 29 67 05 29 0 5 10 VMR [ppb] 10 15 20 25 30 35 40 Altitude [km] -5 0 5 ∆VMR [ppb] 10 15 20 25 30 35 40 MB20Mar20:55 MI20Mar21:08 MI20Mar21:10 MI20Mar21:11 MB20Mar20:55 MI20Mar21:08 MI20Mar21:10 MI20Mar21:11 10 20 0 10 20 60 70 60 70 70 80 90 100 100 110 09 31 19 67 05 29 67 05 29 67 05 29 0 5 10 VMR [ppb] 10 15 20 25 30 35 40 -5 0 5 ∆VMR [ppb] 10 15 20 25 30 35 40 MB21Mar08:47 MI21Mar09:06 MI21Mar09:08 MI21Mar09:09 MB21Mar08:47 MI21Mar09:06 MI21Mar09:08 MI21Mar09:09
Fig. 3. Same as Fig. 2, but for two MIPAS-B sequences measured on 20/21 March 2003. Overlaid violet contour lines are potential vorticity
(in 10−6K m2kg−1s−1) at 550 K potential temperature.
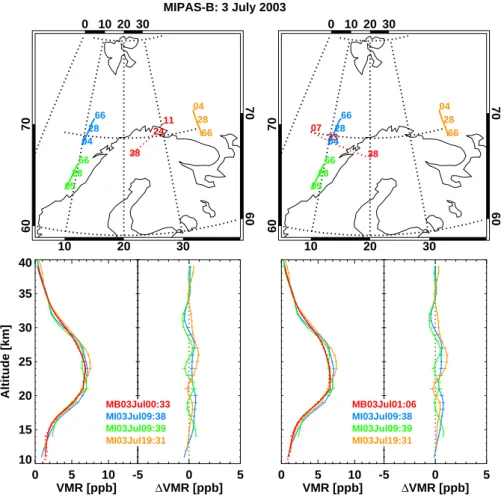
validation campaigns were carried out with the MIPAS-B, the balloon-borne version of MIPAS (Friedl-Vallon et al., 2004). They were conducted on 24 September 2002, 20/21 March 2003, and 3 July 2003. As shown in Fig. 2, the two September MIPAS-B profiles were obtained from sequences measured near 40◦N and 46◦N. The MIPAS/ENVISAT co-incident measurement for the sequence near 46◦N covered nearly the same latitudes and longitudes along track of the flight while the sequence near 40◦N is slightly different from the location of the MIPAS/ENVISAT observation. The two March 2003 measurements (Fig. 3) were taken in the late winter Arctic vortex near 66◦N, 15◦E over Kiruna (67.8◦N, 20.4◦E), Sweden and covered a wide range of longitudes (greater than 10◦). The two sequences measured during the July flight (Fig. 4) were performed under polar summer con-ditions near 70◦N around 10◦E and 25◦E with a longitudinal coverage of 10◦to 15◦respectively.
Three other balloon campaigns were made with the Jet Propulsion Laboratory (JPL) MkIV instrument (Toon, 1991). It is a Fourier transform spectrometer and measures high signal-to-noise ratio solar occultation spectra throughout the
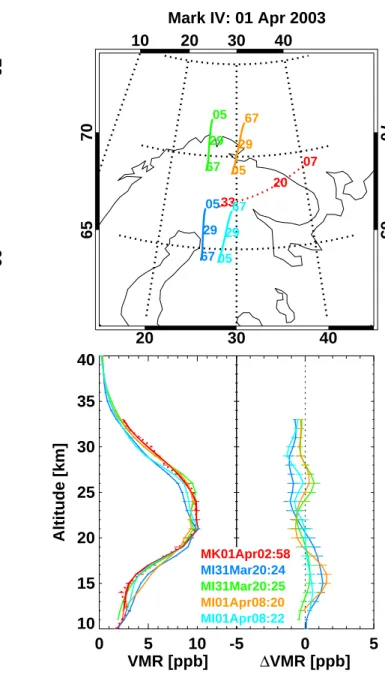
mid-infrared region (650 to 5650 cm−1) at high spectral resolution (0.01 cm−1) at sunrise or sunset. Two sunrise MkIV measurements (Figs. 5 and 6) were taken over Es-range located 45 km from the town of Kiruna in 16 December 2002 and 1 April 2003 during SOLVE2/VINTERSOL cam-paigns (http://mark4sun.jpl.nasa.gov/solve2a.html and http: //mark4sun.jpl.nasa.gov/solve2b.html). The December mea-surement has a wide latitude coverage while the April one extends over a wide longitude range. They have 3 and 4 co-incident MIPAS/ENVISAT HNO3profiles, respectively. The
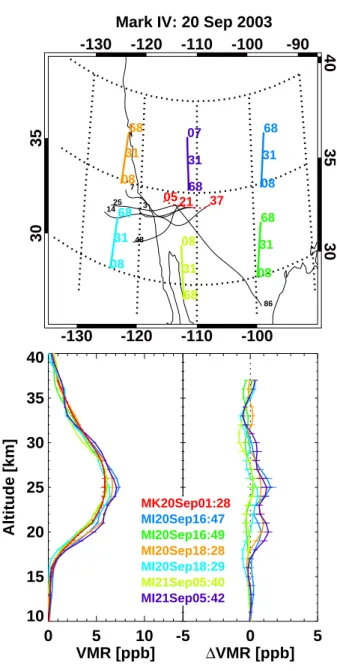
third sunrise MkIV measurement (Fig. 7) was conducted in 20 September 2003 at a mid-latitude of 35◦N with a wide longitude range. There are 6 coincident MIPAS/ENVISAT HNO3profiles available for this MkIV flight.
3.2 Other satellite measurements
The Sub-Millimetre Radiometer (SMR) on board the Odin satellite, launched on 20 February 2001, observes key species with respect to stratospheric chemistry and dynamics such as O3, ClO, N2O, and HNO3 using two bands centered at
10 20 30 0 10 20 30 60 70 60 70 MIPAS-B: 3 July 2003 11 38 24 66 04 28 66 05 28 66 04 28 0 5 10 VMR [ppb] 10 15 20 25 30 35 40 Altitude [km] -5 0 5 ∆VMR [ppb] 10 15 20 25 30 35 40 MB03Jul00:33 MI03Jul09:38 MI03Jul09:39 MI03Jul19:31 MB03Jul00:33 MI03Jul09:38 MI03Jul09:39 MI03Jul19:31 10 20 30 0 10 20 30 60 70 60 70 07 38 23 66 04 28 66 05 28 66 04 28 0 5 10 VMR [ppb] 10 15 20 25 30 35 40 -5 0 5 ∆VMR [ppb] 10 15 20 25 30 35 40 MB03Jul01:06 MI03Jul09:38 MI03Jul09:39 MI03Jul19:31 MB03Jul01:06 MI03Jul09:38 MI03Jul09:39 MI03Jul19:31
Fig. 4. Same as Fig. 2, but for two MIPAS-B sequences measured on 3 July 2003.
performed typically twice per week.Vertical profiles are re-trieved from the spectral measurements of a limb scan by two similar data processors in Sweden and in France. The data used in this comparison study are taken from the level 2 op-erational data retrieved at the Chalmers University of Tech-nology (Gothenburg, Sweden). The most recent version is the version 2.0, and HNO3is retrieved from the 544.6 GHz
band. The spectroscopic line intensities are taken from the JPL spectral line compilation. These intensities are corrected to correspond to a total partition function (not only the ro-tational partition function provided by the JPL database). Comparisons are under way in order to check differences be-tween the JPL and HITRAN (TIPS) partition functions. The profiles in the altitude range from 18 to 45 km are retrieved with a vertical resolution of 1.5 to 2 km and a 1-σ precision of better than 1.5 ppbv. Detailed information on the data char-acteristics and analysis of systematic retrieval errors, result-ing from spectroscopic and instrumental uncertainties can be found in (Urban et al., 2005) and (Urban et al., 2006).
The ILAS-II instrument is a solar occultation sensor de-signed to measure various stratospheric constituents. The op-erational observations were made with a frequency of about
14 times per day in each hemisphere for about 7 months from 2 April through 24 October 2003. The measurement latitudes ranged from 54◦ to 71◦N and from 65◦to 88◦S, varying seasonally. Vertical profiles of HNO3 and several
key stratospheric species (O3, NO2, N2O, CH4, H2O etc.)
are simultaneously retrieved by the so-called onion-peeling method, primarily using the strong absorption lines around 7.6 and 11.3 µm for the HNO3retrieval, with vertical
reso-lutions of 1.3 to 2.9 km at tangent heights of 15 and 55 km (see Yokota et al., 2002, for details of the retrieval algorithm cloud-clearing technique.). For the version 1.4 ILAS-II algo-rithm, spectroscopic data were adopted from the year 2000 edition of the HITRAN database, including updates through the end of 2001 (Rothman et al., 2003). The influence of the different version of HITRAN database (2000 versus 2004) on ILAS-II HNO3retrievals is very small, according to a
sensi-tivity test made for a couple of specific cases. The ILAS-II stratospheric HNO3profiles (version 1.4) were validated
with balloon-borne instruments and climatological compar-isons, showing that the precision is better than 13–14%, 5%, and 1% at 15, 20, and 25 km, respectively, and that the ac-curacy in the altitude region is estimated to be better than
10
20
30
40
0
10
20 30 40
60
60
70
Mark IV: 16 Dec 2002
60 70 70 80 90 100 100 100 100 110 110 120 12 30 21 68 06 30 68 06 30 68 06 30
0
5
10
VMR [ppb]
10
15
20
25
30
35
40
Altitude [km]
-5
0
5
∆
VMR [ppb]
10 15 20 25 30 35 40 MK16Dec08:10 MI15Dec09:24 MI15Dec09:25 MI16Dec18:43 MK16Dec08:10 MI15Dec09:24 MI15Dec09:25 MI16Dec18:43Fig. 5. Comparison of HNO3volume mixing ratio (in ppbv)
pro-files observed by MkIV (red) and MIPAS/ENVISAT (other colors) on 16 December 2002 . The top panel shows the balloon flight and satellite tangent point tracks. The numbers indicate the altitudes (in kilometers) of selected tangent points. The bottom panel shows the profiles (left) and their differences (right). The red dotted lines are the original MkIV results while the red solid lines show the MkIV profiles after convolution with the MIPAS/ENVISAT averaging ker-nel. The differences shown in the second column are calculated using the red solid profiles. Error bars for MKIV represent the to-tal 1-σ uncertainty while for MIPAS/ENVIST only the noise error is given. Overlaid violet contour lines are potential vorticity (in 10−6K m2kg−1s−1) at 550 K potential temperature.
−13% to +26% (Irie et al., 2006 and Yamamori et al., 2006).
The ACE-FTS (Bernath et al., 2005) is a high resolution
20
30
40
10
20
30
40
65
70
65
70
Mark IV: 01 Apr 2003
07 33 20 67 05 29 67 05 29 67 05 29 67 05 29
0
5
10
VMR [ppb]
10
15
20
25
30
35
40
Altitude [km]
-5
0
5
∆
VMR [ppb]
10 15 20 25 30 35 40 MK01Apr02:58 MI31Mar20:24 MI31Mar20:25 MI01Apr08:20 MI01Apr08:22 MK01Apr02:58 MI31Mar20:24 MI31Mar20:25 MI01Apr08:20 MI01Apr08:22Fig. 6. Same as Fig. 5, but for MkIV flight on 1 April 2003. All
measurements were located outside the polar vortex, and thus the contour lines of potential vorticity are not shown.
(0.02 cm−1) Fourier transform spectrometer operating from 2 to 13 µm (750 to 4500 cm−1). The ACE-FTS records at-mospheric absorption spectra during sunrise and sunset (so-lar occultation mode) and has a nominal vertical resolution of about 4 km. The ACE satellite was launched on 12 August 2003 and the first useful atmospheric spectra were recorded in early February 2004. The ACE-FTS retrieval algorithm is based on a global fit procedure that first derives temper-ature and pressure profiles using CO2absorption (Boone et
al., 2005). The nitric acid is based primarily on microwin-dows near 1710 cm−1containing ν2absorption. In the
tro--130 -120 -110 -100 -130 -120 -110 -100 -90 30 35 30 35 40
Mark IV: 20 Sep 2003
86 48 25 14 7 3 0521 37 68 08 31 68 08 31 68 08 31 68 08 31 68 08 31 68 07 31 0 5 10 VMR [ppb] 10 15 20 25 30 35 40 Altitude [km] -5 0 5 ∆VMR [ppb] 10 15 20 25 30 35 40 MK20Sep01:28 MI20Sep16:47 MI20Sep16:49 MI20Sep18:28 MI20Sep18:29 MI21Sep05:40 MI21Sep05:42 MK20Sep01:28 MI20Sep16:47 MI20Sep16:49 MI20Sep18:28 MI20Sep18:29 MI21Sep05:40 MI21Sep05:42
Fig. 7. Same as Fig. 5, but for MkIV flight on 20 September 2003.
All measurements were located outside the polar vortex, and thus the contour lines of potential vorticity are not shown. The black lines are forward trajectories started from the position of the MKIV profile and all MIPAS observations took place afterwards.
posphere additional microwindows near 879 cm−1 (ν5) are
used because of strong water absorption near the ν2 band.
The HNO3line parameters used are those of HITRAN2004
(Rothman et al., 2005). Version 2.2 FTS retrievals taken dur-ing 9 February to 25 March 2004 are used for the compar-isons in this paper. The retrievals are carried out in the 10 to 37 km range with a typical precision of 2 to 3%.
4 Comparison methods
For comparisons between individual profiles, the MIPAS and other data sets are searched for coincident measurements. Due to characteristics of the data sampling scenarios, differ-ent coincidence criteria have to be applied. The spatial and temporal mismatch can cause HNO3 differences associated
with geophysical variations of the atmospheric field. De-tailed discussions will be presented in Sect. 5. When two cor-relative profiles with different vertical resolutions are com-pared, some small structures of the atmospheric field could be resolved by the higher resolution measurement, but not by the lower one. To account for this effect, the altitude resolution should be adjusted using the averaging kernels. The method used is that described by Rodgers and Connor (2003), and its simplified application to our study is outlined below.
If noise is not considered, the retrieved profile xretrievedis
a weighted average of the “true” profile xtrueand the a priori
profile xamipasin the form of
xretrieved= Amipasxtrue+ (I − A)xamipas, (1)
in which Amipasis the averaging kernel matrix and I denotes
the unit matrix. In our comparison, the correlative profiles are interpolated to a common altitude grid, that used by the MIPAS data. The vertical resolution of the correlative pro-files x is adjusted by applying the averaging kernel of the MIPAS Amipas. Also, the correlative profiles, which are
as-sumed to be free of a priori information, are transformed to the a priori xamipasthat is used by the MIPAS data. Both the a priori transformation and smoothing are done by
˜x = Amipasx+ (I − Amipas)xamipas. (2)
Comparing Eq. (2) with Eq. (1), it is clear that ˜x is the re-sult derived with the MIPAS inverse model, if x happens to be the true profile. The difference between the MIPAS mea-surements xmipasand the transformed other data sets˜x is
δ= xmipas− ˜x
= (xmipas− x) + (I − Amipas)(x− xamipas), (3)
where the negative of the last term represents the differ-ences originated from different vertical resolution and a pri-ori. These contribute to the (xmipas−x) difference, but not
to δ. Thus, the residual δ is taken as proxy for the discrep-ancy between the two measurements. This innovative use of the formality of retrieval theory leads to a better comparison between values retrieved from the measurements of MIPAS and other instruments, since the other datasets are smoothed by the weighting functions of the MIPAS remote sensor and the same dependence on the MIPAS a priori are also ensured. For the ith pair of correlative profiles, the individual elements of the difference profile vector δi at each height level z will
comparison between xmipasand x only in cases where
infor-mation from the MIPAS measurement is contained in the re-trieval, i.e. the diagonal values of Amipasare reasonably large,
which is the case in the altitudes covered by MIPAS obser-vations. If the diagonal values of Amipas are small (e.g. at
the lowest or highest altitudes of MIPAS observations), i.e. no altitude-resolved measurement information is contained in the MIPAS retrieval, MIPAS results are controlled by the regularization rather than by the measurement. In this case, small δ values do not imply a meaningful agreement between
xmipasand x.
The residuals δi(z)are assembled in several ways (details
are described in Sect. 5) for statistical analysis. For each ensemble, mean difference profiles 1(z) and their standard deviations σ (z) are calculated; σ (z) allows the precision of MIPAS profiles to be assessed. The statistical uncertainty in the mean difference 1(z) is quantified by σ (z)/N1/2, which represents the uncertainty of 1(z) due to random-type er-rors. In the case of 1(z) larger than the σ (z)/N1/2, their difference is an indicator of systematic errors between the comparison data sets. We also compute the mean difference, standard deviation, and σ/N1/2uncertainty averaged over al-titude. These height-averaged quantities are directly eval-uated according to the statistical definitions by assembling data points available at all height levels.
5 Comparison results
Detailed profile-by-profile comparisons are performed for the available correlative measurements between MIPAS IMK-IAA HNO3VMR and other data sets (see Table 1). For
comparisons of MIPAS with Odin/SMR, ILAS-II, and ACE-FTS the horizontal distances between the collocated profiles are required to be smaller than 5◦ latitude and 10◦ longi-tude, and the time differences are less than 6 h. The mean spatial separations and temporal differences, as well as their standard deviations are averaged over all available correlative measurements and listed in Table 2. The spatial mismatches between the correlative measurements are minimized in the polar regions, but maximized near the equator (not shown here). This is not surprising since the longitude criterion is meaningless at the poles, and thus the spatial coincidence cri-teria include only the±5◦difference in latitude. The spatial and temporal mismatch can cause HNO3 differences
asso-ciated with geophysical variations of the atmospheric field. However, imperfect spatial matches have virtually no effect on the observed mean differences since their effect largely averages out, but significantly contributes to the observed standard deviations.
For a reference data set having enough correlative pro-files, mean differences at individual height levels are also calculated over the overlapped observation period. For inter-satellite comparison, zonal mean differences are calculated with latitude intervals of 30◦and for the MIPAS descending
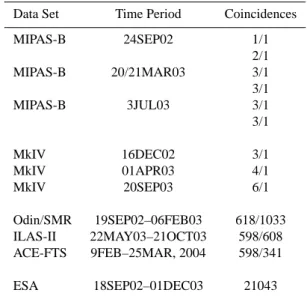
Table 1. Numbers of Correlative Profiles Used for HNO3
Compar-ison: Data from balloon-borne MIPAS-B and MkIV measurements, other satellite observations, and MIPAS ESA operational product. See the text for coincidence criteria. The numbers of available co-incidence profiles are equal for the IMK-IAA and ESA operational retrievals. For other data sets, one MIPAS profile may have multiple coincidences. This is indicated by paired numbers with the first for MIPAS and the second for the correlative measurements.
Data Set Time Period Coincidences MIPAS-B 24SEP02 1/1 2/1 MIPAS-B 20/21MAR03 3/1 3/1 MIPAS-B 3JUL03 3/1 3/1 MkIV 16DEC02 3/1 MkIV 01APR03 4/1 MkIV 20SEP03 6/1 Odin/SMR 19SEP02–06FEB03 618/1033 ILAS-II 22MAY03–21OCT03 598/608 ACE-FTS 9FEB–25MAR, 2004 598/341 ESA 18SEP02–01DEC03 21043
Table 2. Mean Spatial and Temporal Separations and Standard
De-viations. Data are averaged over all available correlative measure-ments (see Table 1). Horizontal distance in kilometers, latitude and longitude in degrees, and time in minutes. (Note: Both daytime and nighttime MIPAS measurements are used for comparison with ACE-FTS data.)
Odin/SMR ILAS-II ACE-FTS Distance 513±271 347±174 280±151
Latitude 0.1±2.9 0.19±2.9 1.5±1.9 Longitude 0.5±6.1 −1.5±5.6 11.3±43.3*
Time 140±194 −25±439 426±504*
(daytime) and ascending (nighttime) orbit nodes separately. The results from both nodes are generally similar and thus only daytime results are presented. The global means are av-eraged over all latitudes and both orbit nodes.
5.1 Comparison with MIPAS-B measurements
Figures 2 to 4 show comparisons of HNO3 VMR
pro-files between the MIPAS/ENVISAT IMK-IAA retrieval and balloon-borne MIPAS-B measurements on 24 September 2002, 20/21 March 2003, and 3 July 2003, together with the satellite and balloon flight tracks.
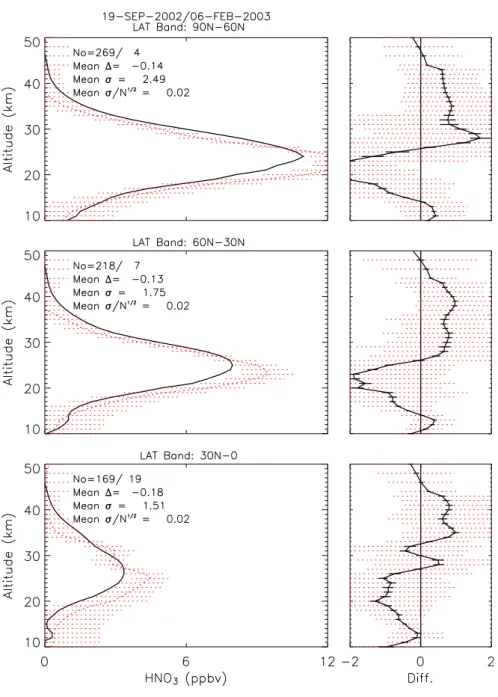
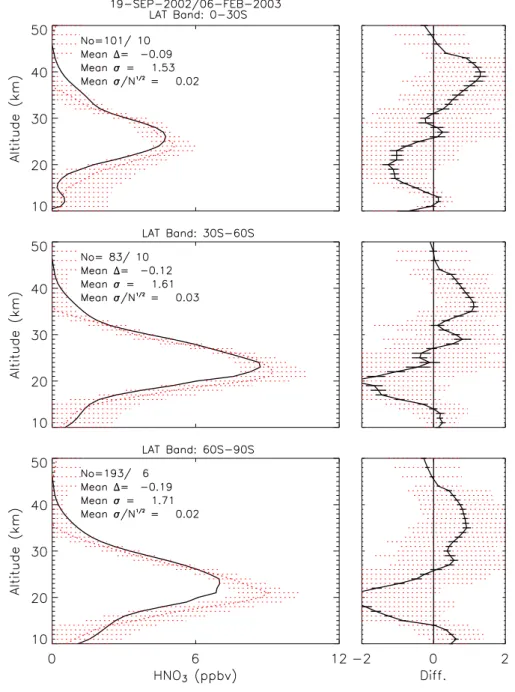
Fig. 8. Comparison of the IMK-IAA retrieved MIPAS (black solid) and Odin/SMR (red dotted) HNO3volume mixing ratio (in ppbv)
profiles in the northern hemisphere during a period of 6 days from September 19 2002 to February 6, 2003. The zonal mean profiles (left) are derived from the available coincident Odin/SMR and MIPAS measurements, which are located within a latitude interval of 30◦. The Odin/SMR data are convolved with the MIPAS averaging kernel. At the altitudes below 20 km and above 40 km, the Odin/SMR HNO3data
are generally dominated by the a priori climatology. The MIPAS minus Odin/SMR residuals and their standard deviations (in ppbv) are shown in right panels. The maximum and minimum number of profiles available at individual heights are specified. Also denoted are the mean difference 1, standard deviations σ , and the uncertainty σ /√N averaged over all heights, where N is total number of available data points.
The agreement between IMK-IAA MIPAS and MIPAS-B HNO3 profiles derived from the September radiance
mea-surements at 40◦N and 46◦N is very good (Fig. 2). Dur-ing the northern sequence at 46◦N the collocation was bet-ter than 20 min in time and betbet-ter than 100 km in
horizon-tal distance. The comparison between MIPAS-B (north-ern sequence) and MIPAS/ENVISAT reveals an excellent agreement with only slightly larger values of the MIPAS IMK-IAA data between 15 and 22 km. The deviations are below 0.5 ppbv throughout the entire altitude range up to
Fig. 9. Same as Fig. 8, but for the southern hemisphere.
about 38 km, and below 0.2 ppbv above 30 km. During the southern sequence at 40◦N, the spatial mismatch between the MIPAS-B and MIPAS/ENVISAT measurements became slightly larger, and the difference of the measured HNO3
VMR slightly increased, with a maximum of ∼1.5 ppbv around the HNO3peak at 26 km. This difference is attributed
to less perfect coincidence. Nevertheless, above 30 km no substantial difference between MIPAS and MIPAS-B HNO3
profiles was found.
The HNO3profiles derived from the March flight at 66◦N
have shown larger differences of 1 to 2 ppbv between 17 and 22 km (Fig. 3). The discrepancies in the March
measure-ments are attributed to horizontal inhomogeneities within a wide range of longitudes (larger than 10◦) covered by MIPAS-B. Moreover, the March measurements were made near the vortex boundary (see violet contours in Fig. 3) where the variation of NOyspecies is highly pronounced due to
dif-ferences in chemical processes on either side of the vortex edge. As shown by Mengistu Tsidu et al. (2005) the disagree-ments, which are more pronounced for HNO3than N2O5, is
mainly caused by the horizontal inhomogeneity since HNO3
exhibits a stronger latitudinal gradient than N2O5,
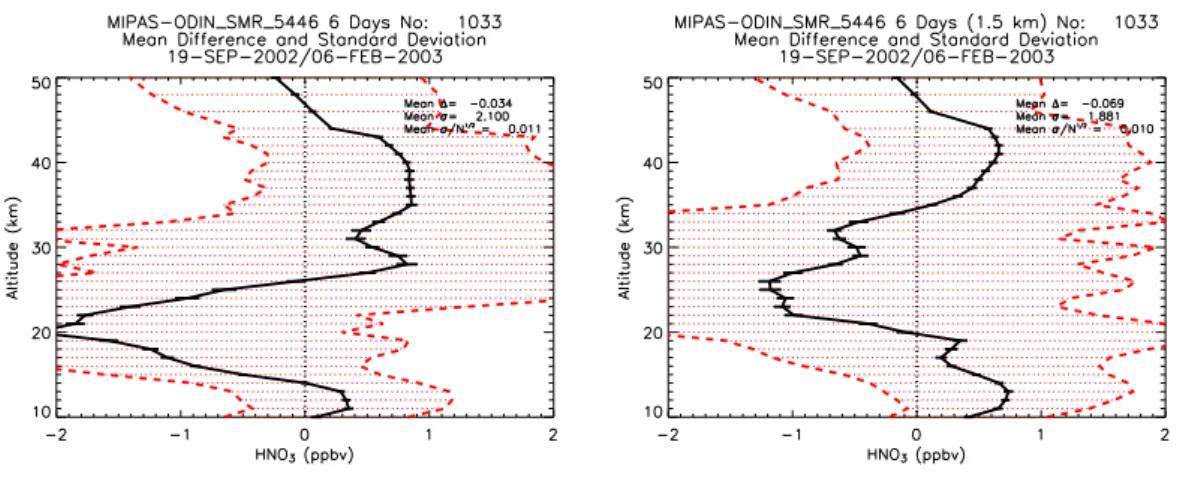
Fig. 10. Global mean differences between the IMK-IAA retrieved MIPAS and Odin/SMR HNO3volume mixing ratios (in ppbv). The
MIPAS minus Odin/SMR residuals (left) are calculated from the available coincident measurements. The Odin/SMR data are convoluted with the MIPAS averaging kernel. On the right panel, the altitudes of the Odin/SMR data are shifted up by 1.5 km to achieve better agreement. The total number of profiles are specified in the titles. Also denoted are the global mean difference 1, standard deviations σ , and the uncertainty σ /√Naveraged over all heights, where N is total number of available data points.
In contrast, the HNO3 profiles from the IMK-IAA
MI-PAS and MIMI-PAS-B measurements near 70◦N in July 2003 show better agreement, even the MIPAS-B July flight cov-ered nearly the same wide longitude range, in comparison with the March observations (Fig. 4). The deviations are less than 1 ppbv throughout the entire altitude range between 10 and 40 km, and below 0.5 ppbv at the lower and higher alti-tudes. This reflects much smaller horizontal variations of the HNO3distributions during polar summer.
5.2 Comparison with MkIV measurements
Figures 5 and 6 compare two sunrise MkIV measurements taken at high northern latitudes over Esrange during 2002 winter and 2003 spring with respect to their 3 and 4 coinci-dent MIPAS/ENVISAT IMK-IAA profiles, respectively. The local time differences are small for these correlative profiles. Thus, their solar zenith angle differences are not adjusted.
The comparison of the December measurements (Fig. 5) shows substantial differences since the MkIV measurements were taken near the vortex edge and HNO3 is sensitive to
both latitudinal and longitudinal differences in this region. The two MIPAS measurements centered near 65◦N, more closely matching the latitude of the MkIV measurement, ex-hibit better agreement than the profile which is completely within the vortex (centered near 70◦N).
In contrast, MIPAS and MkIV April HNO3measurements
(Fig. 6) are in reasonable agreement due to homogeneous air-masses, though there was the same level of spatial mismatch. The highest deviations in HNO3 VMR were found below
17 km, with Mark-IV being 1.5 ppbv lower than IMK-IAA retrieved MIPAS HNO3VMR. In the primary HNO3VMR
maximum around 23 km and above, deviations were around 0.5 ppbv.
The sunrise MkIV measurement at 35◦N in September 2003 (Fig. 7) also show generally good agreement with its 6 coincident MIPAS/ENVISAT HNO3profiles. The
differ-ences are less than 1 ppbv throughout the entire altitude range between 10 and 40 km, and below 0.3 ppbv at the lower and higher ends. This is due to more homogeneous airmasses at the autumn mid-latitude, though there was spatial mis-match of about 10◦ longitude between the coincident pro-files. The forward trajectories started at the positions of the MkIV profile indicate that the turquoise MIPAS/ENVISAT profile measured on 18:29 UTC should agree best with the MkIV profile, as it represents the same air masses, which is the case indeed.
5.3 Comparison with Odin/SMR observations
Figures 8 and 9 show the comparisons between the IMK-IAA retrieved MIPAS and Odin/SMR HNO3VMR profiles,
which are zonally averaged for 6 latitude bands during a pe-riod of 6 days in September 2002 and February 2003. The comparisons are conducted in altitude coordinates. In the height regions below 20 km and above 40 km, the Odin/SMR HNO3data usually have a measurement response (a ratio
de-rived from the Odin/AMR averaging kernel matrix and pro-viding a measure on how much information comes from the spectral measurement and the a priori profile for each in-dividual retrieval altitude level) lower than 0.75, implying dominance of the a priori climatology. In other height re-gions where the measurement response is larger than 0.75, the comparison results are consistent with preliminary results obtained from the Odin/SMR validation study based on com-parisons of Odin/SMR with a couple of balloons and with satellite data (ILAS-II, MIPAS ESA operational data) (Ur-ban et al., 2006). Odin/SMR version-1.2 HNO3has a
pos-Fig. 11. Comparison of the IMK-IAA retrieved MIPAS (black solid) and ILAS-II (red dotted) HNO3volume mixing ratio (in ppbv) profiles
at latitudes of 60◦N–90◦N, 30◦N–60◦N, and 60◦S–90◦S during 22 May to 21 October 2003. The zonal mean profiles are derived from the available coincident measurements. The ILAS-II data are convoluted with the MIPAS averaging kernel. Three columns in each row show the zonal mean profiles (left) absolute (middle) and relative (right) differences of the MIPAS and ILAS-II HNO3VMR. The maximum and
minimum number of profiles available at individual heights are specified. Also denoted are the mean difference 1, standard deviations σ , and the uncertainty σ /√Naveraged over all heights, where N is total number of available data points.
itive bias up to∼2 ppbv (not shown here). Other data
ver-sions, such as version 2.0 used in this analysis, agree bet-ter with the correlative data. The large differences of −2
and+1 ppbv are only seen around 20 km and 35 km at high
latitudes of 60◦. The characteristic shape of the difference profile likely indicates an altitude shift between MIPAS and SMR data. The best value of the mean altitude increase for
Odin/SMR, which minimizes the HNO3VMRs differences
is estimated to be approximately 1.5 km. A similar feature is also observed when the comparison is conducted in pres-sure coordinates (not shown). The global mean differences are shown in Fig. 10, where the right panel shows the mean differences reduced by 0.5 to 1 ppbv after increasing the al-titude of the ODIN/SMR profiles by 1.5 km. However, the
Fig. 12. Global mean differences between the IMK-IAA retrieved
MIPAS and ILAS-II HNO3volume mixing ratio (in ppbv),
aver-aged over the available coincident measurements during 22 May to 21 October 2003. See Fig. 11 for more details.
altitude-adjusted Odin/SMR data still have the same char-acteristic shape of the difference profile in comparison with MIPAS. Comparison of Odin/SMR v2.0 HNO3to Aura/MLS
HNO3found a shift of the order of 2 km. The HNO3peak
value is larger in the SMR data than in the MIPAS data, what indicates that the altitude shift is not the only reason for the disagreement, and other error sources (spectroscopy, calibra-tion) may also contribute.
5.4 Comparison with ILAS-II observations
Figure 11 shows comparisons between the IMK-IAA re-trieved MIPAS and ILAS-II measured HNO3VMR profiles,
which are zonally averaged over three latitude bands for the 11 days between 2 May to 21 October 2003. Figure 12 shows the global mean difference profiles averaged over the three latitude bands. The ILAS-II data were convoluted by the MIPAS averaging kernel. Therefore, the ILAS-II mixing ra-tios are somewhat degraded from the original vertical reso-lutions. Also, the ILAS-II data were filtered by requiring the retrieved VMR values greater than the total error values. This rejected some data points above about 35 km, in particular, in the southern high latitude region. Vertical trends in the differ-ence between MIPAS and ILAS-II are different for the two hemispheres as seen from Fig. 11. The consistency between the MIPAS and ILAS-II data is very impressive, with the 11-day mean differences being less than±0.7 ppbv and the stan-dard deviations less than±1 ppbv, in spite of the somewhat large spatial coincidence criteria (5◦in latitude) used.
On a first instance, the good consistency between ILAS-II and MIPAS is surprising, since different spectroscopic data (HITRAN2000 for ILAS-II and HITRAN2004 for MIPAS)
are used in the retrievals. A positive high bias in the order of 13% should be expected for the MIPAS retrievals, since the HNO311.3 µm band intensity in HITRAN2004 is about 13%
smaller than in HITRAN2000. In fact, Wetzel et al. (2006) showed that ILAS-II is about 14% higher than MIPAS-B re-trievals if the latter are performed using HITRAN2000, the same utilized in ILAS-II. (For clarity, we recall that HI-TRAN2004 was used for the MIPAS-B retrievals shown in Figs. 2 to 4). A possible explanation is that ILAS-II HNO3
retrieval uses not only the 11.3 µm band, but also that in the 7.6 µm region. If the ILAS-II retrieval put more weight on the 7.6 µm band and the intensity of this band is more con-sistent with the more recent data in the 11.3 µm region, that could compensate for the high bias in the 11.3 µm band in-tensity in HITRAN2000, as shown in Fig. 3 of (Rothman et al., 2005), and could explain the results.
5.5 Comparison with ACE-FTS observations
Figure 13 shows comparisons between the zonal mean pro-files of the IMK-IAA MIPAS and ACE-FTS HNO3 VMR
taken during 9 February to 25 March 2004 at latitude bands of 30◦N–60◦N and 60◦N–90◦N. The ACE-FTS data are from the sunset measurements, while the MIPAS data in-clude both daytime and nighttime measurements. The con-sistency between the MIPAS and ACE-FTS data is very good. The mean differences are less than±0.1 to 0.7 ppbv and rms deviations of ∼0.4 to 1 ppbv, with the small val-ues corresponding to the lower and higher altitudes around 10 and 35 km. The relative differences are 5 to 10% below 30 km, and 10 to 15% at higher altitudes around 35 km. We have also compared the ACE-FTS sunset data with the day-time and nightday-time MIPAS measurements separately, and no significant differences are found. For latitude bands of 30◦S– 0◦ and 0◦–30◦N, only 1 and 4 events are available respec-tively. Thus these comparison results are not presented here.
6 Comparison with ESA operational data
Figure 14 shows the differences between the MIPAS HNO3
VMR profiles retrieved by the IMK-IAA science-oriented and ESA operational processors for 42 days between September 2002 and December 2003. To avoid the influ-ence of the error in the ESA MIPAS altitude registration (von Clarmann et al., 2003b and Wang et al., 2005), the compar-isons are conducted in pressure coordinates. The MIPAS ESA and IMK-IAA HNO3generally show good consistency.
The global mean differences between 200 and 1 hPa are less than 0.3 ppbv with a standard deviation of∼0.5 ppbv. The global means have a high bias (IMK-IAA being higher than ESA) of 0.1 ppbv between 30 and 2 hPa, and a low bias of less than 0.3 ppbv at lower altitudes. Large negative bias of 0.6 ppbv is observed at 1 hPa around 30◦S and 60◦S. The characteristic shape of the difference profile indicates an
al-Latitude band: 30 - 60 0 2 4 6 8 10 vmr (ppb) 10 15 20 25 30 35 Altitude (km) ACE ACExAK MIPAS n ACE = 27 n MIP = 46 -1.0 -0.5 0.0 0.5 1.0 MIPAS-ACE (ppb) 10 15 20 25 30 35 -20 -10 0 10 20 (MIPAS-ACE)/ACE (%) 10 15 20 25 30 35 Latitude band: 60 - 90 0 2 4 6 8 10 vmr (ppb) 10 15 20 25 30 35 Altitude (km) ACE ACExAK MIPAS n ACE = 329 n MIP = 613 -1.0 -0.5 0.0 0.5 1.0 MIPAS-ACE (ppb) 10 15 20 25 30 35 -20 -10 0 10 20 (MIPAS-ACE)/ACE (%) 10 15 20 25 30 35
Fig. 13. Comparison of the IMK-IAA retrieved MIPAS (red) and ACE-FTS HNO3volume mixing ratio (in ppbv) profiles at latitudes of
30◦N–60◦N and 60◦N–90◦N during 9 February to 25 March 2004. Three columns in each row show the zonal mean profiles (left) with or without the MIPAS averaging kernel applied, absolute (middle) and relative (right) differences of the IMK-IAA MIPAS and ACE-FTS HNO3
VMR. The total number of profiles is specified. Also shown in the middle panels are the standard deviations (black) of the mean differences and the 1-σ uncertainty (green). The relative differences are calculated with respect to the ACE profiles without the MIPAS averaging kernel applied.
titude shift between the ESA and IMK-IAA retrievals. That obviously does not only depend on pressure and altitude rep-resentations, but reflects a small systematic effect.
7 Conclusions
Stratospheric nitric acid VMR profiles are retrieved from MI-PAS observations using the IMK-IAA data processor. The profiles obtained between September 2002 and March 2004 are compared with several reference data sets.
Fig. 14. Differences between the MIPAS HNO3volume mixing ratios (in ppbv) retrieved by the IMK-IAA scientific and ESA operational
data processors. The IMK-IAA minus ESA residuals are calculated from the available measurements. The zonal mean differences (right panel) are derived with a latitude interval of 30◦for the MIPAS descending (daytime) orbit node. The contour intervals are 0.2 ppbv. On the left panel, the global means (solid) and standard deviations (dotted) are computed for each day (thin line) and for all days (thick line) of the observations. The total number of profiles are specified in the titles. Also denoted are the global mean difference 1, standard deviations σ , and the uncertainty σ /√Naveraged over all heights, where N is total number of available data points.
Most of the comparisons show that the IMK-IAA MI-PAS HNO3 product is in great shape. In particular, the al-titude range where reliable information is retrieved seems to be larger in comparison to the ESA HNO3 product de-scribed by Mencaraglia et al. (2006). The comparison be-tween individual profiles of the IMK-IAA retrieved MIPAS and MIPAS-B HNO3 shows good agreement, but their
de-gree of consistency is largely affected by their temporal and spatial coincidence (Figs. 2 to 4). In the case of a collo-cation better than 20 min in time and 100 km in horizon-tal distance (northern sequence in September 2002), the two data sets showed an excellent agreement, with differences be-low 0.5 ppbv throughout the entire altitude range up to about 38 km, and below 0.2 ppbv above 30 km. For the 2003 March measurements differences of 1 to 2 ppbv between 22 and 26 km were observed. One of the MIPAS-B profiles covered a wide range of longitudes larger than 10◦ at high latitudes near the vortex boundary where HNO3 is sensitive to both
latitudinal and longitudinal differences in this region. Thus, the high differences are thought to be related to horizontal inhomogeneity. In contrast, HNO3profiles measured in July
2003 are in good agreement although the mismatch of both sensors was quite large. This reflects the smaller horizontal variations of HNO3in polar summer.
Similar features are also observed for comparisons be-tween individual profiles of the MkIV and MIPAS/ENVISAT (Figs. 5 to 7). In spite of the same level of spatial mismatch, the April 2003 measurements showed reasonable agreements due to more homogeneous airmasses, but substantial differ-ences were observed for the December 2002 measurements taken near the vortex edge revealing large horizontal inho-mogeneity, in particular for those profiles which are com-pletely inside and outside vortex. In the primary HNO3VMR
maximum around 23 km and above, deviations were around 0.5 ppbv. The highest deviations in HNO3VMR were found
below 17 km, with the MkIV being 1.5 ppbv lower than the MIPAS data.
Statistical comparison results of MIPAS IMK-IAA HNO3
VMR with respect to those of the Odin/SMR, ILAS-II, ACE-FTS measurements, as well as the MIPAS ESA prod-uct (Figs. 8 to 14) show generally good agreement. The IMK-IAA MIPAS and Odin/SMR V2.0 HNO3VMR profiles
taken during September 2002 showed reasonable agreement (Fig. 8) with largest differences of−2 and +1 ppbv only seen
around 20 km and 35 km at high latitudes of 60◦. The differ-ences are due to an altitude displacement within the Odin data. Note that an improved Odin/SMR HNO3 product is
underway at the time of writing this article. Much better agreements are observed for the mean HNO3VMR profiles
of the IMK-IAA MIPAS, with respect to ILAS-II and ACE-FTS measurements (Figs. 11, 12, and 13). The mean differ-ences of the MIPAS IMK-IAA data with respect to the ILAS-II and ACE-FTS data are less than±0.7 ppbv. The MIPAS IMK-IAA and ESA HNO3generally show good consistency
above 30 hPa (Fig. 14). The global means of IMK-IAA re-trievals show a high bias of 0.1 ppbv between 30 and 2 hPa, and a low bias of less than 0.3 ppbv at lower altitudes. Large negative bias is observed at 1 hPa around 30◦S and 60◦S. Acknowledgements. The research work of the IMK MIPAS
group has been funded via the German Research Foundation (DFG) priority program CAWSES and the EC project SCOUT-O3 (contract no. 505390-GOCE-CT-2004). The IAA team was partially supported by Spanish projects REN2001-3249/CLI and ESP2004-01556. Odin is a Swedish led satellite project funded jointly by Sweden (SNSB), Canada (CSA), Finland (TEKES) and France (CNES). The ACE mission is supported by the Canadian
Space Agency and the Natural Sciences and Engineering Research Council of Canada. B. Funke and M. E. Koukouli have been sup-ported through an European Community Marie Curie Fellowship. Edited by: P. Espy
References
Abrams, M. C., Chang, A. Y., Gunson, M. R., Abbas, M. M., Gold-man, A., Irion, F. W., Michelsen, H. A., Newchurch, M. J., Rins-land, C. P., Stiller, G. P., and Zander, R.: On the assessment and uncertainty of atmospheric trace gas burden measurements with high resolution infrared solar occultation spectra from space by the ATMOS experiment, Geophys. Res. Lett., 23(17), 2337– 2340, doi:10.1029/96GL01794, 1996.
Austin, J., Garcia, R. R., Russell III, J. M., Solomon, S., and Tuck A. F.: On the atmospheric photochemistry of nitric acid, J. Geo-phys. Res., 91(D5), 5477–5485, 1986.
Bernath, P. F., McElroy, C. T., Abrams, M. C., et al.: Atmospheric Chemistry Experiment (ACE): Mission Overview, Geophys. Res. Lett., 32, L15S01, doi:10.1029/2005GL022386, 2005.
Boone, C. D., Nassar, R., Walker, K. A., Rochon, Y., McLeod, S. D., Rinsland, C. P., and Bernath, P. F.: Retrievals for the at-mospheric chemistry experiment Fouriertransform spectrometer, Appl. Opt., 44(33), 7218–7231, 2005.
B¨ohringer, H., Fahey, D. W., Fehsenfeld, F. C., and Ferguson, E. E.: The role of ion–molecule reactions in the conversion of N2O5
to HNO3in the stratosphere, Planet. Space. Sci., 31, 185–191,
1983.
Carli, B., Alpaslan, D., Carlotti, M., et al.: First results of MI-PAS/ENVISAT with operational Level 2 code, Adv. Space Res., 33, 1012–1019, 2004.
de Zafra, R. L. and Smyshlyaev, S. P.: On the formation of HNO3 in the Antarctic mid to upper stratosphere in winter, J. Geophys. Res., 106(D19), 23 115–23 126, doi:10.1029/2000JD000314, 2001.
ESA, Envisat: MIPAS, An instrument for atmospheric chemistry and climate research, ESA SP-1229, European Space Agency, Noordwijk, The Netherlands, 2000.
Flaud, J.-M., Piccolo, C., Carli, B., Perrin, A., Coudert, L. H., Teffo, J.-L., and Brown, L. R. : Molecular line parameters for the MI-PAS (Michelson Interferometer for Passive Atmospheric Sound-ing) experiment, Atmos. Oceanic Opt., 16, 172–182, 2003. Fischer, H. and Oelhaf, H.: Remote sensing of vertical profiles of
atmospheric trace constituents with MIPAS limb emission spec-trometers, Appl. Opt., 35(16), 2787–2796, 1996.
Friedl-Vallon, F., Maucher, G., Kleinert, A., Lengel, A., Keim, C., Oelhaf, H., Fischer, H., Seefeldner, M., and Trieschmann, O.: Design and characterization of the balloon-borne Michelson Interferometer for Passive Atmospheric Sounding (MIPAS-B2), Appl. Opt., 43, 3335–3355, 2004.
Gille, J. C. and Russell, J. M.: The Limb Infrared Monitor of the Stratosphere: Experiment Description, Performance, and Re-sults, J. Geophys. Res., 89, 5125–5140, 1984.
Gunson, M. R., Abbas, M. M., Abrams, M. C., Allen, M., Brown, L. R., Brown, T. L., Chang, A. Y., Goldman, A., Irion, F. W., Lowes, L. L., Mahieu, E., Manney, G. L., Michelsen, H. A., Newchurch, M. J., Rinsland, C. P., Salawitch, R. J., Stiller, G. P., Toon, G. C., Yung, Y. L., and Zander, R.: The Atmospheric Trace Molecule
Spectroscopy (ATMOS) experiment: Deployment on the ATLAS Space Shuttle missions, Geophys. Res. Lett., 23(17), 2333–2336, doi:10.1029/96GL01569, 1996.
Irie, H., Kondo, Y., Koike, M., et al.: Validation of NO2and HNO3
measurements from the Improved Limb Atmospheric Spectrom-eter (ILAS) with the version 5.20 retrieval algorithm, J. Geophys. Res., 107(D24), 8206, doi:10.1029/2001JD001304,2002. Irie, H., Sugita, T., Nakajima, H., et al.: Validation of
strato-spheric nitric acid profiles observed by Improved Limb Atmo-spheric Spectrometer (ILAS)-II, J. Geophys. Res., 111, D11S03, doi:10.1029/2005JD006115, 2006.
Irion, F. W., Gunson, M. R., Toon, G. C., et al.: Atmospheric Trace Molecule Spectroscopy (ATMOS) Experiment Version 3 data re-trievals, Appl. Opt., 41(33), 6968–6979, 2002.
Koike, M., Kondo, Y., Irie, H., et al.: A comparison of Arctic HNO3
profiles measured by the Improved Limb Atmospheric Spec-trometer and balloon-borne sensors, J. Geophys. Res., 105(D5), 6761–6771, 2000.
Kumer, J. B., Mergenthaler, J. L., Roche, A. E., Nightingale, R. W., Ely, G. A., Uplinger, W. G., Gille, J. C., Massie, S. T., Bai-ley, P. L., Gunson, M. R., Abrams, M. C., Toon, G. C., Sen, B., Blavier, J., Stachnik, R. A., Webster, C. R., May, R. D., Mur-cray, D. G., MurMur-cray, F. J., Goldman, A., Traub, W. A., Jucks, K. W., and Johnson, D. G.: Comparison of correlative data with HNO3version 7 from the CLAES instrument deployed on the
NASA Upper Atmosphere Research Satellite, J. Geophys. Res., 101(D6), 9621–9656, doi:10.1029/95JD03759, 1996.
Mencaraglia, F., Bianchini, G., Boscaleri, A., Carli, B., Ceccherini, S., Raspollini, P., Perrin, A., and Flaud, J.-M.: Validation of MIPAS satellite measurements of HNO3 using comparison of rotational and vibrational spectroscopy, J. Geophys. Res., 111, D19305, doi:10.1029/2005JD006099, 2006.
Mengistu Tsidu, G., Stiller, G. P., von Clarmann, T., Funke, B., H¨opfner, M., Fischer, H., Glatthor, N., Grabowski, U., Kell-mann, S., Kiefer, M., Linden, A., L´opez-Puertas, M., Milz, M., Steck, T., and Wang, D.-Y.: NOy from Michelson
Inter-ferometer for Passive Atmospheric Sounding on environmen-tal satellite during the southern hemisphere polar vortex split in September/October 2002, J. Geophys. Res., 110(D11), D11301, doi:10.1029/2004JD005322, 2005.
Murtagh, D. P., Frisk, U., Merino, F., et al.: An overview of the Odin atmospheric mission, Can. J. Phy., 80(4), 309–319, 2002. Oelhaf, H., Blumenstock, T., de Mazi`ere, M., Mikuteit, S.,
Vigouroux, C., Wood, S., Bianchini, G., Baumann, R., Blom, C., Cortesi, U., Liu, G. Y., Schlager, H., Camy-Peyret, C., Catoire, V., Pirre, M., Strong, K., and Wetzel, G.: Validation of MIPAS-ENVISAT Version 4.61 HNO3operational data by stratospheric
ballon, aircraft and ground–based measurements, in: Proceed-ings of the Second Workshop on the Atmospheric Chemistry Val-idation of ENVISAT (ACVE-2), 3–7 May 2004, ESA-ESRIN, Frascati, Italy, edited by: Danesy, D., vol. ESA SP–562, CD-ROM, ESA Publications Division, ESTEC, Postbus 299, 2200 AG Noordwijk, The Netherlands, August 2004.
Raspollini, P., Belotti, C., Burgess, A., et al.: MIPAS level 2 opera-tional analysis, Atmos. Chem. Phys., 6, 5605–5630, 2006, http://www.atmos-chem-phys.net/6/5605/2006/.
Rodgers, C. D. and Connor, B. J.: Intercomparison of re-mote sounding instruments, J. Geophys. Res., 108(D3), 4116, doi:10.1029/2002JD002299, 2003.
Ridolfi, M., Carli, B., Carlotti, M., von Clarmann, T., Dinelli, B., Dudhia, A., Flaud, J.-M., H¨opfner, M., Morris, P. E., Raspollini, P., Stiller, G., and Wells, R. J. : Optimized forward and retrieval scheme for MIPAS near-real-time data processing, Appl. Opt., 39(8), 1323–1340, 2000.
Rothman, L. S., Jacquemart, D., Barbe, A., et al.: The HITRAN 2004 molecular spectroscopic database, J. Quant. Spectrosc. Ra-diat. Transfer, 96, 139–204, 2005.
Rothman, L. S., Barbe, A., Benner, D. C., et al.: The HITRAN molecular spectroscopic database: edition of 2000 including up-dates through 2001, J. Quant. Spectrosc. Radiat. Transfer, 82, 5–44, 2003.
Santee, M. L., Manney, G. L., Froidevaux, L., Read, W. G., and Waters, J. W.: Six years of UARS Microwave Limb Sounder HNO3observations: Seasonal, 23 interhemispheric, and
inter-annual variations in the lower stratosphere, J. Geophys. Res., 104(D7), 8225–8246, 1999.
Santee, M. L., Manney, G. L., Livesey, N. J., and Read, W. G.: Three-dimensional structure and evolution of stratospheric HNO3 based on UARS Microwave Limb
Sounder measurements, J. Geophys. Res., 109, D15306, doi:10.1029/2004JD004578, 2004.
Santee, M. L., Manney, G. L., Livesey, N. J., Froidevaux, L., MacKenzie, I. A., Pumphrey, H. C., Read, W. G., Schwartz, M. J., Waters, J. W., and Harwood, R. S.: Polar processing and development of the 2004 Antarctic ozone hole: First re-sults from MLS on Aura, Geophys. Res. Lett., 32, L12817, doi:10.1029/2005GL022582, 2005.
Spang, R., Remedios, J. J., and Barkley, M. P.: Colour indices for the detection and differentiation of cloud types in infra-red limb emission spectra, Adv. Space Res., 33(7), 1041–1047, 2004. Stiller, G. P., Mengistu Tsidu, G., von Clarmann, T., Glatthor, N.,
H¨opfner, M., Kellmann, S., Linden, A., Ruhnke, R., and Fischer, H.: An enhanced HNO3second maximum in the Antarctic
mid-winter upper stratosphere 2003, J. Geophys. Res., 110, D20303, doi:10.1029/2005JD006011, 2005.
Toon, G. C.: The JPL MkIV Interferometer, Opt. Photonics News, 2, 19–21, 1991.
Urban, J., Lauti´e, N., Le Flochmo¨en, E., Jim´enez, C., Eriksson, P., de La No¨e, J., Dupuy, E., Ekstr¨om, M., El Amraoui, L., Frisk, U., Murtagh, D., Olberg, M., and Ricaud, P.: Odin/SMR limb observations of stratospheric trace gases: Level 2 processing of ClO, N2O, HNO3,and O3, J. Geophys. Res., 110, D14307,
doi:10.1029/2004JD005741, 2005.
Urban, J., Murtagh, D., N. Lauti´e, Barret, B., Dupuy, E., de La No¨e, J., Eriksson, P., Frisk, U., Jones, A., Le Flochmo¨en, E., Olberg, M., Piccolo, C., Ricaud, P., and R¨osevall, J.: Odin/SMR Limb Observations of Trace Gases in the Polar Lower Stratosphere during 2004–2005, Proc. ESA First Atmospheric Science Conference, 8–12 May 2006, Frascati, Italy, edited by: La-coste, H., European Space Agency publications, ESA-SP-628, ISBN-92-9092-939-1, ISSN-1609-042X, http://earth.esrin.esa. it/workshops/atmos2006/participants/68/paper frascati2006.pdf, 2006.
von Clarmann, T. and Echle, G.: Selection of optimized microwin-dows for atmospheric spectroscopy, Appl. Opt., 37(33), 7661– 7669, 1998.
von Clarmann, T., Ceccherini, S., Doicu, A., et al.: A blind test retrieval experiment for limb emission Spectrometry, J. Geophys. Res., 108(D23), 4746, doi:10.1029/2003JD003835, 2003a. von Clarmann, T., Glatthor, N., Grabowski, U., et al.: Retrieval
of temperature and tangent altitude pointing from limb emission spectra recorded from space by the Michelson interferometer for passive atmosphere (MIPAS), J. Geophys. Res., 108(D23), 4736, doi:10.1029/2003JD003602, 2003b.
Wang, D. Y., von Clarmann, T., Fischer, H., et al.: Validation of stratospheric temperatures measured by MIPAS on ENVISAT, J. Geophys. Res., 110, D08301, doi:10.1029/2004JD5342, 2005. Wetzel, G., Oelhaf, H., Friedl-Vallon, F., Kleinert, A., Lengel,
A., Maucher, G., Nordmeyer, H., Ruhnke, R., Nakajima, H., Sasano, Y., Sugita, T., and Yokota, T.: Intercompari-son and validation of ILAS-II version 1.4 target parameters with MIPAS-B measurements, J. Geophys. Res., 111, D11S06, doi:10.1029/2005JD006287, 2006.
World Meteorological Organization: Scientific assessment of ozone depletion: 2002, Global Ozone Res. and Monit. Proj. Rep. No. 47, Geneva, 2003.
Yamamori, M., Kagawa, A., Kasai, Y., Mizutani, K., Murayama, Y., Sugita, T., Irie, H., and Nakajima, H.: Validation of ILAS-II version 1.4 O3, HNO3, and temperature data through
com-parison with ozonesonde, ground-based FTS, and lidar mea-surements in Alaska, J. Geophys. Res., 111(D11), D11S08, doi:10.1029/2005JD006438, 2006.
Yokota, T., Nakajima, H., Sugita, T., Tsubaki, H., Ito, Y., Kaji, M., Suzuki, M., Kanzawa, H., Park, J. H., and Sasano, Y.: Im-proved Limb Atmospheric Spectrometer (ILAS) data retrieval al-gorithm for version 5.20 gas profile products, J. Geophys. Res., 107(D24), 8216, doi:10.1029/2001JD000628, 2002.