HAL Id: insu-01299636
https://hal-insu.archives-ouvertes.fr/insu-01299636
Submitted on 4 May 2016
Solar Spectral Irradiance at 782 nm as Measured by the
SES Sensor Onboard Picard
Mustapha Meftah, Alain Hauchecorne, Abdanour Irbah, Gaël Cessateur,
Slimane Bekki, Luc Damé, David Bolsée, Nuno Pereira
To cite this version:
Mustapha Meftah, Alain Hauchecorne, Abdanour Irbah, Gaël Cessateur, Slimane Bekki, et al.. Solar
Spectral Irradiance at 782 nm as Measured by the SES Sensor Onboard Picard. Solar Physics, Springer
Verlag, 2016, 291 (4), pp.1043-1057. �10.1007/s11207-016-0885-2�. �insu-01299636�
DOI: 10.1007/•••••-•••-•••-••••-•
Solar Spectral Irradiance at 782 nm as Measured by
the SES Sensor Onboard PICARD
M. Meftah1 · A. Hauchecorne1 · A. Irbah1 ·
G. Cessateur2 · S. Bekki1 · L. Dam´e1 ·
D. Bols´ee2 · N. Pereira2 ·
••••
Abstract — Picard is a satellite dedicated to the simultaneous measurement of the total and solar spectral irradiance, the solar diameter, the solar shape, and to the Sun’s interior probing by the helioseismology method. The satellite was launched on June 15, 2010, and pursued its acquisitions until March 2014. A Sun Ecartometry Sensor (SES) was developed to provide the stringent pointing requirements of the satellite. The SES sensor produced an image of the Sun at 782 ±2.5 nm. From the SES data, we obtained a new time series of the solar spectral irradiance at 782 nm from 2010 to 2014. During this period of solar cycle 24, the amplitude of the changes has been on the order of ±0.08 %, corresponding
to a range of about 2×10⁻³W m−2nm−1. SES observations provided a
qualita-tively consistent evolution of the solar spectral irradiance variability at 782 nm. SES data show similar amplitude variations with Spectral And Total Irradiance REconstruction for the Satellite era (SATIRE-S) semi-empirical model whereas the Spectral Irradiance Monitor instrument (SIM) onboard the Solar Radiation and Climate Experiment satellite (SORCE) highlights higher amplitudes. Keywords: Solar Irradiance; Solar Cycle; Instrumentation and Data Manage-ment; Instrumental Effects
1. Introduction
The measurement of the solar spectral irradiance (SSI) is vital for understand-ing how solar variability impacts climate. In addition, it allows a validation of climate model sensitivity with a spectral variation of the solar forcing. The question of how the Earth’s climate is influenced by solar variability remains central to the understanding of anthropogenic climate change. But today, while
1 Universit´e Paris Saclay, Universit´e Paris VI - Pierre et
Marie Curie, CNRS/INSU, LATMOS-IPSL, 11 Boulevard d’Alembert, 78280 Guyancourt, France
Email: Mustapha.Meftah@latmos.ipsl.fr
2 Space Physics Division, Belgian Institute for Space
Aeronomy (BIRA-IASB), Ringlaan 3, B-1180 Brussels, Belgium
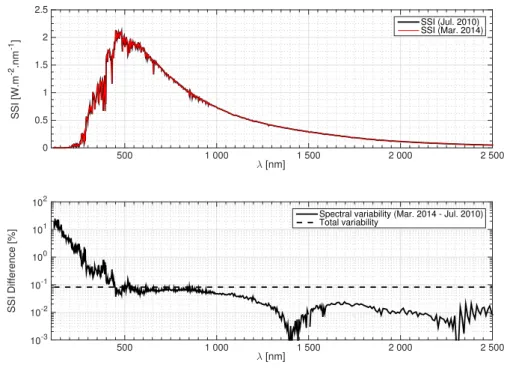
the total solar irradiance (TSI) and the smoothed sunspot number (SSN) retain paramount roles in feeding climate investigations toward the past, the SSI is considered as even more pertinent when the issue becomes the fine control of the Earth atmosphere dynamics. The spectral distribution of the Sun’s radiation at a mean Earth-Sun distance of one astronomical unit is shown in Figure 1. These curves are obtained with data of the Spectral And Total Irradiance RE-construction for the Satellite era (SATIRE-S) semi-empirical model. SATIRE-S (Yeo et al., 2014) is a semi-empirical model, which provides reconstructions of TSI and SSI spanning the entire period of satellite observation at daily cadence. SATIRE-S uses full-disc magnetograms and continuum images of the Sun to quantify the fractional disc area coverage by different surface components (quiet Sun, sunspot umbrae, sunspot penumbrae, faculae, and network) as well as their spatial distribution. Other semi-empirical models exist in the literature (COde for Solar Irradiance (COSI, (Shapiro et al., 2010)), Solar Radiation Physical Modelling (SRPM, (Fontenla and Harder, 2005; Fontenla et al., 2011)), Naval Research Laboratory Solar Spectral Irradiance (NRLSSI, (Lean, 2000)), Osservatorio Astronomico di Roma (OAR, (Ermolli et al., 2013)), etc.).
λ [nm] 500 1 000 1 500 2 000 2 500 SSI [W.m -2.nm -1] 0 0.5 1 1.5 2 2.5 SSI (Jul. 2010) SSI (Mar. 2014) λ [nm] 500 1 000 1 500 2 000 2 500 SSI Difference [%] 10-3 10-2 10-1 100 101 102
Spectral variability (Mar. 2014 - Jul. 2010) Total variability
Figure 1. (top) Spectral distribution of solar irradiance obtained with SATIRE-S above the Earth’s atmosphere (July 26, 2010 and March 6, 2014). The range shown (115.5 - 2500 nm) includes 96.6% of the total solar irradiance with most of the remaining at longer wavelengths. (bottom) SSI difference obtained between July 2010 (beginning of the SES acquisition) and March 2014 (Picard end of life). This paper is highly specific and covers a single wavelength at 782 nm where the irradiance difference between July 2010 SSI and March 2014 SSI is close to 0.05% (500 ppm).
Near-infrared (NIR) observations (700 - 1400 nm) have been sporadic. The level of scientific understanding of NIR irradiance variations is poor (Pagaran et al., 2011). Derivation of reliable irradiance change estimates over an extended period like a solar cycle remains a challenging task. Thus, new observations are required to advance our understanding of the SSI variability in the NIR region. Indeed, NIR irradiance observations allow quantitative comparisons to TSI variability of continuum emission for the deepest layers of the photosphere. Moreover, it allows to clearly identifying the solar rotational modulation for a NIR wavelength. These new measurements may well be compared to different models as mentioned above. However, the SSI variability over the long-term (i.e. 11-year change) is highly uncertain because of the accumulated uncertainty on the instruments. Several instruments have been developed to perform SSI measurements in the visible and infrared. Regular long-term observations of the visible and near-infrared bands started in 1996 with Variability of solar IRradiance and Gravity Oscillations Sun PhotoMeter (VIRGO-SPM) onboard Solar and Heliospheric Observatory (SoHO), which monitor spectral irradiance at 402, 500, and 862 nm
(Fr¨ohlich et al., 1995). Ermolli et al. (2013) gave an overview of the different
space instruments devoted to these measurements:
• The SCanning Imaging Absorption spectroMeter for Atmospheric
CHar-tographY (SCIAMACHY) onboard ENVIronment SATellite (ENVISAT) (Bovensmann et al., 1999; Pagaran, Weber, and Burrows, 2009; Pagaran et al., 2011),
• The Spectral Irradiance Monitor (SIM) onboard the SOlar Radiation and
Climate Experiment satellite (SORCE) (Harder et al., 2005),
• The SOLar SPECtrum (SOLSPEC) instrument onboard the International
Space Station (ISS) (Thuillier et al., 2009),
• and the PREcision Monitor Sensor (PREMOS) onboard Picard (Schmutz
et al., 2009).
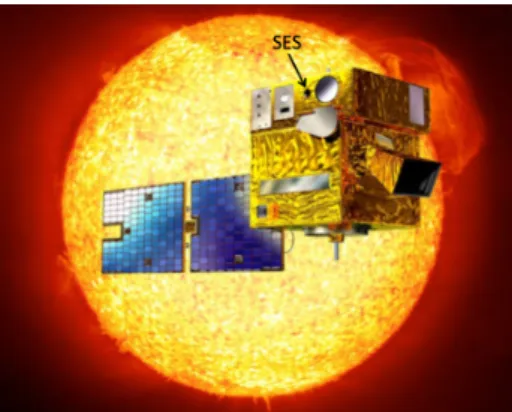
Thus, a new instrument provides an evolution of the SSI over time. It is the Sun Ecartometry Sensor (SES), which is an instrument of the Solar Diameter Imager and Surface Mapper (SODISM) telescope onboard Picard (Meftah et al., 2014). The SES sensor (Figure 2) was developed along with a fine pointing mode to provide the stringent pointing requirements of the Picard satellite. Thus, the SES sensor data were used to provide an evolution over time of the SSI in the NIR region (5 nm bandwidth centred at 782 nm). Nowadays, the SORCE/SIM SSI data (Version 22, May 2015) are available. Moreover this instrument is still acquiring daily spectra from 240 nm to 2412 nm since April 2003. Thus, SIM SSI at 782 nm will be used to perform a direct comparison with the SES data. Like the SES sensor, the PREMOS and VIRGO photometers provide important information in the NIR region, and a comparative study would be valuable in a future work. Therefore, we will focus on SIM observations where there are conflicting trends with semi-empirical models such as SATIRE-S over the whole solar spectrum (Yeo et al., 2014). Thus, in our analysis, we will also make comparisons between the SES SSI evolution and the SATIRE-S SATIRE-SSATIRE-SI evolution at 782 nm. These comparisons are useful from the moment we know that space instrumentation suffers significantly from degradation, which
is particularly severe for instruments devoted to SSI observations. Indeed, the degradation characteristics of all these filters instruments are very different in behaviour. In this article, we report on the SSI measurements of the SES sensor at 782 nm that correspond to preliminary results. These measurements were carried out between July 2010 and March 2014.
Figure 2. Artist’s view of the Picard satellite and SES location that highlights the front part of the sensor with its front filter.
2. Description of the SES Sensor
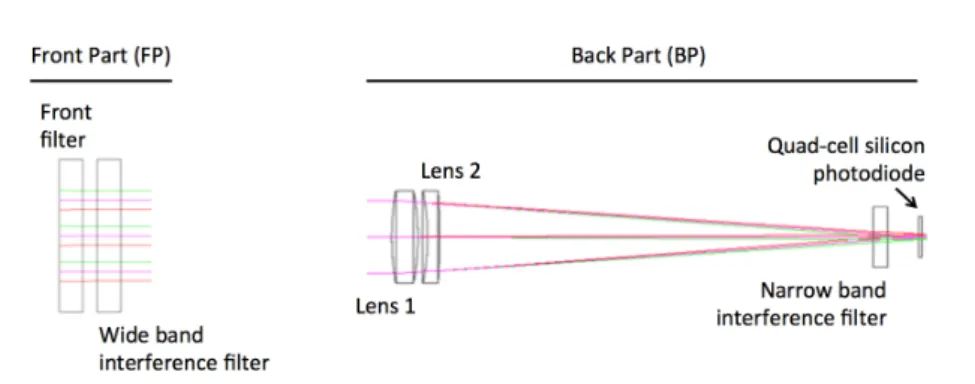
The Picard satellite was successfully launched into a Sun synchronous orbit at an altitude of ∼735 km, allowing us to observe the Sun non-stop, except for short periods during a November-January ‘eclipse season’ when the Earth comes within SODISM-SES line-of-sight once per orbit. The satellite attitude and orbit control subsystem (AOCS) is continuously operated to maintain the solar rotation axis in a constant direction, i.e. ordinarily the solar poles are in a direction parallel to the vertical axis of SODISM images. With respect to the generic AOCS satellite, a dedicated fine pointing mode has been introduced in addition to the normal mode. This fine pointing is based on a SES sensor de-veloped specifically for that purpose and installed within the payload (SODISM telescope). The 2-axes information of the SES are fused with the output of a ‘classical’ autonomous star tracker for providing a 3-axes attitude introduced in the control algorithms. The SES sensor is composed of two parts: an optical front part (FP) and an optoelectronic back part (BP) as shown in the Figure 3. The two parts of the SES sensor are directly mounted on the SODISM telescope in order to minimise the misalignments. The AOCS and the SES sensor achieved a pointing within ±36 arcsec with a maximum drift of 5 arcsec per second. The SES field of view is close to 2000 arcsec. The resolution of the SES is equal to 1 arcsec. A detailed description of the SES is given by Joannes et al. (2008). The front part consists of a front window, which comprises a front filter (transmission of 14% at 782 nm) and a wide band interference filter (transmission ∼ 90%). All these filters are manufactured with BK7-G18 radiation resistant glass. The clear aperture of the system is equal to 13.3 mm, where the solar irradiance at
Figure 3. SES sensor optical path consists of a front window that comprises a front filter and a wide band interference filter, a doublet lens, a narrow band interference filter, and quad-cell silicon photodiode. There is a front part (FP) and a back part (BP).
782 nm is close to 1.19 W m−2nm−1 at the SES pupil. The back part includes
the lenses that are in BK7-G18 and SF6-G05 glasses (transmission ∼ 90%), the narrow band interference filter at 782 ±2.5 nm (transmission ∼ 75% and rejection
∼ 10−4) in BK7-G18 glass, the detector (quad-cell silicon photodiode API
SD-085-23-21-021 with a responsivity of ∼ 0.55 A W−1at 782 nm), and the electronic
unit. The doublet lens produces an image of the Sun on the detector. Consid-ering the Sun half field angle of 960 arcsec, the focal length of the doublet lens (107.6 mm) is such that the image diameter is close to 1 mm. The filtered solar image is projected on the four quadrants detector (quad-cell silicon photodiode with a sensitive area of 4×1.5 mm×1.5 mm) of the electronic back part. Each cell of the detector provides a voltage output proportional to the received light intensity. All the optical elements in the path attenuate the solar radiation to
a power density of 7.5 mW cm−2 into the spot of 1 mm diameter, meaning a
total power of 58.9 µW. This produces a photocurrent of 31.45 µA, i.e. 7.86 µA per quadrant for a centred spot. In our application, we will use the four signals (mean value) of the detector to obtain the evolution of the SES over time (SES signal evolution) with a time acquisition of 30 seconds. The absolute calibration of the SES sensor has not been performed with a blackbody. Thus, the stated solar spectral irradiance at 782 nm is taken from the ATLAS 3 value (Thuillier et al., 2003) without a further ground-based validation.
3. Observational Results and Corrections
3.1. SES Signal and Temperatures Observational Results
The SES sensor was exposed to sunlight for the first time on July 20, 2010. The integrated intensity in the SES signal at 782 nm has been computed during the entire mission of the Picard satellite and its temporal evolution is displayed in Figure 4 (left). The black curve (SES signal) corresponds to this evolution and gives an indication of flight operations (payload switch off, stellar pointing, satellite roll, etc.). The cyan curve (Seq. 1) corresponds to the first measure-ment sequence (July 2010 to January 2011). The Picard satellite entered safe
mode on January 9, 2011 due to an anomaly with a stellar sensor. All non-essential systems such as the SES sensor were shut down. This date corresponds to the end of the sequence 1. The blue curve (Seq. 2) corresponds to the second measurement sequence (January 24, 2011 to October 2013), which is associated with a nominal operation. From October 26, 2013, the Picard satellite pursued acquisitions to the end of March 2014, during technological operations of the satellite (closing and opening of the SODISM telescope door, satellite rotations, etc.). The magenta curve corresponds to the third sequence of measurements (Seq. 3). The technological operations of the satellite during this sequence affect the measurements made by the SES sensor and its temperatures (Figure 4, right). The SES back part (BP) temperature is slightly affected, unlike the front part (FP) temperature of the sensor. The SES FP temperature has significantly varied during the mission. Fluctuations result from a large number of factors. The thermal effects caused by these factors have a range in duration from hours to a long-term of months or years. There are short-term factors (SES switch OFF/ON, orbital variation, technological operations of the satellite). There are also intermediate term factors (Earth eclipses, mean distance to the Sun). During Earth eclipse seasons (between November and February), the overall temperature of the SES is reduced. We can see that when the SES temperatures change, the SES sensor performance is affected (Figure 4, left).
Figure 4. (left) SES signal evolution over time (black curve) obtained with the mean of the four signals of the detector. The cyan curve corresponds to the first sequence of measurements (Seq. 1). The blue curve corresponds to the second sequence of measurements (Seq. 2). The ma-genta curve corresponds to the third sequence of measurements (Seq. 3). (right) Temperature evolution of the SES FP (blue curve) and of the SES BP (red curve).
3.2. Orbital Variation of the SES Signal
The Picard satellite was placed in a ∼735 km Sun synchronous orbit (06h00-18h00) with inclination of 98.28 degrees. The selection of a Sun synchronous orbit with a local time of ascending node of 06h00 permits to observe the Sun as long as possible and to limit the eclipses. The Picard satellite dedicated to study the Sun takes advantage of Sun synchronous orbit near polar inclination. The period of the satellite is close to 99.4 mn. During an orbit, the whole platform is further subject to thermal inputs from the Sun and the Earth. They vary along
the orbit because the platform maintains a fixed attitude with respect to the Sun and therefore is not fixed with respect to the Earth, and because the terrestrial surface is not homogeneous (lands and seas, etc.). Thus, there is a variation of the outgoing long-wave radiation (infrared emission) and of the reflected short-wave radiation (albedo) of the Earth during an orbit. It has consequences on the temperature stability of the SES sensor. Therefore, we have to face orbital effects that affect the radiometric signal of the SES sensor. The black curve (SES signal) as shown in the Figure 5 (left) corresponds to this effect. During an orbit, the SES sensor could be sensitive to solar variations of few minutes due to solar convection and oscillations. However, it is especially sensitive to the indirect effects of the outgoing long-wave radiation and the reflected short-wave radiation variations that affect the temperature of the SODISM telescope structure. At 782 nm, red enhanced quad-cell silicon photodiode have a small but significant temperature coefficient of radiant sensitivity of about the magnitude of the excursions seen in the Figure 5 (left). However, there is no adequate temperature housekeeping (HK) telemetry near the SES quad-cell silicon photodiode, where a correction could have been built with the manufacturer’s temperature coefficients of the SES detector. Thus, by making daily average or 99.4 mn period of the SES sensor signal, we avoid this problem.
Figure 5. (left) SES signal evolution within four orbits (black curve), which highlights an orbital signature in the data linked with the temperature variation. The blue curve corre-sponds to the sine fit of the signal (short-term instrumental variations). (right) The red curve corresponds to the dark current level of the SES signal during space calibrations (long-term instrumental trend).
3.3. Dark Current of the SES Signal
The dark current level of the SES sensor is obtained during space calibration (stellar calibration, Earth eclipse seasons, closing and opening of the SODISM door) where the sensor was not exposed to sunlight. The dark current level of the SES sensor is displayed in Figure 5 (right). The corrected signal of the SES sensor in order to obtain the SSI at 782 nm should consider this effect.
3.4. Transit of Venus and Sensitivity of the SES
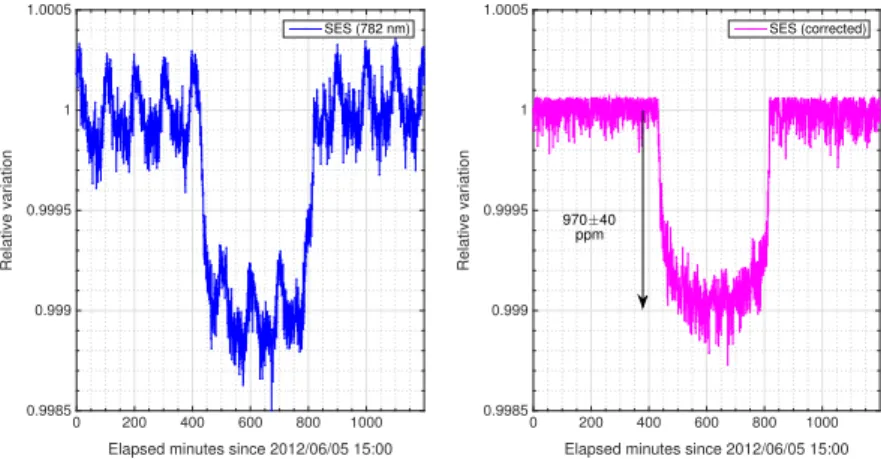
Figure 6 (left) displays the high cadence solar spectral irradiance at 782 nm as measured by the SES sensor, where a decrease of about 1000 parts per million (ppm) is caused by the Venus transit, which has been observed with the Picard satellite on June 5-6, 2012. The Venus transit was therefore unmistakable in the plotted SES measurements. A complete revolution of the satellite around the Earth disturbs the SES sensor measurements. This revolution generates a variation of the SES measurements with a period of 99.4 mn that is clearly visible in the Figure 6 (left). A sine fit is calculated to correct the signal from this disturbance. The corrected signal of the SES sensor during the transit of Venus is shown in Figure 6 (right). In good agreement with predictions based on the positions of the Picard satellite, Venus, and the Sun, the incident sunlight as seen by the SES sensor at 782 nm decreased by 970 ±40 ppm during the transit. The SES sensor has a precision of approximately 40 ppm, so it can detect very small fluctuations in the solar spectral irradiance at 782 nm as needed for monitoring long-term SSI variability. By making daily average or 99.4 mn period of the SES sensor measurements, the precision is even better. With this extremely good level of sensitivity, normal solar fluctuations of a few dozen ppm due to solar convection and oscillations are readily apparent, as are larger (∼ 1000 ppm), longer-duration changes due to sunspots and faculae.
Elapsed minutes since 2012/06/05 15:00 0 200 400 600 800 1000 Relative variation 0.9985 0.999 0.9995 1 1.0005 SES (782 nm)
Elapsed minutes since 2012/06/05 15:00 0 200 400 600 800 1000 Relative variation 0.9985 0.999 0.9995 1 1.0005 SES (corrected) 970±40 ppm
Figure 6. (left) The 5-6 June 2012 Venus transit as measured with the SES sensor at 782 nm. The SES sensor took measurements every 30 seconds. (right) Sine fit corrected signal of the SES sensor during the transit of Venus to take into account the orbital variation.
3.5. Ageing Correction of the SES Measurements
The SES sensor was continuously exposed to the Sun except during short periods (closing and opening of the SODISM telescope door). Under the influence of the harsh space environment, the general behaviour of the SES signal was not nominal (see SES sequences evolution). Thus, a degradation of the SES sensor was observed (Figure 4, left). Investigation and analysis of the degradation of
space instruments are crucial parts of achieving the scientific goals of all such instruments. The degradation of space instruments can be complex and their causes are difficult to understand. In our case, the SES sensor degradation could be the result of the combination of several independent degradation processes. We can cite at least different processes of degradation. The degradation seen by the SES sensor can be due to the build-up of a contamination layer on the front filter of the SES FP (transmission decrease observed). In addition, there may be a deviation of internal transmittance of the SES front filter due to irradiation (gamma, electron, proton, and neutrons). There may also be an evolution of the temperature gradient of the SES FP, which causes a change in the focal length of the SES such as the SODISM front window (Meftah et al., 2015). Moreover, the transmission of the narrow band interference filter may have also changed with the evolution of the SES FP temperature (wavelength shift). Finally, the quad-cell silicon photodiode may have suffered of a drop in gain owing to the exposure of radiation. The first measurement sequence (July 2010 to January 2011) of the SES sensor corresponds to a period of low solar activity that highlights a fast process of degradation. Indeed, the SES sensor showed steady degradation of the first-order signal over the first six months of operation as shown in the Figure 4 (left). Then, the degradation processes were decreased during the second mea-surement sequence to become very low. The degradation process (contamination) in nature may have exponential dependencies, where the filters and the lenses used in the SES probably suffered a loss in the signal that varies exponentially according to the thickness and characteristics of the contaminant. Thus, an exponential fit corresponds to the evolution of the SES sensor measurements. This exponential fit is used to correct the SES data. Therefore, the non-solar features should be extracted from the SES sensor data. Ideally, the use of a redundant SES sensor would have provided an episodic measurement in order to correct the degradation of the operational SES sensor. However, the SES sensor was not originally designed to achieve these measurements. Nevertheless, the data obtained with the SES sensor are relevant.
3.6. Discussion about the Potential Mechanisms of the SES Sensor Degradation We have listed a number of potential mechanisms for degradation of the SES sensor, but there is no quantitative analysis to determine the magnitude, slope, and relative contributions from the different mechanisms listed in the previous section. All the mechanisms discussed in the Section 3.5 are not necessarily exponential in character and evolve with different time constants. In particular, narrow band interference filters do not degrade as simple exponential functions and their characteristics vary widely. The curves shown in Figure 4 (left) are probably not consistent with only a build-up of organic material with an increas-ing opacity as discussed in this section. As further example, the red enhanced quad-cell silicon photodiode used in this sensor is a p-n photodiode that ex-periences about 10-100 times faster degradation for electron bombardment and roughly a factor of three faster for protons than its n-p counterpart. The shape of the curves in Figure 4 (left) are suggestive a different sort of degradation process in the latter part of the mission. For there to be meaningful comparison of the
long-term trends, a viable measurement equation for the degradation process and a time dependent evaluation of the terms in this equation (with their associated errors) would be necessary. Nevertheless, this process is not possible for this sensor because there is no on-board standard to identify long-term contributions (i.e. a lamp system or a comparison radiometer) and no pre-flight calibration to identify critical instrument performance parameters. Therefore, we fit the time series and remove it as longer term trend.
4. SES SSI Time Series, Results, and Discussion
The SES sensor has made continuous measurements of SSI at 782 nm from July 2010 to March 2014. These measurements are interesting compared to SSI exist-ing data. Indeed, new observations may help to resolve some of the differences in existing long-term time series of measurements. Thus, comparisons were carried out between the Level 1 SES data at 782 nm and SIM measurements at 781.3 nm. Moreover, a comparison between measurements and SATIRE-S semi-empirical model was performed. In the near-infrared, different models give similar results. Thus, SATIRE-S was taken as a reference model. Figure 7 (left) displays the
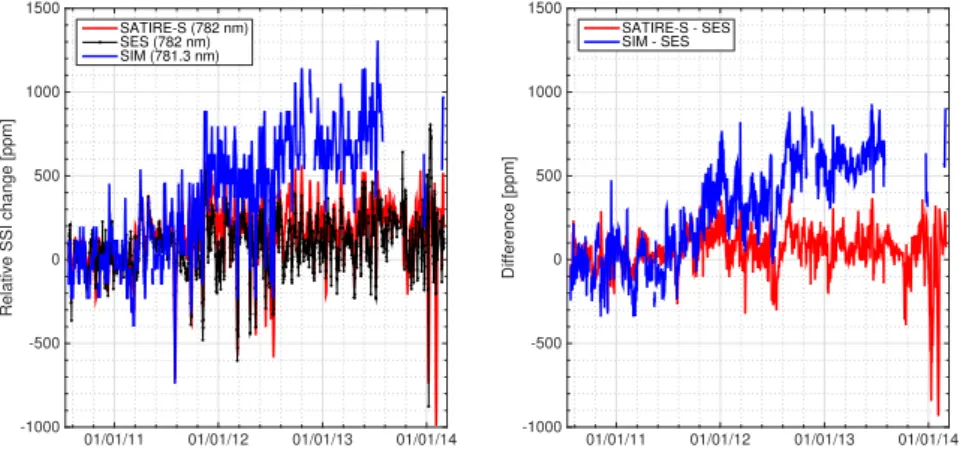
01/01/11 01/01/12 01/01/13 01/01/14
Relative SSI change [ppm]
-1000 -500 0 500 1000 1500 SATIRE-S (782 nm) SES (782 nm) SIM (781.3 nm) 01/01/11 01/01/12 01/01/13 01/01/14 Difference [ppm] -1000 -500 0 500 1000 1500 SATIRE-S - SES SIM - SES
Figure 7. (left) Relative solar spectral irradiance change as observed by the SES sensor (black curve) and SIM (blue curve). The red curve corresponds to the solar spectral irradiance at 782 nm obtained with SATIRE-S model. (right) Differences between SATIRE-S, SIM, and SES results. SIM has not made continuous measurements from July 2010 to March 2014. Indeed, the SORCE satellite entered safe mode during the year 2013 due to an anomaly. solar spectral irradiance as seen by the SES sensor, SIM, and SATIRE-S model from July 2010 to March 2014. There are conflicting trends between SIM ob-servations and SES results, whereas the SATIRE-S semi-empirical model and the SES results show similar evolutions. As a reminder, claimed SIM results on solar cycle variability (Harder et al., 2009) indicate out-of-phase variations for visible and near-infrared variations. SIM out-of-phase variations for near-infrared variations are in debate as they do not agree with prior measurements and most
solar irradiance models. Figure 7 (right) displays the SSI differences between SATIRE-S, SIM, and SES results. The conflict between SES and SIM results is clearly visible for the SSI variability over the long-term. During the entire
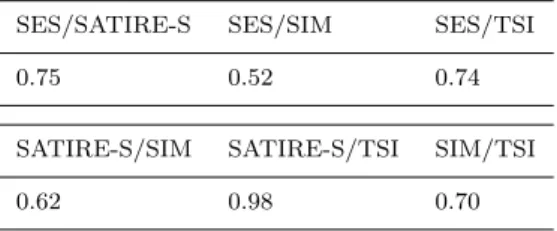
mission of Picard, the correlation coefficient (R2) between SES and SATIRE-S
SSI variations is close to 0.75. There is a good correlation between these two sets of data based on the Pearson definition. The correlation coefficient between SES and SIM observations is less good (Table 1). The excellent correlation between the SATIRE-S empirical model and the TSI raises question. Indeed, the correlation coefficient between the SES sensor and the the TSI observations is close to 0.74 very near to SIM/TSI correlation. All correlation coefficients are given in the Table 1.
Table 1. Pearson’s linear correlation coefficient (R2) between the SES sensor, SATIRE-S, SIM, and the TSI.
SES/SATIRE-S SES/SIM SES/TSI
0.75 0.52 0.74
SATIRE-S/SIM SATIRE-S/TSI SIM/TSI
0.62 0.98 0.70
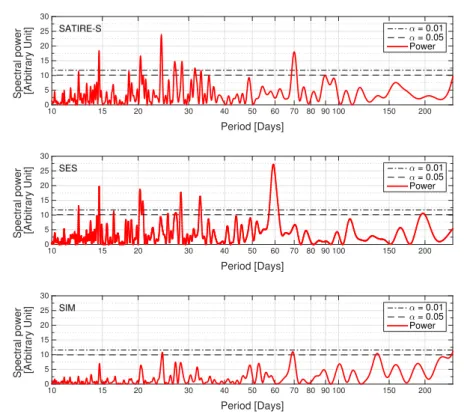
For a better comparison of the results, a spectral analysis for each set of data was carried out. For space measurements, it is common to have incomplete or unevenly sampled time series for a given variable. Determining cycles in such series is not directly possible with methods such as Fast Fourier Transform (FFT) and may require some degree of interpolation to fill the gaps. An alternative is the Lomb-Scargle method (Lomb, 1976; Scargle, 1982), which estimates a frequency spectrum based on a least squares fit of sinusoid. Figure 8 displays the Lomb-Scargle periodograms of three time-series (daily mean), which show the link between the SATIRE-S semi-empirical model, the SES sensor, and SIM. SIM data show no periodicities with statistical significance level over 99% (Figure 8). On short-term rotational basis, the SES data appears to be just fine but in a comparison with SIM there is no way to ascertain that the long-term trends that are in the SIM data are not plausible. For proper comparison with SIM, such as done in the Lomb-Scargle comparison the slowly varying trend contributions in SIM increase the variance in the data and thus decrease the power spectral density (PSD) relative to the false alarm probability (fap) or statistical significance level. A simple way to show this is to high pass filter on SIM data and then compare the PSD as a function of the period as done in Figure 8. Figure 9 (top) displays the Lomb-Scargle periodograms of the SIM data high pass filtered. We see that this data set surpasses the fap estimate at the periodicities called out in Figure 8. Finally, we highlight that SIM has not made continuous measurements from July 2010 to March 2014. Indeed, all SORCE instruments ceased operations on July 30, 2013 due to an anomaly of the satellite (battery degradation). The SIM instrument was again operational
Period [Days]
10 15 20 30 40 50 60 70 80 90 100 150 200
Spectral power [Arbitrary Unit]
0 5 10 15 20 25 30 α = 0.01 α = 0.05 Power Period [Days] 10 15 20 30 40 50 60 70 80 90 100 150 200
Spectral power [Arbitrary Unit]
0 5 10 15 20 25 30 α = 0.01 α = 0.05 Power Period [Days] 10 15 20 30 40 50 60 70 80 90 100 150 200
Spectral power [Arbitrary Unit]
0 5 10 15 20 25 30 α = 0.01 α = 0.05 Power SES SATIRE-S SIM
Figure 8. Lomb-Scargle periodogram of three time-series (SATIRE-S, SES, and SIM daily mean) with statistical significance levels (0.01 corresponds to 99% significance level).
on December 22, 2013. Thus, the discontinuity in the SIM data may influence the results of the spectral analysis especially for long periods.
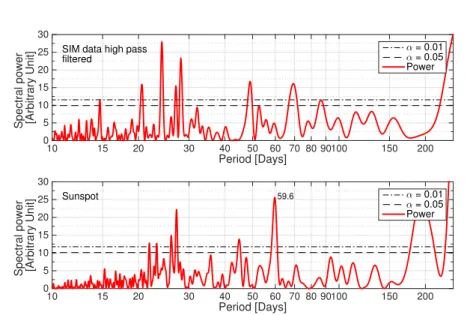
So, the comparison between the SATIRE-S semi-empirical model, the SES sensor, and the corrected SIM data is conceivable. Comparison of short-term variations show a rather good similitude between these three time-series (Fig-ure 8 and Fig(Fig-ure 9). Similar solar periodicities were highlighted (14.6, 20.3, 28.3, and ∼ 32 days). SES data show a significant solar periodicity around 59.5 days, which is also observed with SODISM solar radius data (Meftah et al., 2015) and sunspots number data (Figure 9 (bottom)). The 59.5-day component that appears in the SES data are not present in SIM or SATIRE-S with sta-tistical significance levels. It’s unlikely that this suggests an uncorrected SES instrumental artefact. Indeed, this is probably an actual solar response, since it is also observed in the sunspots number. As the periodicities in sunspot and SES time series vary strongly with time, we use the wavelet transform coherence (WTC) to follow the temporal evolution of the coherence. WTC is a method to estimate the mean squared coherence and phase lag between time series as a function of both time and period/frequency. Figure 10 shows the WTC results between sunspot and SES. The coherence field looks patchy, partly because of the intermittent character of the periodicities in the time series and of the
Period [Days]
10 15 20 30 40 50 60 70 80 90100 150 200
Spectral power [Arbitrary Unit] 0 5 10 15 20 25 30 α = 0.01 α = 0.05 Power Period [Days] 10 15 20 30 40 50 60 70 80 90100 150 200
Spectral power [Arbitrary Unit] 0 5 10 15 20 25 30 α = 0.01 α = 0.05 Power 59.6 Sunspot SIM data high pass filtered
Figure 9. Lomb-Scargle periodogram of two time-series (SIM daily mean corrected data and sunspots number data) with statistical significance levels. Sunspot data source: WDC-SILSO, Royal Observatory of Belgium, Brussels.
relatively small temporal interval considered here (corresponding to the temporal resolution of the WTC), resulting in large uncertainties in the spectral analysis. The most outstanding feature is an area of strong significative coherence centred around 59.5 days but extending vertically to about 45 and 80 days, and lasting about 7 months (from the end of 2011 to middle of 2012). Smaller patches of strong coherence can also be found over the interval of the 16 to 35 days period, most likely related to the solar rotational periodicity.
Finally, the SATIRE-S semi-empirical model and the SIM data highlight a significant period around 70 days that is not found significant with the SES data as with sunspots number data. It might be worth checking the PREMOS 782 nm feature for confirmation.
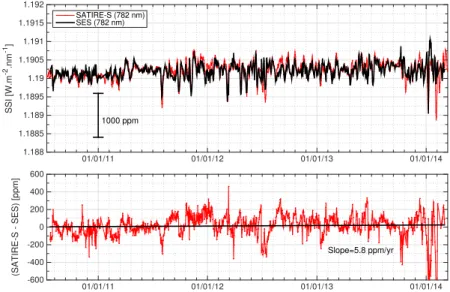
Thus, there may be existing differences in these time series at 782 nm that highlight the importance of having a large number of measurements to im-prove the models. Indeed, the time history of SSI variability in the near-infrared part of the spectral distribution of solar irradiance is not nearly reliable. Fig-ure 11 (top) displays daily time series of the solar spectral irradiance at 782 nm as seen by the SATIRE-S semi-empirical model and the SES sensor. The median standard deviation (σ = 1) of the SES SSI daily time series after the piecewise
exponential fit was removed is close to ±2.5×10⁻⁵W m−2nm−1 (∼ ±20 ppm).
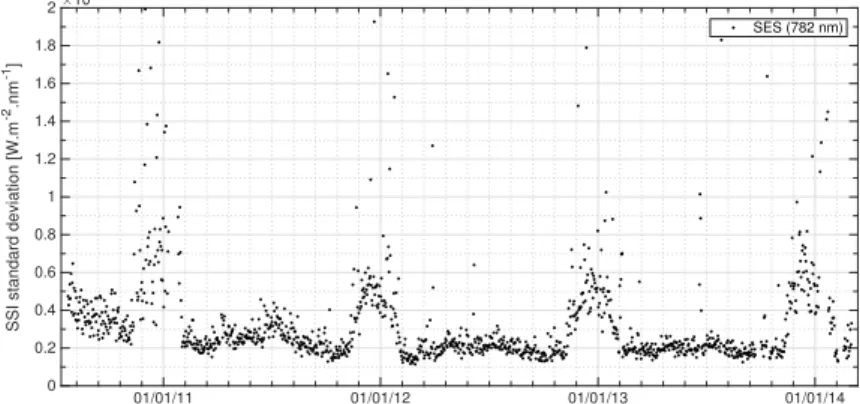
SES SSI standard deviation (Figure 12) is greatest during ‘eclipse season’ where a temperature effect perturbs the measurements. Indeed, the temperature response of the SES quad-cell silicon photodiode may be greatly varying during this typical period of high temperature variations. Our observations require further studies to
Figure 10. Wavelet Transform Coherence (WTC) between sunspot and SES. Solid contour lines represent the 95% confidence level. Arrows represent the relative phase between sunspot and SES time series. The cone-of-influences is represented by the pale areas on the vertical edges of the Figure.
01/01/11 01/01/12 01/01/13 01/01/14 SSI [W.m -2.nm -1] 1.188 1.1885 1.189 1.1895 1.19 1.1905 1.191 1.1915 1.192 SATIRE-S (782 nm) SES (782 nm) 01/01/11 01/01/12 01/01/13 01/01/14 (SATIRE-S - SES) [ppm] -600 -400 -200 0 200 400 600 1000 ppm Slope=5.8 ppm/yr
Figure 11. (top) SSI variability time series of the SES sensor at 782 nm and of the SATIRE-S model at 782 nm. (bottom) Differences between SATIRE-S and SES SSI variability at 782 nm. There may be up to 500-ppm difference in the solar spectral irradiance level between SES and SATIRE-S.
(782 nm) at the beginning of the mission (see Section 2). SATIRE-S and SES time series highlights a good agreement. Differences between SATIRE-S and SES SSI variability at 782 nm are lower than few hundred ppm (Figure 11, bottom). The SATIRE-S trends diverge very weakly from those shown by the SES sensor. The slope of the difference between SATIRE-S and SES SSI variability is close to
6 ppm per year. This confirms the good agreement between SES measurements and SATIRE-S model.
01/01/11 01/01/12 01/01/13 01/01/14
SSI standard deviation [W.m
-2.nm -1] ×10-4 0 0.2 0.4 0.6 0.8 1 1.2 1.4 1.6 1.8 2 SES (782 nm)
Figure 12. Evolution of the SES SSI standard deviation over time.
5. Conclusion
Measurements of SSI are scattered and inhomogeneous. Instrument stability and measurement continuity are needed for discerning long-term solar variability. Indeed, possible degradation trends for space missions exist and introduce errors in SSI measurements. Known artefacts remain in some reported measurements. Thus, new observations are required to advance our understanding of the solar spectral irradiance variability that is predominantly caused by magnetic fea-tures on the solar surface. The SES sensor of the Picard mission provides a new time series of the solar spectral irradiance at 782 nm from 2010 to 2014. During this period, the amplitude of the SSI changes has been on the order of
±0.08 %, corresponding to a range of about 2×10⁻³W m−2nm−1. The median
uncertainty of the SSI time series is close to ±2.5×10⁻⁵W m−2nm−1. The SES
trends diverge significantly from those shown by SORCE/SIM while they are compatible with the SATIRE-S semi-empirical model. The finding of too strong SORCE/SIM trends is consistent with the conclusion of a recent study that the ozone response to solar variability simulated using the SORCE spectral solar irradiance data was inconsistent with the ozone observations (Ball et al., 2016).
Similar solar periodicities between the SES and SATIRE-S were highlighted (14.6, 20.3, 28.3, and ∼ 32 days). SES data show a significant solar periodicity around 59.5 days, which is also observed with SODISM solar radius data and sunspots number data. This period is not found to be significant with the SATIRE-S semi-empirical model and with the SIM data. In contrast, they highlight a significant period around 70 days that is not found to be significant in both the SES and sunspots number data. Thus, it exists differences in these time series that highlight the importance of having a large number of measurements to improve the models.
Acknowledgements Picard is a mission supported by the French national centre for sci-entific research (CNRS/INSU), by the French space agency (CNES), by the French Atomic Energy and Alternative Energies Commission (CEA), by the Belgian Space Policy (BELSPO), by the Swiss Space Office (SSO), and by the European Space Agency (ESA). The authors would like to thank the Laboratory for Atmospheric and Space Physics (LASP, United States) for providing the SORCE/SIM data and the Max Planck Institute for Solar System Research (Germany) for providing the SATIRE-S data. In addition, we wish to thank the CNES project managers (Fran¸cois Buisson and Michel Rouz´e) of the Picard mission. Finally, the authors thank the anonymous referee for the very good improvements, remarks, and suggestions.
References
Ball, W.T., Haigh, J.D., Rozanov, E.V., Kuchar, A., Sukhodolov, T., Tummon, F., Shapiro, A.V., Schmutz, W.: 2016, High solar cycle spectral variations inconsistent with strato-spheric ozone observations. ArXiv e-prints.
Bovensmann, H., Burrows, J.P., Buchwitz, M., Frerick, J., No¨el, S., Rozanov, V.V., Chance, K.V., Goede, A.P.H.: 1999, SCIAMACHY: Mission Objectives and Mea-surement Modes. Journal of Atmospheric Sciences 56, 127 – 150. doi:10.1175/1520-0469(1999)056¡0127:SMOAMM¿2.0.CO;2.
Ermolli, I., Matthes, K., Dudok de Wit, T., Krivova, N.A., Tourpali, K., Weber, M., Un-ruh, Y.C., Gray, L., Langematz, U., Pilewskie, P., Rozanov, E., Schmutz, W., Shapiro, A., Solanki, S.K., Woods, T.N.: 2013, Recent variability of the solar spectral irradiance and its impact on climate modelling. Atmospheric Chemistry & Physics 13, 3945 – 3977. doi:10.5194/acp-13-3945-2013.
Fontenla, J., Harder, G.: 2005, Physical modeling of spectral irradiance variations. Mem. Soc. Astron. Italiana 76, 826.
Fontenla, J.M., Harder, J., Livingston, W., Snow, M., Woods, T.: 2011, High-resolution so-lar spectral irradiance from extreme ultraviolet to far infrared. Journal of Geophysical Research (Atmospheres) 116, D20108. doi:10.1029/2011JD016032.
Fr¨ohlich, C., Romero, J., Roth, H., Wehrli, C., Andersen, B.N., Appourchaux, T., Domingo, V., Telljohann, U., Berthomieu, G., Delache, P., Provost, J., Toutain, T., Crommelynck, D.A., Chevalier, A., Fichot, A., D¨appen, W., Gough, D., Hoeksema, T., Jim´enez, A., G´omez, M.F., Herreros, J.M., Cort´es, T.R., Jones, A.R., Pap, J.M., Willson, R.C.: 1995, VIRGO: Experiment for Helioseismology and Solar Irradiance Monitoring. Solar Phys. 162, 101 – 128. doi:10.1007/BF00733428.
Harder, J.W., Fontenla, J.M., Pilewskie, P., Richard, E.C., Woods, T.N.: 2009, Trends in solar spectral irradiance variability in the visible and infrared. Geophys. Res. Lett. 36, 7801. doi:10.1029/2008GL036797.
Harder, J., Lawrence, G., Fontenla, J., Rottman, G., Woods, T.: 2005, The Spectral Irradiance Monitor: Scientific Requirements, Instrument Design, and Operation Modes. Solar Phys. 230, 141 – 167. doi:10.1007/s11207-005-5007-5.
Joannes, L., Dewandel, J.-L., Ligot, R., Pascal, V., Bols´ee, D., Michel, A., Peetermans, W., Cal-ifice, P.: 2008, Solar Ecartometry Sensor with 1 arcsec Resolution for the Picard Satellite. 7th ICSO (International Conference on Space Optics), Toulouse (2008).
Lean, J.: 2000, Evolution of the Sun’s Spectral Irradiance Since the Maunder Minimum. Geophys. Res. Lett. 27, 2425 – 2428. doi:10.1029/2000GL000043.
Lomb, N.R.: 1976, Least-squares frequency analysis of unequally spaced data. Astrophys. Space Sci. 39, 447 – 462. doi:10.1007/BF00648343.
Meftah, M., Hochedez, J.-F., Irbah, A., Hauchecorne, A., Boumier, P., Corbard, T., Turck-Chi`eze, S., Abbaki, S., Assus, P., Bertran, E., Bourget, P., Buisson, F., Chaigneau, M., Dam´e, L., Djafer, D., Dufour, C., Etcheto, P., Ferrero, P., Hers´e, M., Marcovici, J.-P., Meissonnier, M., Morand, F., Poiet, G., Prado, J.-Y., Renaud, C., Rouanet, N., Rouz´e, M., Salabert, D., Vieau, A.-J.: 2014, Picard SODISM, a Space Telescope to Study the Sun from the Middle Ultraviolet to the Near Infrared. Solar Phys. 289, 1043 – 1076. doi:10.1007/s11207-013-0373-x.
Meftah, M., Hauchecorne, A., Irbah, A., Corbard, T., Ikhlef, R., Morand, F., Renaud, C., Riguet, F., Pradal, F.: 2015, On the Constancy of the Diameter of the Sun during the Rising Phase of Solar Cycle 24. Astrophys. J. 808, 4. doi:10.1088/0004-637X/808/1/4. Pagaran, J., Weber, M., Burrows, J.: 2009, Solar Variability from 240 to 1750 nm in Terms
of Faculae Brightening and Sunspot Darkening from SCIAMACHY. Astrophys. J. 700, 1884 – 1895. doi:10.1088/0004-637X/700/2/1884.
Pagaran, J., Harder, J.W., Weber, M., Floyd, L.E., Burrows, J.P.: 2011, Intercomparison of SCIAMACHY and SIM vis-IR irradiance over several solar rotational timescales. Astron. Astrophys. 528, A67. doi:10.1051/0004-6361/201015632.
Scargle, J.D.: 1982, Studies in astronomical time series analysis. II - Statistical aspects of spec-tral analysis of unevenly spaced data. Astrophys. J. 263, 835 – 853. doi:10.1086/160554. Schmutz, W., Fehlmann, A., H¨ulsen, G., Meindl, P., Winkler, R., Thuillier, G., Blattner, P.,
Buisson, F., Egorova, T., Finsterle, W., Fox, N., Gr¨obner, J., Hochedez, J.-F., Koller, S., Meftah, M., Meisonnier, M., Nyeki, S., Pfiffner, D., Roth, H., Rozanov, E., Spescha, M., Wehrli, C., Werner, L., Wyss, J.U.: 2009, The PREMOS/PICARD instrument calibration. Metrologia 46, 202. doi:10.1088/0026-1394/46/4/S13.
Shapiro, A.I., Schmutz, W., Schoell, M., Haberreiter, M., Rozanov, E.: 2010, NLTE solar irradiance modeling with the COSI code. Astron. Astrophys. 517, A48. doi:10.1051/0004-6361/200913987.
Thuillier, G., Hers´e, M., Labs, D., Foujols, T., Peetermans, W., Gillotay, D., Simon, P.C., Mandel, H.: 2003, The Solar Spectral Irradiance from 200 to 2400 nm as Measured by the SOLSPEC Spectrometer from the Atlas and Eureca Missions. Solar Phys. 214, 1 – 22. doi:10.1023/A:1024048429145.
Thuillier, G., Foujols, T., Bols´ee, D., Gillotay, D., Hers´e, M., Peetermans, W., Decuyper, W., Mandel, H., Sperfeld, P., Pape, S., Taubert, D.R., Hartmann, J.: 2009, SOLAR/SOLSPEC: Scientific Objectives, Instrument Performance and Its Absolute Calibration Using a Blackbody as Primary Standard Source. Solar Phys. 257, 185 – 213. doi:10.1007/s11207-009-9361-6.
Yeo, K.L., Krivova, N.A., Solanki, S.K., Glassmeier, K.H.: 2014, Reconstruction of total and spectral solar irradiance from 1974 to 2013 based on KPVT, SoHO/MDI, and SDO/HMI observations. Astron. Astrophys. 570, A85. doi:10.1051/0004-6361/201423628.