HAL Id: hal-00305079
https://hal.archives-ouvertes.fr/hal-00305079
Submitted on 3 Jul 2007
HAL is a multi-disciplinary open access
archive for the deposit and dissemination of
sci-entific research documents, whether they are
pub-lished or not. The documents may come from
teaching and research institutions in France or
abroad, or from public or private research centers.
L’archive ouverte pluridisciplinaire HAL, est
destinée au dépôt et à la diffusion de documents
scientifiques de niveau recherche, publiés ou non,
émanant des établissements d’enseignement et de
recherche français ou étrangers, des laboratoires
publics ou privés.
capping of floods along the middle reaches of the Elbe
River in Germany
S. Huang, J. Rauberg, H. Apel, M. Disse, K.-E. Lindenschmidt
To cite this version:
S. Huang, J. Rauberg, H. Apel, M. Disse, K.-E. Lindenschmidt. The effectiveness of polder systems on
peak discharge capping of floods along the middle reaches of the Elbe River in Germany. Hydrology
and Earth System Sciences Discussions, European Geosciences Union, 2007, 11 (4), pp.1391-1401.
�hal-00305079�
www.hydrol-earth-syst-sci.net/11/1391/2007/ © Author(s) 2007. This work is licensed under a Creative Commons License.
Earth System
Sciences
The effectiveness of polder systems on peak discharge capping of
floods along the middle reaches of the Elbe River in Germany
S. Huang1, J. Rauberg2, H. Apel1, M. Disse3, and K.-E. Lindenschmidt11GFZ GeoForschungsZentrum Potsdam, Section 5.4 – Engineering Hydrology, Telegrafenberg, 14473 Potsdam, Germany 2GFZ GeoForschungsZentrum Potsdam, Section 2.3 – Earth’s Magnetic Field, Telegrafenberg, 14473 Potsdam, Germany 3Institute of Hydroscience, University of German Armed Forces, Werner-Heisenberg-Weg 39, 85579 Neubiberg, Germany
Received: 11 January 2007 – Published in Hydrol. Earth Syst. Sci. Discuss.: 8 February 2007 Revised: 8 June 2007 – Accepted: 20 June 2007 – Published: 3 July 2007
Abstract. In flood modelling, many one-dimensional (1-D)
hydrodynamic models are too restricted in capturing the spa-tial differentiation of processes within a polder or system of polders and two-dimensional (2-D) models are very demand-ing in data requirements and computational resources. The latter is an important consideration when uncertainty anal-yses using the Monte Carlo techniques are to complement the modelling exercises. This paper describes the develop-ment of a quasi-2-D modeling approach, which still calcu-lates the dynamic wave in 1-D but the discretisation of the computational units are in 2-D, allowing a better spatial rep-resentation of the flow in polders and avoiding large addi-tional expenditure on data pre-processing and computaaddi-tional time. The model DYNHYD (1-D hydrodynamics) from the WASP5 modeling package was used as a basis for the simu-lations and extended to incorporate the quasi-2-D approach. A local sensitivity analysis shows the sensitivity of parame-ters and boundary conditions on the filling volume of polders and capping of the peak discharge in the main river system. Two flood events on the Elbe River, Germany were used to calibrate and test the model. The results show a good cap-ping effect on the flood peak by the proposed systems. The effect of capping reduces as the flood wave propagates down stream from the polders (up to 0.5 cm of capping is decreased for each additional kilometer from the polder).
1 Introduction
Polders are effective measures for capping the flood peak and reducing flood risk. After the extreme flood event in 2002 along the Elbe River, it was realized that flood and flood risk management needed to be revamped for this
Correspondence to: K.-E. Lindenschmidt
river basin (Petrow et al., 2006) and other basins in Ger-many. This has given impetus for large research activi-ties at the national level, e.g. RIMAX, a consortium of projects in Germany to risk management of extreme flood events, launched by the Germany Ministry of Education and Research (www.rimax-hochwasser.de). Of the approxi-mately 40 projects launched, three are focused on improving flood management strategies using polders. Polder control is also a consideration in the EU funded project FLOOD-site (www.floodFLOOD-site.net) on integrated flood risk analysis and management methodologies.
Several polder systems have also been suggested for con-struction along the middle reaches of the Elbe River (IWK, 2004) to minimize flood risk potential. In this study, it is aimed to analyze how effective some of these suggested polder systems are in capping flood discharges and how much this capping effect recedes as the flood wave propa-gates downstream from the polders. Also investigated is the impact of upstream dyke breaching on the discharge capping potential of the polder systems.
To simulate and predict the capping effects by polder sys-tems during flood events, an array of models of varying com-plexity levels may be used. Following a categorization in the number of spatial dimensions, simulations are often car-ried out using one-dimensional (1-D) or two-dimensional (2-D) models. 1-D hydrodynamic models often solve the St.Venant full dynamic wave equations with respect to both momentum and mass continuity of water transport through a meshed system. 2-D models are often based on shallow wa-ter equations, which are hyperbolic partial differential equa-tions describing water motion (for examples, see Telemac-2-D by Galland et al. (1991) and MIKE21 by DHI (1994)). A combination of both 1-D and 2-D approaches have also been used in which the flow in the main river channel is solved in 1-D and the overbank inundated areas are solved in 2-D using the diffusive wave equation or storage cells (for
(a) (b) Cell 1 river floodplain & Cell 2 Cell 3 Cell 4 Cell 5 (c) (d)
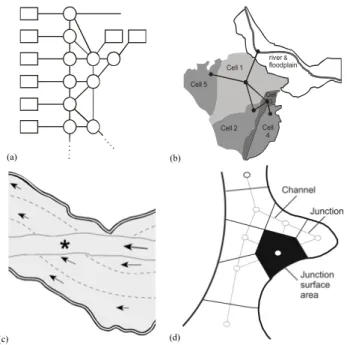
Fig. 1. Examples of quasi-2-D modelling approaches: (a) a portion
of the Mekong Delta model with cells (circles) and boundary condi-tions (rectangles) (Cunge, 1975), (b) extended floodplain of the Po River with five cells (Aureli et al., 2006), (c) floodplain discretised as streamtubes between dashed lines with mixing occurring in the main channel (indicated by *) (Asselmann and van Wijngaarden, 2002) and (d) 1-D hydrodynamic channel-junction network allow-ing a 2-D spatial representation of inundated areas (Ambrose et al., 1993).
examples, see LISFLOOD-FD by Bates and De Roo (2000) and another model by Blad´e et al. (1994)). 2-D and 1-D/2-D combination models are generally computationally more expensive and have more requirements on input data and pre-processing than 1-D models. This is particularly a con-cern when automated methods for parameter optimization or Monte-Carlo methods for uncertainty analysis are to be im-plemented. However, 1-D models are not sufficient in de-scribing the spatial variability of water depths, velocities and flows in floodplains, polders and other overbanked inundated areas during flood events. This is important for subsequent sediment and solute transport modeling in the river-polder system.
In this study, a quasi-2-D approach is sought in which a 1-D hydrodynamic model is used that allows the discretisation to be extended into the polder system to give a 2-D represen-tation of the inundation area. This would fulfill the following objectives:
1. attain faster computations than using full 2-D or 1-D/2-D combination models to better adapt polder control strategies to the flood wave characteristics during op-erational flood management;
2. allow future simulations of spatially distributed sedi-ment and contaminant deposition during flood events; 3. provide faster computations to better suit uncertainty
analyses using Monte Carlo techniques.
Several examples of quasi-2-D approaches are shown in Fig. 1 and have been presented in Lindenschmidt (accepted). One of the first and few applications using this approach was modeling the flood propagation through the Mekong River Delta (Cunge, 1975). Aureli et al. (2006) have used a quasi-2-D numerical approach by adapting the hydrody-namic model Mike 11 (DHI, 1992) for inundated areas en-closed by levees. The models were, however, not adapted for subsequent solute transport modeling. Asselmann and van Wijngaarden (2002) schematised their floodplains using par-allel steam tubes, each with its own sediment settling charac-teristics. The drawback to this approach is that the discharge through the different stream tubes must be derived from full-2-D model computations. The channel-junction network in the 1-D hydrodynamic model DYNHYD allows the discreti-sation to be extended into the floodplain giving a 2-D repre-sentation of the inundation area. Sediment transport is simu-lated using water quality model TOXI. Both DYNHYD and TOXI belonging to the WASP5 (Water quality Analysis Sim-ulation Program) package developed by the U.S. Environ-mental Protection Agency (Ambrose et al., 1993). This is the approach used in this study and has already been suc-cessfully implemented for modelling an inundated hinterland area due to dyke breaching (Huang et al., 2007). The authors also compared their results with those from a 2-D storage cell model of the same dyke breach area (Vorogushyn et al., 2007) and found good agreement between the two models.
The aim of the paper is two-fold: i) show the applicabil-ity of the quasi-2-D approach for river-polder modeling and ii) illustrate the effectiveness of proposed polders along the middle reach of the Elbe River in Germany in capping the peak discharge of an extreme flood event.
2 Methods
2.1 Hydrodynamic model DYNHYD
In this study, the quasi-2-D approach can be realized with the model DYNHYD, which is part of the WASP5 (Water Quality Analysis Simulation Program) package developed by the U.S. Environmental Protection Agency (Ambrose et al., 1993). DYNHYD solves the 1-D equation of continuity and momentum for a branching or channel-junction (link-node) computational network. The channels calculate the transport of water using the equations of motion:
∂U ∂t = −U
∂U
where af is the frictional acceleration, agis the gravitational
acceleration along the longitudinal axis x, U is the mean ve-locity, ∂U/∂tis the local inertia term or the velocity rate of change with respect to time t and U ∂U/∂x is the convective inertia term or the rate of momentum change by mass trans-fer. The junctions calculate the storage of water described by the continuity equation:
∂H ∂t = 1 B × ∂Q ∂x (2)
where B is the channel width, H is the water surface ele-vation (head), ∂H /∂t is the rate of water surface eleele-vation change with respect to time t , and ∂Q/∂x is the rate of water volume change with respect to distance x. The discharge Q is additionally related to river morphology and bottom rough-ness using Manning’s equation:
Q = r 2/3 H ×A n r ∂H ∂x (3)
where A is the cross-sectional area of the water flow, n is the roughness coefficient of the river bed, rH is the hydraulic
radius and ∂H /∂x is the slope of the free water surface in the longitudinal direction x. Discharge over a weir is calculated by the weir equation:
Q = α × b × h1.5 (4)
where α is the weir coefficient, b is the weir breadth and h is the depth between the upstream water level and the weir crest. Back water effects are computed by throttling the weir discharge when the water level on the flow-receiving side of the weir rises above the weir crest (Chow, 1973).
2.2 Adaptations to DYNYHD for modelling flow through polders
Although the equation of motion and continuity are imple-mented in the model for a 1-D framework, the channel-junction methodology allows the channels to be linked to several junctions, permitting a 2-D spatial representation of the discretisation network. Due to the condition of water continuity and stability requirements water levels in the dis-cretisation elements cannot fall dry, hence an extension to the model was implemented to capture the flooding and empty-ing of the polder durempty-ing a flood simulation. In this algorithm the inlet and outlet discharges of a polder are controlled by a “virtual” weir. During low flow, when the polder system is not in use, a small amount of water is allowed to leak through the weir from the river into the polder. It can pre-vent the discretised elements representing the polder from becoming dry. This volume is very minute (1% of total fill-ing capacity of the polders) so that the error in the simula-tions is insignificant. To simulate the control of polders, the weir is opened by lowering the weir crest to the level of the hinterland ground level. The opening is not abrupt but done successively over a time period of up to 12 h to simulate the
stage gage discharge gage state boundary river retention area proposed polders urban areas km Pretzsch Lutherstadt Wittenberg Torgau Loeben
Fig. 2. Variants of polders that have been proposed to be constructed
along the middle reach of the Elbe River in Germany between Tor-gau and Lutherstadt Wittenberg (source: IWK, 2004).
weir control process. This algorithm has already been im-plemented successfully for floodplains (see Lindenschmidt et al., 2006) and dyke breach areas (see Huang et al., 2007).
3 Study site and model setup
The study site is the middle course of the Elbe River in Germany between the gages at Torgau and Wittenberg (see Fig. 2). This stretch of the river is heavily modified with dykes running along both sides for most of the flow dis-tance. The construction of polders along this stretch has been proposed and is in the planning stages. An evalua-tion of the efficiency of the polders is a motivaevalua-tion of this work. Characteristics of the discharges recorded at the gages at Torgau (Elbe-km 154.2) and Wittenberg (Elbe-km 214.1) are given in Table 1. Along this stretch one major tribu-tary, Schwarze Elster, flows into the Elbe River at Elbe-km 199. High water level markers and the water level readings from the gage at Pretzsch (at Elbe-km 184.5) and Witten-berg (Elbe-km 214.1) were used to compare measurements with hydrodynamic simulations. Model calibration was car-ried out with data from the flood event in January 2003 in which dyke breaching did not occur within this stretch of the river. The more severe flood from August 2002 was modeled
Table 1. Discharge statistics for the gages at Torgau and Lutherstadt Wittenberg (MQ – mean discharge, MHQ – mean maximum annual
flood, HQ – highest recorded flood event); source: Gew¨asserk¨undliches Jahrbuch, Elbegebiet Teil 1, 2003. Note the lower discharge recorded at Lutherstadt Wittenberg than Torgau due to water retention in the flood plains between Pretzsch and Lutherstadt Wittenberg (see Fig. 2) and three dyke breaches between Torgau and Pretzsch.
Discharge (m3/s)
Gage Elbe-km Series MQ MHQ HQ (date)
Torgau 154.2 1936–2003 344 1420 4420 (18.08.2002) L. Wittenberg 214.1 1961–2003 369 1410 4120 (18.08.2002) Junction Channel Weir Flow direction E F G H I J K h i f1 f2 g Schwarze Elster Elbe Polder P1 Polder P3 Polder P4 Torgau Elbe-km 154.2 Pretzsch Elbe-km 184.5 Loeben Wittenberg Elbe-km 254.2 e j
E, F...K Location along river e, f1, f2, g...i Location in polders
0 1 2 3 Kilometers Legend
Inundation due to dyke breach
±
Fig. 3. The study area of polders with the discretisation by junctions and channels and a possible inundated hinterland.
to simulate the capping effect by polder systems on the peak discharge. Of the polders suggested for construction three are simulated in this study. The discretisation of channels and junctions with inlet and outlet weirs for the modeled polders is shown in Fig. 3. The river is also discretised with channels, each 500 m in length, and junctions corresponding to the wa-ter volumes in the channels. Table 2 shows geometrical
char-acteristics of the polders for maximum filling. The total wa-ter volumes that can be retained if all polders are in operation are 142 million m3. Polder P1 and P3 constitute a polder sys-tem connected by a gate between them. This polder syssys-tem can retain water up to a depth of 3 m. The downstream polder P4 has a smaller water capacity with a maximum filling depth of 1.4 m. Figure 3 also shows a possible inundated area due
Table 2. Morphological characteristics of polders P1, P3 and P4.
Polder Surface area Volume Head Depth
(km2) (106m3) (m a.s.l.) (m)
P1 24.5 85 77.5 3.3
P3 8.2 20 75.3 2.3
P4 25.1 37 72.6 1.4
to dyke breaching (Huang et al., 2007) which was included in this study to show the effects of upstream dyke breaching on peak discharge capping of the polders.
3.1 Input data
The model of the river reach was set up on the basis of cross-sectional profiles available every 500 m along the river from which initial hydraulic radii and segment water vol-umes were derived. The time frame of the modeled flow event is 3–11 January 2003 for the calibration and 12–23 August 2002 for the simulation with polder flooding. Daily discharge recordings from the gages at Torgau, Loeben and Wittenberg were used as boundary conditions for the hydro-dynamic model. Discharge and water level data were also available from these gages on a daily basis. Water level read-ings from Pretzsch, which have a higher temporal resolution (every 15 min), were also utilized. A longitudinal profile of the maximum water level attained during the floods comple-mented the data used for calibrating and testing of the hy-drodynamic model. The simulation results are output on an hourly time step.
3.2 Polder control strategy
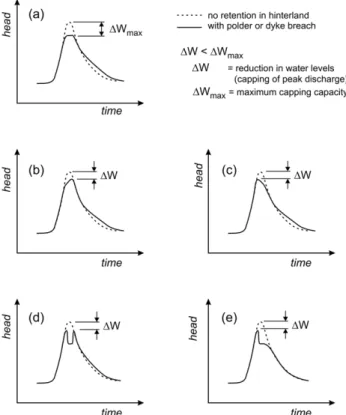
Figure 4 shows theoretically the strategy taken in optimising the filling of the polder system for maximum peak discharge capping. Two important objectives to attain the highest cap-ping potential is i) insure that the drop in the water level re-mains constant throughout the filling process of the polders (Fig. 4a) and ii) fill the polder to its maximum capacity. This can be achieved by regulating the flow into the polder which requires careful control of the opening and closing times and durations of the inlet gates. If these times are not optimised, then the polder will start filling too soon or too late (Figs. 4b and c, respectively) and maximum capping is not achieved. Uncontrolled and very rapid flood water diversion from the main channel into the hinterland, as is the case with dyke breaching (Figs. 4d and e), also does not reduce the discharge peak to the degree that is possible with controlled flood reten-tion. The model was run several times with different open-ing and closopen-ing times of the gates, consideropen-ing also the time duration of opening and closing, until the optimum strategy was obtained. Figure 5 shows the control strategy for polder flooding emptying for optimum capping of the flood
hydro-Fig. 4. Theoretical depiction of the strategy for optimising the
con-trol of the polder filling to its maximum capacity in order to attain maximum capping of the peak discharge of a river’s flood hydro-graph. In (a), the times and duration of opening and closing the inlet polder gates are optimised to attain the largest peak discharge capping. The inlet gate is opened too soon in (b) and too late in (c), which in both cases diminishes the capping potential of the polder. Flood water diversion through a dyke breach into a contained hin-terland area (d) or into an area of unlimited retention capacity (e) also results in less than optimal capping of the discharge peak.
graph. All gates are initially closed. The gate at Location e is opened first to begin capping of the peak discharge in the river. The gate at h is opened shortly after at the beginning of simulation day 5 to divert flood water into Polder P4. Shortly thereafter, the gate connecting polders P1 and P3 (Location f2) is opened. This gate is also the first to close (during Day 6), since the volume capacity of P3 is relatively small and fills up quickly. Both inlet gates of polders P1 and P4 are closed during Day 7. Emptying of all three polders commences on Day 9 by opening the gates at f 2, g and i.
3.3 Local sensitivity analysis
A sensitivity analysis was carried out to check the response of the system to state variables by varying different param-eters. The parameters which were analyzed in this model include:
1. Weir coefficient α or weir breadth b from the weir dis-charge equation. Only α is used since the sensitivity of
Fig. 5. Optimum control strategy for polder flooding and emptying
to cap the peak discharge in the river.
α is analogous to b− the two are multiplicative factors in the equation.
2. Roughness coefficient n of the channel bed from Man-ning’s equation
3. Percentage deviations in the discharge boundary condi-tions q at the Torgau, Loeben and Wittenberg gages. The state variables investigated are the water volume in the polders and the heads in the river channels. A base simu-lation derived from model calibration or testing was first run with the result Obase, which is used as a base parameter value.
After this base run, the parameters were decreased by 10% separately for each single run to obtain the results Ox. The
percentage changes in peak discharge capping in the river and the water volume in the flooded polders were used to quantify the local sensitivity of the input parameters: Percentagechange=
Ox−Obase
Obase
×100 (5)
A negative percentage change indicates a reduction in the output values. In polders, the percentage change of water volume also equates to the percentage change in the water level since the surface area of the polder Apolderused to
cal-culate volumes cancel out: 1V Vbase = 1h hbase ×Apolder Apolder = 1h hbase (6)
4 Results and discussion
4.1 Model calibration (January 2003 flood)
The model was first calibrated on the basis of the January 2003 flood event. Figure 6 provides the measured and
simu-Fig. 6. Longitudinal profiles of the simulated and recorded
val-ues of the highest water levels attained along the course of the Elbe River between Torgau and Wittenberg during the January 2003 flood event.
lated longitudinal profiles of the maximum water levels at-tained during the flood for the entire modeled stretch be-tween Torgau and Wittenberg. The simulation agrees well with the recorded values. The Manning’s roughness coeffi-cient between 0.030 to 0.035 s/m1/3 provided the best fit of the simulations to the data. The water levels recorded at the gage at Pretzsch and Wittenberg provided temporal data for a comparison between measurements and simulations results and they also show good agreement between each other (see Fig. 7). However, for the first two days there is a 30∼40 cm overestimation of the model at the start of the rising limb in both flood events. The smaller the water discharge is, the greater the error becomes. This overestimation has been observed in other modeling studies of the same river reach (Vorogushyn et al., 2007) and is due to the model being cal-ibrated to better fit the peak discharge. Varying the rough-ness coefficients during the flood to reflect the dependency of bottom roughness with flood water depth and extent may alleviate this problem and is a subject of future work. Man-nings roughness coefficient is a relative hydraulic roughness term related to geometrical properties of the river’s cross-section. Factoring out one of these properties, such as the hydraulic radius, to obtain an absolute roughness coefficient may provide a remedy for the problem of varying roughness values at different discharge. Another option is the use of the non-dimensional coefficients to characterize the rough-ness characteristics. These coefficients can be functions of the absolute roughness coefficient (sensu Nicuradse) or non-dimentional parameters, such as the Reynolds number (sensu Blasius) (see Bollrich, 2000, pp. 177–182).
4.2 Model testing (August 2002 flood)
We refer to model testing because it is difficult to validate the model for three reasons:
1. Data was not available from other floods that were more extreme than the floods of January 2003 and August 2002.
Fig. 7. Simulated and gage recordings of the water level at Pretzsch
and Wittbenberg during the January 2003 flood event.
Fig. 8. Longitudinal profiles of the simulated and recorded values of
the highest water levels attained along the course of the Elbe River between Torgau and Wittenberg during the August 2002 flood event.
2. A true validation of the model is not possible because each flood event has its own characteristics pertaining to flood depths and extent within the river-floodplain system which in turn affects the values for the bottom roughness. The roughness coefficient must be “fine-tuned” for each flood event to capture the distinct flow characteristics of the flood.
3. Dyke breaching occurs for the most extreme events and data on the water volumes diverted from the river to the hinterland are not available.
Hence, we perform a model testing, in which the calibrated model is transferred to the more severe August 2002 flood event, and the roughness coefficient is “fine-tuned” to depict the discharge behavior of the flood.
Figures 8 and 9 are the results using the boundary con-dition data from the flood event in August 2002. Using
Fig. 9. Simulated and gage recordings of the water level at Pretzsch
and Wittenberg during the August 2002 flood event.
roughness coefficients for the main channel between 0.038 and 0.040 s/m1/3, the simulated head matches the maximum measured water levels quite well. At the gages at Pretzsch and Wittenberg, the simulated hydrographs have a good fit to the gage readings especially after the second simulation day. The overestimation at the beginning is due to the same rea-sons as stated above for the calibration of the January 2003 flood.
4.3 Peak discharge and water level capping (August 2002 flood)
To show the potential of peak discharge capping of the dif-ferent polder systems, several simulations were carried out. Firstly, the two polder systems P1+P3 and P4 were inundated separately to see the capping effect by each system. From the design point of view, the influence of weir breadth was also considered. Figures 10 and 11 shows the results of polder system P1+P3 with weir breadths of 100 and 50 m respec-tively. It is found that the capping effects are almost the same in both conditions, about 33 and 32 cm respectively in the re-duction in the peak water levels in the river. In addition, the narrower the weir breadth is, the longer it takes to fill the polder and capping occurs slower over a more extended pe-riod of time. Under both conditions, the capping effect tends to recede along the river. From the location I , J and K along the river, a distance of 20 km, the degree of capping with weir breadth of 100 m decreases from 32 cm at I to 29 cm and 25 cm at J and K, respectively. Hence, the capping effect recedes by approximately 0.35 cm per river km downstream
Fig. 10. Water levels in the river and polder system P1+P3 with the
weir breadth of 100 m. See Fig. 3 for river locations E to K.
Fig. 11. Water levels in the river and polder system P1+P3 with the
weir breadth of 50 m. See Fig. 3 for river locations E to K.
from the polder system. This is due to the widening of the floodplain in the downstream half of the studied reach (see Fig. 2).
Fig. 12. Velocity vectors during filling (top) and emptying (bottom)
of the P1+P3 polder system. The longest vector corresponds to a magnitude of 1.2 m/s.
It is interesting to compare these results with another study of the same polder system (F¨orster et al., 2006), in which a full 2-D model MIKE 21 (DHI, 1994) was used to simulate flow in the polders. The behavior of capping is similar to our model results, however the degree of capping is somewhat less (maximum of 20 cm) due to the smaller surface area and shallower filling level used for polder P1. This may also be due to the rapid inflow into the polders which in actuality simulates a dyke breach rather than a controlled polder filling (compare Fig. 4d).
Figure 12 shows the velocity fields of the water currents in the polders P1 and P3 for two time frames, one represent-ing fillrepresent-ing of the polder system on simulation day 5.25 (6th hour of the 5th day) and another representing emptying on simulation day 9.5 (12th hour of the 9th day). The distinct differences in the magnitudes and directions of the velocity vectors proves the efficacy of the quasi-2-D approach in cap-turing the spatial differentiation in flow characteristics, even though the model solves the equations in one dimensional form.
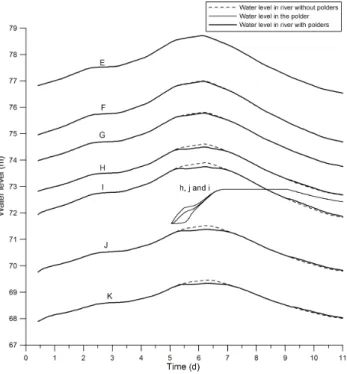
Fig. 13. Water levels in the river and P4 when only P4 is used for
flood water diversion. See Fig. 3 for river locations E to K.
Since the extent of capping is almost independent of weir width and the time for polder filling and hydrograph capping are acceptable for the narrower weir breadths, the subsequent simulations are based on weir widths of 50 m. Figure 13 shows the water level hydrographs using only polder P4 for discharge diversion. Due to its smaller water volume ca-pacity according to the suggested design specifications, this polder has much less capping potential (maximum 12 cm) than the polder system P1+P3. The capping at the locations I , J , K are about 15 cm, 14 cm and 12 cm respectively. For P4, capping recession is approximately 0.15 cm/river km.
When both polder systems are inundated during this flood event, the capping effect increases to a maximum of 44 cm (see Fig. 14), which is 6% less than the summation of cap-ping by each polder system considered separately. This co-incides with results obtained by De Roo (2003), who studied polders on the Oder River and calculated 15% less capping using the total polder system compared to the summation of capping of each polder considered separately. The reason is that polder P4 needs somewhat more time to fill due to the influence of polder P1+P3. The capping recession using all polders for flood water recession is 0.5 cm/river km. 4.4 Effect of upstream dyke breaching in polder discharge
capping
The influence of upstream dyke breach on the effectiveness of peak discharge capping by the polders was also consid-ered. Due to the dyke breach, the water levels at each river
Fig. 14. Water levels in the river, P1+P3 and P4. See Fig. 3 for river
locations E to K.
section are about 10 cm less than those without dyke breach-ing. However as long as both polder systems can be com-pletely filled, the capping effects are not influenced. The filling times were extended but not substantially (about 2 h). With the influence of dyke breaching and polder flood water retention, the water levels at Wittenberg can be as much as 50 cm lower for this extreme flood event. Hence, this system is very operational when extreme flooding occurs.
4.5 Local sensitivity analysis
All of the parameters were decreased separately by 10% keeping the opening and closing time points of all the polder gates fixed. The control strategy is based on the calibration and testing of the model using all three polders and the opti-mal use of the capacity of the polders. Hence, only a decrease in the parameters was considered, whereby the water volume entering the polders is less but the capping capacity does not exceed its maximum potential. Changing the opening and closing times of the gates could then be avoided by which the influence of each parameter on the polder filling and hydro-graph capping volumes could be compared. Figure 15 gives the percentage of water volume reduction in each polder. The most sensitive parameter in P1 and P4 is the boundary condi-tion deviacondi-tion q and the least sensitive is the weir discharge coefficient α. It is obvious that the roughness coefficient n is much more sensitive in P4 than in P1 due to its proximity further downstream from the upper boundary at Torgau. The parameter effects on the water volumes for P3 are different
Fig. 15. Percentage in volume reduction in each polder system by
decreasing each parameter 10%.
than those of P1 and P4. Since the inlet to this polder is not directly connected to the river channel and its filling is con-trolled by the upstream polder P1, it is less dependent on the characteristics of the river itself but more directly on the inlet discharge (hence α).
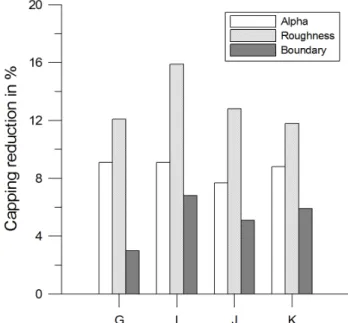
With the reduction of water volume in polder systems, the capping effects reduce as well (see Fig. 16). The percentages of capping reduction by α remain relatively constant at about 10% throughout the length of the river. The roughness co-efficient and boundary deviation is more dependent on how much capping occurs. More capping (e.g. at location I from all polders compared to location G for only P1+P3) leads to larger percentages in capping reduction. The deviation in the boundary condition leads to less water volume in pold-ers, but more capping of the discharge hydrograph (referring to a smaller effect on capping reduction than roughness) due to the change in the shape of the input hydrograph. This is because the time of opening the gate of the polder inlet is a little earlier in the condition of varying roughness leading to a less effective capping of the peak discharge in the river. Generally, the opening time of the polder system is crucial in achieve the maximum capping effect and this time point is highly dependent on the characteristics of each flood, which is also confirmed by Hesselink et al. (2003).
5 Conclusions
Quasi-2-D modeling is a powerful tool for both provision and operational management of floods due to its robustness, ease of use and computational efficiency. For operational flood management, careful monitoring of dyke breaching is
essen-Fig. 16. Percentage in capping reduction (on water level) along the
river by decreasing each parameter 10%. The capping reduction is compared to the initial capping reduction.
tial to obtain an optimal capping potential by the polder sys-tems. The polder systems can cap the flood peak effectively and this capping is relatively stable along the river down-stream. Between the two suggested systems, polder system P1+P3 is more effective in capping capability and risk pre-vention. The timing of opening the polder gates for flood water diversion is crucial for an optimal capping of the peak discharge and it is highly dependent on the discharge condi-tions. Incorporating a variation of the roughness coefficient with the water level would provide a better fit of the sim-ulated heads with measures throughout the flood event, not just in the vicinity of the peak discharge. This is a subject of future work. The effect of different hydrograph characteris-tics (type and shape) on the operation and control strategy of the polders is also a topic of subsequent study.
Edited by: H. Bormann
References
Ambrose, R. B., Wool, T. A., and Martin, J. L.: The water qual-ity simulation program, WASP5: model theory, user’s manual, and programmer’s guide, U.S. Environmental Protection Agency, Athens, GA, http://www.epa.gov/ceampubl/swater/wasp/, 1993. Asselman, N. E. M. and Van Wijngaarden, M.: Development and
application of a 1-D floodplain sedimentation model for the River Rhine in the Netherlands, J. Hydrol., 268, 127–142, 2002. Aureli, A., Maranzoni, A., Mignosa, P., and Ziveri, C.: Flood
haz-ard mapping by means of fully-2-D and quasi-2-D numerical modeling: a case study, in: Floods, from defence to management, edited by: van Alphen, J., van Beek, E., and Taal, M., 3rd
Iinter-national Symposium on Flood Defence, Nijmegen, Netherlands, Taylor & Francis/Balkema, Blain, ISBN 0415391199, pp. 373– 382, 2006.
Bates, P. D. and De Roo, A. P. J.: A simple raster-based model for floodplain inundation, J. Hydrol., 236, 54–77, 2000.
Blad´e, E., G´omez, M., and Dolz, J.: Quasi-two dimensional mod-elling of flood routing in rivers and flood plains by means of stor-age cells, in: Modelling of flood propagation over initially dry areas, edited by: Molinaro, P. and Natale, L., American Society of Civel Engineers, 1994.
Bollrich, G.: Technische Hydromechanik, Volume 1, 5th Edition, Verlag Bauwesen, Berlin, 456 pp., 2000.
Chow, V. T.: Open channel hydraulics, Mc Graw Hill, 680 pp., 1973.
Cunge, J. A.: Two-dimensional modeling of floodplains, in: Un-steady flow in open channels, edited by: Mahood, K. and Yev-jevich, V., Vol. 2, Water Resources Publications, Fort Collins, Colorado, USA, pp. 705–762, 1975.
De Roo, A.: The simulation of two polders for flood protection in the German part of the Oder catchment. European Communities, EUR 20739 EN, Joint Research Centre, Ispra, Italy, 2003. DHI: MIKE 11 user manual, Danish Hydraulic Institute, Denmark,
1992.
DHI: MIKE21 user guide and reference manual, Danish Hydraulic Institute, Denmark, 1994.
F¨orster, S., Chatterjee, C., and Bronstert, A.: Hochwasser¨uber-flutungssimulation mittels hydrodynamischer Modellierung f¨ur das Management eines potentiellen Polder-standortes an der Mittleren Elbe, Robert J¨upner (Hrsg.), Beitr¨age zur Konferenz “Strategien und Instrumente zur Verbesserung des vorbeugenden Hochwasserschutzes”, 23–25 November 2006, Tangerm¨unde, Shaker Verlag, Band 6, pp. 83–92, 2006.
Galland, J. C., Goutal, N., and Hervouet, J.-M.: TELEMAC – a new numerical-model for solving shallow-water equations, Adv. Water Resour., 14(3), 138–148, 1991.
Hesselink, A. W., Stelling, G. S., Kwadijk, J. C. J., and Middelkoop, H.: Inundation of a Dutch river polder, sensitivity analysis of a physically based inundation model using historic data, Water Resour. Res., 39(9), 1234, doi:10.1029/2002WR001334, 2003. Huang, S., Vorogushyn, S., and Lindenschmidt, K.-E.: Quasi 2-D
hydrodynamic modelling of the flooded hinterland due to dyke breaching on the Elbe River, Adv. Geosci., 11, 21–29, 2007, http://www.adv-geosci.net/11/21/2007/.
IWK: Untersuchung von Hochwasserretentionsmaßnahmen entlang der Elbe im Bereich der Landkreis Wittenberg und Anhalt-Zerbst (Kurzfassung), Institute f¨ur Wasserbau und Kulturtechnik. Uni-versit¨at Karlsruhe, 2004.
Lindenschmidt, K.-E.: Quasi-2-D approach in modelling the trans-port of contaminated sediments in floodplains during river flood-ing – model couplflood-ing and uncertainty analysis, Environ. Eng. Sci., accepted, 2007.
Lindenschmidt, K.-E., Rauberg, J., and Hohmann, R.: Stofftrans-port im Fluss- und Auenbereich bei Hochwasser: Quasi-2-D hy-drodynamische Simulation und Unsicherheitsanalyse, Gas- und Wasserfach: Wasser und Abwasser, 147(11), 720–729, 2006. Petrow, T., Thieken, A. H., Kreibich, H., Bahlburg, C. H., and Merz,
B.: Improvements on flood alleviation in Germany: lessons learned from the Elbe flood in August 2002, Environ. Manage., 38, 717–732, 2006.
Vorogushyn, S., Apel, H., Lindenschmidt, K.-E., and Merz, B.: Coupling 1-D hydrodynamic, dike beach and inundation models for large-scale flood risk assessment along the Elbe River, Pro-ceedings for 7th International Conference on Hydroinformatics HIC 2006, Nice, France, 4–8 September 2006, Research Pub-lishing Services, ISBN 81-903170-2-4, pp. 481–488, 2007.