HAL Id: hal-00305126
https://hal.archives-ouvertes.fr/hal-00305126
Submitted on 31 Jan 2008
HAL is a multi-disciplinary open access
archive for the deposit and dissemination of
sci-entific research documents, whether they are
pub-lished or not. The documents may come from
teaching and research institutions in France or
abroad, or from public or private research centers.
L’archive ouverte pluridisciplinaire HAL, est
destinée au dépôt et à la diffusion de documents
scientifiques de niveau recherche, publiés ou non,
émanant des établissements d’enseignement et de
recherche français ou étrangers, des laboratoires
publics ou privés.
River Meuse over the late Holocene: impacts of
long-term anthropogenic land use change and climate
variability
P. J. Ward, H. Renssen, J. C. J. H. Aerts, R. T. van Balen, J. Vandenberghe
To cite this version:
P. J. Ward, H. Renssen, J. C. J. H. Aerts, R. T. van Balen, J. Vandenberghe. Strong increases in flood
frequency and discharge of the River Meuse over the late Holocene: impacts of long-term anthropogenic
land use change and climate variability. Hydrology and Earth System Sciences Discussions, European
Geosciences Union, 2008, 12 (1), pp.159-175. �hal-00305126�
www.hydrol-earth-syst-sci.net/12/159/2008/ © Author(s) 2008. This work is licensed under a Creative Commons License.
Earth System
Sciences
Strong increases in flood frequency and discharge of the River
Meuse over the late Holocene: impacts of long-term anthropogenic
land use change and climate variability
P. J. Ward1, H. Renssen1, J. C. J. H. Aerts2, R. T. van Balen1, and J. Vandenberghe1
1Institute of Earth Sciences, Faculty of Earth and Life Sciences, VU University Amsterdam, De Boelelaan 1085, 1081 HV
Amsterdam, The Netherlands
2Institute for Environmental Studies, Faculty of Earth and Life Sciences, VU University Amsterdam, De Boelelaan 1085,
1081 HV Amsterdam, The Netherlands
Received: 1 August 2007 – Published in Hydrol. Earth Syst. Sci. Discuss.: 6 August 2007 Revised: 6 December 2007 – Accepted: 3 January 2008 – Published: 31 January 2008
Abstract. In recent years the frequency of high-flow events
on the Meuse (northwest Europe) has been relatively great, and flooding has become a major research theme. To date, re-search has focused on observed discharge records of the last century and simulations of the coming century. However, it is difficult to delineate changes caused by human activities (land use change and greenhouse gas emissions) and natu-ral fluctuations on these timescales. To address this problem we coupled a climate model (ECBilt-CLIO-VECODE) and a hydrological model (STREAM) to simulate daily Meuse discharge in two time-slices: 4000–3000 BP (natural sit-uation), and 1000–2000 AD (includes anthropogenic influ-ence). For 4000–3000 BP the basin is assumed to be almost fully forested; for 1000–2000 AD we reconstructed land use based on historical sources. For 1000–2000 AD the simu-lated mean annual discharge (260.9 m3s−1) is significantly higher than for 4000–3000 BP (244.8 m3s−1), and the fre-quency of large high-flow events (discharge >3000 m3s−1) is higher (recurrence time decreases from 77 to 65 years). On a millennial timescale almost all of this increase can be ascribed to land use changes (especially deforestation); the effects of climatic change are insignificant. For the 20th Cen-tury, the simulated mean discharge (270.0 m3s−1) is higher than in any other century studied, and is ca. 2.5% higher than in the 19th Century (despite an increase in evapotranspira-tion). Furthermore, the recurrence time of large high-flow events is almost twice as short as under natural conditions (recurrence time decreases from 77 to 40 years). On this timescale climate change (strong increase in annual and win-ter precipitation) overwhelmed land use change as the domi-nant forcing mechanism.
Correspondence to: P. J. Ward
1 Introduction
In recent years the frequency of high-flow events in the Meuse basin (northwest Europe) (Fig. 1) has been relatively great compared to the rest of the 20th Century. As a sult, flooding and flood mitigation have become major re-search themes. Hence, numerous studies have been carried out to examine hydrological and climatological changes in the basin.
Observed discharge time-series for the Meuse at Borgharen (Fig. 1) show no significant changes in annual or monthly mean discharge over the 20th Century (Tu, 2006). However, increasing trends (albeit statistically insignificant) are detected for annual and winter maximum daily discharge (De Wit et al., 2001). Furthermore, change-point analyses suggest significant increases in annual and winter maximum daily discharge around 1984 (Pfister et al., 2000; Tu, 2006). Similar results are found for numerous Meuse tributaries (Tu, 2006). This increase in the frequency of high-flow events may be related to an increase in annual precipitation totals and the frequency of very wet days in the winter since 1980, due to the fluctuation of large-scale atmospheric circulation (Bouwer et al., 2006) and a strengthened North Atlantic Os-cillation (Tu, 2006). Increased precipitation totals and inten-sity in the second half of the 20th Century, related to varia-tions in atmospheric circulation, have been observed in the Netherlands and Luxembourg (Pfister et al., 2000).
Climate modelling results suggest that average tempera-tures and winter precipitation depths in the Meuse basin will increase in the 21st Century, whilst summer precipitation will decrease (De Wit et al., 2007; Kwadijk and Rotmans, 1995; Pfister et al., 2004; Van Deursen, 2000). Based on hydrologi-cal modelling, De Wit et al. (2001) suggest that mean annual discharge will remain relatively stable over the 21st Century, whilst Booij (2005) suggests a slight decrease. The seasonal
# # # # # # # # # # # # ! ! ! ! Luxembourg The Netherlands Germany France Belgium Stah Namur Chooz Membre Stenay Tabreux Gendron Treignes Meerssen Borgharen Chauvency-le-Château Martinrive Cuijk Liège Rotterdam Maastricht 3°0'0"E 4°0'0"E 4°0'0"E 5°0'0"E 5°0'0"E 6°0'0"E 6°0'0"E 4 8 °0 '0 "N 4 8 °0 '0 "N 4 9 °0 '0 "N 4 9 °0 '0 "N 5 0 °0 '0 "N 5 0 °0 '0 "N 5 1 °0 '0 "N 5 1 °0 '0 "N 5 2 °0 '0 "N
# Discharge measuring station
0 20 40 80
km
¯
Fig. 1. Map showing the location of the Meuse Basin and discharge
measuring stations used in this study (after RWS Limburg/IWACO, 2000). The basin has an area of ca. 33 000 km2, and covers parts of France, Luxembourg, Belgium, Germany, and the Netherlands. The inset shows the location of the Meuse basin in Europe.
distribution of discharge may change so that winter discharge becomes greater and summer discharge lower (De Wit et al., 2007). These and other studies, however, suggest that the an-ticipated climate change of the 21st Century will lead to an increase in flood frequency (Bultot et al., 1988; Gellens and Roulin, 1998; Middelkoop and Parmet, 1998; Van Deursen, 2000).
Discharge, however, depends not only on climate but also on land use. Little research has been carried out to exam-ine the effects of land use change in the basin because the forested area has remained relatively stable at the basin-scale over the last century (Knol et al., 2004; Tu, 2006). Ashagrie et al. (2006) and Tu (2006) found no evidence to suggest that land use changes in the 20th Century have had a significant effect on Meuse discharge.
The aforementioned studies have examined either the dis-charge changes of the last century, or used hydrological mod-els calibrated against observations for that period. However, when studying long-term discharge changes this approach is problematic. Firstly, accurate daily measurements of Meuse discharge have only been made since 1911, which is too short to evaluate long-term climatic changes (Jones, 2000). Sec-ondly, at a basin-scale the forested area has been relatively stable over the last century, making it difficult to assess the effects of large-scale changes in land use.
Palaeodischarge modelling provides a means to address the lack of long-term observed data by providing a dataset for the validation of model response on millennial timescales. This enables us to simulate the response of discharge to changes in climate over longer timescales, and to more ex-tensive changes in land use. However, palaeodischarge mod-elling is in its infancy. For example, Coe and Harrison (2002) used runoff derived directly from a General Circula-tion Model (GCM), combined with a river routing algorithm, to simulate lake-level changes in Africa at ca. 6 ka BP. At the basin-scale, however, the use of runoff derived directly from GCMs has a disadvantage as runoff output are less well re-solved than climatic output. To address this problem, Aerts et al. (2006) and Ward et al. (2007) coupled a climate model and a hydrological model to simulate the Holocene discharge of 19 rivers around the globe on a monthly time-step; the mod-elled discharges correspond well with multi-proxy records of palaeodischarge.
The aim of this paper is to examine the sensitivity of Meuse discharge to long-term changes in Holocene climate and land use. This is achieved using the modelling approach of Aerts et al. (2006) and Ward et al. (2007), but with a daily time-step and higher spatial resolution. Meuse dis-charge is simulated for two time-slices: 4000–3000 BP and 1000–2000 AD. The period 4000–3000 AD is selected as a natural reference period since the natural climatic forcings were broadly similar to those of today, whilst human in-fluence on land use was minimal (Bunnik, 1995; Gotj´e et al., 1990; RWS Limburg/IWACO, 2000). The period 1000– 2000 AD was heavily influenced by human activities, namely changes in land use throughout the period, and greenhouse gas emissions since the industrial revolution. By compar-ing the changes in discharge characteristics between these two situations we can examine the effects of anthropogenic changes in climate and land use.
2 Study area
The Meuse is a predominantly rain-fed river with a total length of ca. 875 km. For this study the basin has been mod-elled upstream from Borgharen (Fig. 1).
Mean annual precipitation over the basin is ca. 950 mm a−1, and is reasonably evenly distributed throughout the year. The spatial distribution of precipitation
is to a large extent a reflection of elevation and distance from the coast. Mean temperatures show marked seasonal variations, and annual potential evapotranspiration is much greater in the summer half-year (May–October) than in the winter half-year (November–April) (76% and 24% of the total respectively) (Ashagrie et al., 2006). The mean annual discharge of the Meuse and its associated canals at the border of Belgium and the Netherlands is ca. 276 m3s−1; summer and winter half-year mean discharges are 146 m3s−1 and 406 m3s−1respectively (Ashagrie et al., 2006).
3 Methods and approach
In this study we couple the climate model ECBilt-CLIO-VECODE (Brovkin et al., 2002; Goosse and Fichefet, 1999; Opsteegh et al., 1998) with the hydrological model STREAM (Aerts et al., 1999) to simulate Meuse palaeodischarge. The hydrological model is run with a daily time-step and spatial resolution of 2′×2′ (ca. 2.4 km×3.7 km). In this section we present the main features of the model; for a more detailed discussion see Ward (2007).
3.1 Models and climate forcing parameters
ECBilt-CLIO-VECODE is a three-dimensional coupled cli-mate model consisting of three components describing the atmosphere, ocean and vegetation (Brovkin et al., 2002; Goosse and Fichefet, 1999; Opsteegh et al., 1998). The output used in this study are derived from a transient run, forced by annually varying orbital parameters and atmo-spheric greenhouse gas concentrations (CO2and CH4)
fol-lowing Renssen et al. (2005), and atmospheric volcanic aerosol content and fluctuations in solar activity following Goosse et al. (2005). The model was run in ensemble mode, with 4 ensemble members. Each ensemble member repre-sents a single model run. The ensemble members are forced using the same climatic parameters, but with slightly differ-ent initial climatic conditions to account for the chaotic be-haviour of the atmospheric system. Hence, the difference between the ensemble members gives an idea of the natural variability, whereas an ensemble mean can be used to evalu-ate long-term trends.
STREAM is a grid-based spatially distributed water bal-ance model that describes the hydrological cycle of a drainage basin as a series of storage compartments and flows (Aerts et al., 1999). It is based on the RHINEFLOW model of Kwadijk (1993), and uses a raster GIS database to calcu-late the water balance of each grid cell per time-step. The wa-ter balance is calculated using the Thornthwaite (1948) equa-tions for potential evapotranspiration and the Thornthwaite and Mather (1957) equations for actual evapotranspiration; these equations use temperature and precipitation as the ma-jor input parameters. For each time-step the model generates runoff, groundwater storage (shallow and deep), snow cover,
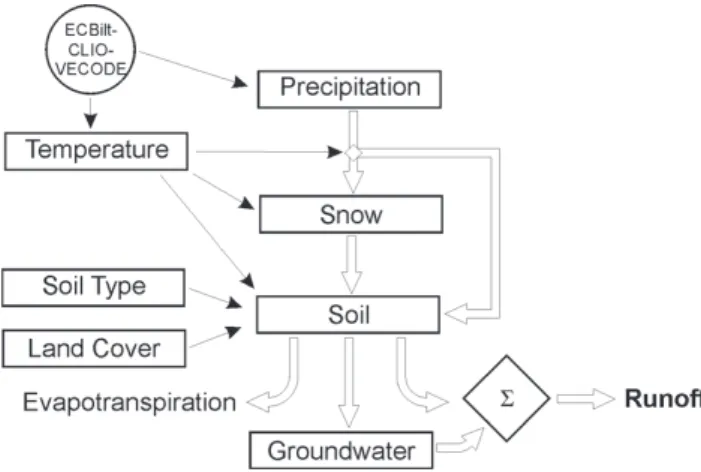
Fig. 2. Flowchart showing the main storage compartments and
flows of the STREAM palaeodischarge model (Ward et al., 2007). STREAM is based on a raster GIS database and calculates the wa-ter balance of each grid cell per time-step using the Thornthwaite (1948) equations for potential evapotranspiration and the Thornth-waite and Mather (1957) equations for actual evapotranspiration. For each cell and time-step the model generates runoff, groundwater storage (shallow and deep), snow cover, and snow melt. The direc-tion of water flow between cells is based on the steepest descent for the eight surrounding grid cells on a digital elevation model (DEM).
and snow melt. The direction of water flow between cells is based on the steepest descent for the eight surrounding grid cells on a digital elevation model (DEM). The main flows and storage compartments used to calculate water availabil-ity per cell are shown in Fig. 2. More detailed information, including the equations used in the calculation of the water balance, can be found in Ward (2007). The STREAM model was selected for numerous reasons (Ward, 2007). Firstly, as the model is based on a GIS database it can be used to exam-ine the effects of spatial changes in land use. Secondly, the model contains relatively few calibration parameters, whilst retaining a simple physical grounding. The introduction of many parameters can increase model uncertainty, which is already necessarily high in palaeodischarge assessments due to the lack of measured discharge prior to the era of instru-mental records. Thirdly, the model can be run on a daily time-step, which is essential when assessing flood frequency. Furthermore, the model is efficient to run in terms of compu-tational time, which is especially important given the use of a daily time-step over periods of a millennium.
In this study, STREAM is run at a spatial resolution of 2′×2′; this is high enough to capture the dominant processes in the basin (Booij, 2002), whilst pragmatic concerns regard-ing computational time render a higher resolution unfeasi-ble. Since we will be running STREAM on a daily time-step, as opposed to the monthly or 10-day time-step used in previous applications, we have added a simple threshold-based direct runoff component to simulate infiltration ex-cess overland flow. When precipitation exceeds a threshold
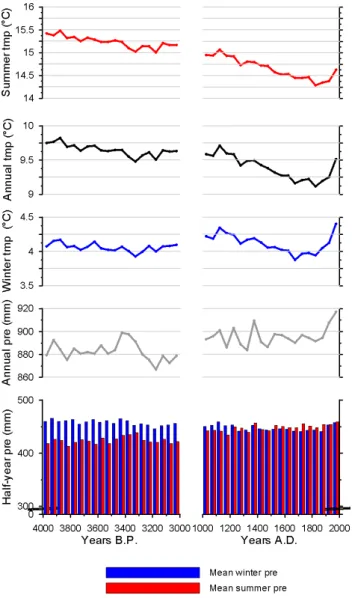
Fig. 3. Downscaled ECBilt-CLIO-VECODE climate data for the
time-periods 4000–3000 BP and 1000–2000 AD. The means of the 4 ensemble members are shown for each 50-year period. The bar charts show summer and winter half-year precipitation (pre), whilst the lines show long-term changes in mean summer, annual, and win-ter temperature (tmp), and mean annual precipitation.
(Ward and Robinson, 1990), excess precipitation runs off re-gardless of whether the soil is saturated. Runoff is routed through the river network on a daily basis using data on aver-age flow velocities stated in Berger (1992) (see Ward, 2007). The model was set up for the catchment upstream from Borgharen (Fig. 1), using the USGS GTOPO30 DEM (http: //edc.usgs.gov/products/elevation/gtopo30/gtopo30.html).
3.2 Input data 3.2.1 Climate data
The climate data (daily temperature and precipitation) de-rived from ECBilt-CLIO-VECODE have a spatial resolu-tion of ca. 5.6◦×5.6◦, and therefore need downscaling to the resolution of the STREAM model. The downscaling takes into account the spatial distribution of monthly averages, in accordance with Bouwer et al. (2004), using baseline ob-served monthly temperature and precipitation data for the pe-riod 1901–2000 from the CRU TS 1.2 dataset (Mitchell and Jones, 2005).
The downscaled mean monthly temperature and precip-itation data for the period 1901–2000 show good agree-ment with observed values for all ensemble members (tem-perature, r>0.99; precipitation, r>0.96). The downscaled daily temperature data were validated against observed val-ues for Maastricht, from the European Climate Assess-ment & Dataset (ECA&D) (http://eca.knmi.nl/) (Klein Tank et al., 2002). The modelled daily temperature data show good agreement with the observations (Mann-Whitney U test (MWU), α=0.05). The number of precipitation-free days at Maastricht (model, 27.5%; observed, 45.7%) is underesti-mated; this is related to the fact that the original model grid cell represents an area of ca. 5.6◦×5.6◦, whilst the observed data refer to a specific point. We found no significant dif-ference between the frequency distributions of observed and simulated daily precipitation for very wet days (10% wettest days) (Kruskal-Wallis (KW) test, χ2=1.691, p=0.792).
Simulated mean annual precipitation for 1000–2000 AD (895.93 mm) is slightly but statistically higher than for 4000– 3000 BP (882.56 mm) (t-test, p<0.001), though there is no statistical difference in variability (F-test, p=0.291) (Fig. 3). However, whilst mean summer precipitation for 1000– 2000 AD (448.22 mm) is significantly higher than for 4000– 3000 BP (424.37 mm) (t-test, p<0.001), winter precipita-tion is lower (1000–2000 AD, 447.71 mm; 4000–3000 BP, 458.19 mm; t-test, p<0.001). The greatest precipitation in-crease is between July and September. Mean 50-yr precipi-tation shows neither a significant trend over the period 4000– 3000 BP (MK-test, p=−0.1048) nor over the last millennium (MK-test, p=−0.2176). For the period 1000–2000 AD, mean annual and summer temperatures (9.39◦C and 14.66◦C re-spectively) are significantly lower than for 4000–3000 BP (9.65◦C and 15.24◦C respectively) (t-test, p<0.001). Over the course of the last millennium, mean, summer, and win-ter 50-yr temperatures show decreasing trends (MK-test, p<0.001, p<0.001, p=0.004 respectively), although clear increases are simulated over the last 150 years (Fig. 3). The long-term cooling trend of the late Holocene can be attributed to the biogeophysical effects of deforestation in (northwest-ern) Europe (Brovkin et al., 2006; Goosse et al., 2006; Matthews et al., 2003). For the 20th Century, mean simu-lated annual precipitation is 912.40 mm, and temperature is
9.38◦C; both show a relatively large increase in the second half of the 20th Century. Precipitation depths on very wet days (95th and 99th percentiles) are greater during 4000– 3000 BP than 1000–2000 AD. Although these precipitation depths increased in the 20th Century compared to the rest of the last millennium, they are still lower than at 4000– 3000 BP.
3.2.2 Land use data
A crop factor map is used in STREAM to calculate potential evapotranspiration (PE). The crop factor is a dimensionless factor by which the reference PE is multiplied in order to ac-count for the difference in PE over different land use types. In this study we have developed a land use map for each cen-tury (Appendix A); for more detailed information see Ward (2007). For the period 1000–2000 AD the pattern of land use change is shown in Fig. 4. The land use classes have been simplified due to the relative scarcity of detailed histor-ical land use data, and reclassed to crop factor maps based on values in Kwadijk (1993) and Aerts and Bouwer (2002): Urban (0.8), Forests (1.1), Agriculture and Grasslands (0.9), Wetlands (1.1), Water Bodies (1.5).
For the 20th Century, we used the dataset CORINE Land Cover 2000 (CLC2000) 250 m version 8/2005 (V2) (© EEA, Copenhagen, 2005), available at http://dataservice.eea.eu.int/ dataservice/. For the 19th Century we used data on forest and urban area from historical census information for Belgium (WL, 1994a) and France (Dutoo, 1994), and from historical maps for the Netherlands (Knol et al., 2004). Data on wet-lands and peat bogs were based on RWS Limburg/IWACO (2000). For the 11th Century we used a map of Meuse basin land use at ca. 1000 AD (RWS Limburg/IWACO, 2000), based on historical and archaeological evidence. For the re-maining centuries (12th–18th Centuries) no quantitative as-sessments of land use are available; instead the land use maps are based on qualitative historical studies (RWS Lim-burg/IWACO, 2000; WL, 1994a) and linear extrapolation (Ward, 2007).
Although archaeological and pollen evidence suggest that parts of the basin were populated by 4000–3000 BP (Bunnik, 1995; Gotj´e et al., 1990; Henrard, 2003), any disturbance in this period was, in our opinion, minor, and too small to have had any significant influence on hydrological processes (see results of sensitivity analysis in Sect. 3.4). Since the natural vegetation of northwest Europe at that time was predomi-nantly deciduous forest (Bunnik, 1995; Gotj´e et al., 1990), we have assumed a fully forested basin at 4000–3000 BP, ex-cept for those cells referring to “Water Bodies” (CORINE), and “Wetlands” (RWS Limburg/IWACO, 2000).
The basin-averaged crop factor (Fig. 5) shows a marked reduction between 4000–3000 BP and 1000–2000 AD (con-version of forest to agriculture), and decreases further over the last millennium (deforestation and peat extraction). How-ever, in the 20th Century the crop factor increases slightly
Fig. 4. Estimations of Meuse basin land use upstream from Borgharen during the period 1000–2000 AD. Forest cover fell from ca. 53% at the beginning of the last millennium to ca. 29% in the 19th Century, mainly at the expense of agricultural land. Between the 19th and 20th Centuries the percentage cover of forest and urban area increased at the expense of agricultural land.
(due to the reforestation of previously cultivated land, al-though tempered by urbanisation). Changes in land cover (the physical characteristics of the Earth’s surface) have shown more change than land use over the last century (e.g. an increase in coniferous forest relative to deciduous forest, and changes in types of agriculture) (Tu, 2006). However, on a millennial timescale the large-scale changes in land use are more important than such changes.
3.2.3 Soil water holding capacity
A map showing the maximum water holding capacity (WHC) of the soil (mm m−1) is used in STREAM to cal-culate evapotranspiration, runoff, groundwater seepage, and baseflow. For the present day we have used the United Na-tions Food and Agriculture Organization’s (FAO) map of WHC (FAO, 2003). Since the FAO dataset has too coarse a resolution to accurately represent the remaining areas of peat-bog in the Meuse basin, we have assigned those ar-eas a value of 71 mm m−1, i.e. the modal WHC value for
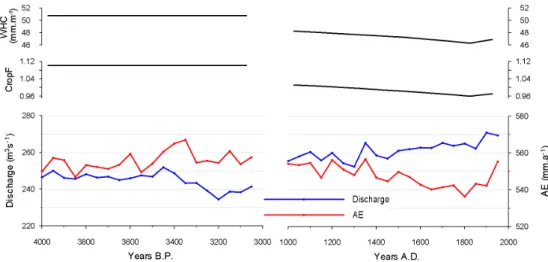
Fig. 5. Changes in mean annual discharge at Borgharen, basin-wide mean annual actual evapotranspiration (AE), crop factor (CropF), and
soil water holding capacity (WHC). For discharge and AE the mean values of the 4 ensemble members are shown, and have been lumped into 50-year periods in order to show the long-term signal. The crop factor reflects changes in basin-averaged land use, and shows a decrease over the last 1000 years due to deforestation, and an increase over the last 100 years due to reforestation. The changes in WHC are related to changes in land cover.
the remaining large intact areas of European peat-bog (FAO, 2003). Changes in land use cause changes in soil textural properties, therefore influencing WHC. The FAO WHC map is based on dominant soil unit, component soil units, texture, soil phase, and relief, but does not explicitly consider vege-tation. We found a significant positive correlation between WHC and percentage forest cover between the various soil units, and a significant negative correlation between WHC and percentage cover of agriculture and grasslands (Spear-man’s rank, α=0.05). Hence, the percentage difference be-tween the mean WHC of soils covered by forests and those covered by agriculture and grasslands was calculated, and the resulting change factors were coupled with the land use anomalies over time, to produce WHC maps for each century, similar to Mahe et al. (2005). For areas covered by rendzinas (shallow humus-rich soils over limestone) the original WHC of 63 mm m−1was retained since the WHC of this soil unit is mainly influenced by parent material (FAO, 2003). The estimated change in basin-wide WHC over the late Holocene can be seen in Fig. 5. Given the uncertainties in the spatial distribution of land use over the Holocene, the input maps of WHC give only an indication of the situation in each period, but the sign of change at the basin scale is in agreement with the gradual decrease in WHC at the basin scale over the late Holocene (e.g. RWS Limburg/IWACO, 2000).
3.3 Calibration and validation
Calibration was carried out for the relatively wet period 1961–2000, and validation for the relatively dry period 1921–1960. The calibration was initially carried out for the main river at Borgharen, using data provided by Ri-jkswaterstaat RIZA (Institute for Inland Water
Manage-ment and Waste Water TreatManage-ment), pertaining to the “un-divided Meuse”; they are based on discharge measure-ments at Borgharen, corrected for canal extractions be-tween Li`ege and Borgharen (De Wit et al., 2007), and are available since 1911. Further stations on the main river body were obtained for Chooz (Berger, 1992), and Stenay (DIREN Lorraine Bassin Rhin-Meuse). Tributary data were obtained from: Direction G´en´erale des Voies Hydrauliques Region Wallonne (http://voies-hydrauliques. wallonie.be/opencms/opencms/fr/hydro/annuaires/) for the Chiers (Chauvency-le-Chˆateau), Semois (Membre), Lesse (Gendron) Ambl`eve (Martinrive), Ourthe (Tabreux), and Vi-roin (Treignes); Roer and Overmaas Water Board for the Geul (Meerssen) and Roer (Stah); and Berger (1992) for the Sambre (Namur). The parameters used in the final model can be found in Ward (2007).
The annual hydrographs for Borgharen (Fig. 6) show good correlations between mean annual and mean monthly mod-elled and observed discharges for the calibration and vali-dation periods, as well as for both periods taken together. The agreement of total annual discharge was assessed by ex-pressing mean annual modelled discharge as a percentage of mean annual observed discharge (%), and the correlation of the means of monthly discharge was assessed using the corre-lation coefficient, r, and the co-efficient of efficiency, N&S. The modelled and observed daily discharge frequency distri-butions for 1921–2000 are statistically similar (MWU-test, p=0.366). In Table 1 the mean annual kth percentiles are given for the calibration and validation runs (k=1, 25, 50, 75, 90, 95, 99), showing good agreement for low, average, and high-flows. The model slightly overestimates the frequency of summer half-year high-flows (Qk, k>97) due to an
over-Table 1. Magnitudes of mean annual kth percentiles of daily discharge (Qk, k=1, 25, 50, 75, 90, 95, 99) at Borgharen for the calibration and
validation periods. Bold type indicates that the magnitudes are statistically similar to the observed discharge magnitudes (t-test, α=0.05). Discharge (m3s−1)
Time-period Q1 Q25 Q50 Q75 Q90 Q95 Q99
Calibration (1961–2000) 47.5 93.2 185.9 380.4 607.9 754.9 1096.2
Validation (1921–1960) 46.9 91.1 178.6 379.2 623.1 774.7 1165.7
Fig. 6. Hydrographs showing the agreement between mean monthly simulated and observed discharge at Borgharen for: (a) the validation
period, 1921–1960; (b) the calibration period, 1961–2000; and (c) the entire period 1921–2000. Also shown are the total accuracy (%), Pearson’s Product Moment Correlation Coefficient (r), and Nash & Sutcliffe efficiency (N&S).
estimation of high precipitation events in autumn in ECBilt-CLIO-VECODE. The model simulates the annual, monthly, and daily discharge characteristics of major tributaries well (Ward, 2007).
For the Meuse basin, no detailed estimates of actual evapo-transpiration (AE) are available. The simulated mean annual basin-average potential evapotranspiration (PE) for 1921– 2000 (605 mm a−1) is of the same order of magnitude as the estimated PE for the Belgian sub-catchments for 1968– 1998 (555 mm a−1) (Leander et al., 2005), although the dis-crepancy is significant. However, in our model PE is con-verted into AE using the Thornthwaite and Mather (1957) equations, and whilst a discrepancy exists between mod-elled and “observed” PE this is not the case for AE. For the period 1901–2000 we simulate basin-wide precipitation of 912.7 mm a−1, compared to 913.3 mm a−1 in the observed (CRU) record; for mean annual discharge at Borgharen for the period 1921–2000 we simulated 268.4 m3s−1, against 270.4 m3s−1in the observed record. Given that the annual values for soil storage, groundwater storage, and snow stor-age (i.e. the storstor-age compartments of STREAM) remain con-stant over these periods, the mean annual AE total must also be correct. The correlation between mean monthly PE totals reflects the annual pattern of changes in PE well (r=0.92).
Another approach to the simulation of evapotranspiration would have been to use PE and AE values from ECBilt-CLIO-VECODE. However, no accurate datasets pertaining to these parameters are available for downscaling the climate model output to the resolution of STREAM.
Data pertaining to the number of days per year on which the ground is covered by snow at Maastricht (Klein Tank et al., 2002, http://eca.knmi.nl/), were used in the calibra-tion of parameters pertaining to snowmelt and snowfall. In the model output for 1961–2000 the ground was covered by snow at Maastricht on average 3.6% of days per year, com-pared to 3.7% of days in the observed record.
3.4 Sensitivity analysis
To assess the sensitivity of the hydrological model to changes in the calibration parameters, the model was re-run for the calibration period (1961–2000), but altering the values of in-dividual calibration parameters by ±10% and ±50%. The re-sults of the sensitivity analysis can be found in Appendix B. The model is sensitive to changes in parameters influencing evapotranspiration (namely crop factor), and fairly insensi-tive to parameters pertaining to WHC and slope (C). Hence, it is important that the crop factors are reliable, as incorrect
Fig. 7. Mean monthly simulated ensemble mean discharge at Borgharen for the periods 4000–3000 BP, 1000–2000 AD, and the 20th Century AD. The increase in discharge since the period 4000– 3000 BP has mainly taken place during the summer half-year.
crop factors could lead to large errors in the estimation of evapotraspiration. We calculated the present day percentage cover of forest and agriculture for 11 sub-catchments (up-stream from the following points): Stenay, Chauvency-le-Chˆateau, Membre, Gendron, Martinrive, Meerssen, Chooz, Tabreux, Stah, Namur, Treignes. For each sub-catchment we also calculated the percentage anomaly between annual observed and modelled discharge. We found no correlation between percentage forest cover and model accuracy (Spear-man’s Rank, p=0.467), which suggests that the accuracy of the model is not biased by the crop factor values used for for-est and agriculture. Since the main land use changes of the late Holocene have been between these two land use types, the model should therefore be able to simulate the effects of these land use changes on evapotranspiration.
The basin-wide changes in WHC used in our model (Fig. 5) show a maximum change between the periods 4000– 3000 BP and 1000–2000 AD of 8.9%. The sensitivity analy-sis showed that an increase or decrease of WHC of 10% led to a change in mean annual discharge of just ±0.7%, and had little influence on high and low-flows. Hence, our palaeodis-charge model is more useful for examining the effects of land use change on evapotranspiration, rather than on soil mois-ture.
We also tested the sensitivity of the model to changes in land use (and namely the replacement of forest by agricul-ture) in order to firstly test our assumption that the small scale presence of humans in the Meuse basin during the pe-riod 4000–3000 BP would not have had a significant effect on hydrological processes, and secondly to test the
robust-ness of our generalised maps of land use change. A con-trol run was carried out using the climate data of one en-semble member for the period 4000–3000 BP, assuming the basin to be fully forested (except for those cells pertaining to wetlands, see Appendix A). Then, the model was re-run using the same climate data, but replacing the land use maps with new maps showing 5% and 10% deforestation respec-tively (forest cells were chosen at random and replaced by cells pertaining to agriculture). The results for mean annual and maximum discharge, as well as a number of discharge percentiles, are shown in Table 2. The slight increase in mean annual discharge between control and 5% deforesta-tion (+0.8%) is statistically insignificant (t-test, p=0.27), and the effect on high flows is very small. For a deforestation of 10%, the effect on mean discharge (+1.6%) becomes statis-tically significant (t-test, p=0.03), although it is still minor; the increase in mean annual maximum discharge (+0.4%) is negligible. Given that the effects of a 5% and 10% deforesta-tion on our mid-Holocene discharge results are so minor, our assumption that land use at that time can be simulated using a scenario of full forest cover is valid. Furthermore, the results of our sensitivity analysis suggest that our generalised maps of land use change over time are robust, since the model is not oversensitive to small changes, and hence very detailed land use maps are not required.
4 Results
In this section we compare the results for 4000–3000 BP with those for 1000–2000 AD. We use the period 4000–3000 BP as a reference period in which the hydrological system was in a natural state. The discharge results for this reference pe-riod are compared to those of 1000–2000 AD, during which time the hydrological system was affected by anthropogenic changes in land use and climate.
4.1 Mean discharge
The simulated ensemble mean annual discharge shows a statistically significant increase (t-test, p<0.001) of 6.6% between 4000–3000 BP (244.8 m3s−1) and 1000–2000 AD (261.0 m3s−1) (Fig. 5). The variability of mean annual discharge also increased (4000–3000 BP, σ =39.6; 1000– 2000 AD, σ =44.8; F-test, p<0.001). The increase in the winter half-year (+2.3%) was small compared to the increase in the summer half-year (+21.6%) (Fig. 7). Reference to Fig. 5 shows that discharge in the 20th Century AD (ca. 270.0 m3s−1) was higher than in the period 1000–1900 AD, and that mean annual discharge in the period 1000–1900 AD (ca. 260.0 m3s−1) was significantly higher than in the pe-riod 4000-3000 BP (t-test, p<0.001). The same is not true for the interannual variability, which shows no signifi-cant difference between 1000–1900 AD (σ =44.7) and 1901– 2000 AD (σ =45.1) (F-test, p=0.544). During the period
Table 2. Sensitivity analysis of the coupled climate-hydrological model to changes in land use from forest to agriculture. The model was
run for the period 4000–3000 BP assuming the basin to be fully forested (control), and then re-run assuming scenarios of 5% and 10% deforestation respectively (forest replaced randomly by agriculture). The increases in mean (Qann) and maximum (Qmax) annual discharge
as well as various mean annual kth percentiles of daily discharge (Qk, k=25, 50, 75, 90, 95) show that a deforestation of 5% has little effect
on Meuse discharge.
Discharge (m3s−1)
Scenario Qann Q25 Q50 Q75 Q90 Q95 Qmax
Control (Full forest) 241.3 65.8 144.0 342.6 572.1 726.5 1632.4 5% deforestation 243.2 67.0 146.5 345.2 574.5 728.8 1635.7 10% deforestation 245.2 68.3 149.2 347.9 576.8 731.1 1639.0
1000–2000 AD, discharge shows an increasing monotonic trend (MK-test, p<0.001) (Fig. 5). Surplus water avail-ability for runoff is in fact dependent on two key compo-nents: precipitation and actual evapotranspiration (AE). The long-term changes in discharge cannot be simply related to changes in precipitation over the Holocene. The simulated increase in summer precipitation between 4000–3000 BP and 1000–2000 AD was just 5.6% (compared to a 21.6% increase in summer discharge), whilst winter precipitation depths showed a decrease of 2.3% (compared to a 2.3% increase in winter discharge). Moreover, no monotonic trend of increas-ing annual precipitation is simulated for the last millennium, in contrast to mean annual discharge. However, simulated AE was significantly higher at 4000–3000 BP than at 1000– 2000 AD (t-test, p<0.001). Furthermore, we see a strong decreasing trend in AE over the last 1000 years (MK-test, p=0.004) (Fig. 5), mainly as a result of reduced forest cover and hence reduced crop factor, and to a less extent due to reduced temperature.
We found no simple correlation relating mean annual tem-peratures to mean discharge or precipitation. Whilst we did simulate a strong positive correlation between 50-yr mean annual discharge and 50-yr summer precipitation totals for the period 1000–2000 AD, no such correlation was noted for 4000–3000 BP. Due to the higher crop factors at 4000– 3000 BP, annual PE-AE at that time was almost two times as high as during the last millennium. Hence, more excess pre-cipitation in wet summers could be lost to AE, and therefore fluctuations in summer precipitation had less influence on discharge. This mechanism may also be responsible for the simulated increase in variability of mean annual discharge, since no change in precipitation or temperature variability was simulated between the time-slices.
For the 20th Century we see an increase in mean dis-charge compared to the 19th Century (Fig. 5) (19th Cen-tury, 263.5 m3s−1; 20th Century, 270.0 m3s−1), despite a significant increase in AE (19th Century, 539.8 mm a−1; 20th Century, 548.8 mm a−1). This increase in discharge is as-cribable to a relatively large increase in precipitation in the 20th Century (912.4 mm a−1) compared to the 19th Century
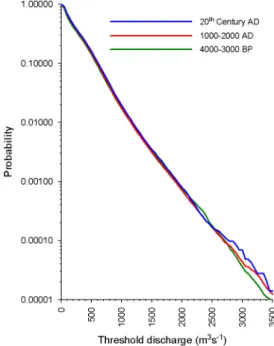
Fig. 8. Probability of daily discharge over a threshold for the 4
ensemble members. Large high-flow events (Q>3000 m3s−1) are
predicted more frequently in the period 1000–2000 AD than in the period 4000–3000 BP. In the 20th Century AD the frequency of large high-flow events is greater still.
(893.1 mm a−1); annual precipitation depths in the former period are thereby greater than in any preceding century. 4.2 High-flow events
Between 4000–3000 BP and 1000–2000 AD the frequency of high-flows increased, whilst high-flows occurred even more frequently in the 20th Century AD than in the rest of the last millennium (Fig. 8). The difference be-tween the frequency distributions for the periods 4000– 3000 BP and 1000–2000 AD is statistically significant (KS-test, p<0.001), as are the differences between the frequency distributions between the periods 4000–3000 BP and 1000–
Table 3. Simulated recurrence times of daily discharge (Q) in
ex-cess of 800, 1300, 1950, and 3000 m3s−1; these discharge mag-nitudes correspond approximately to discharge percentiles Q95,
Q99, Q99.9, and Q99.995 respectively, in the observed
time-series for Borgharen between 1912-2000. Large high-flow events (Q>3000 m3s−1) are simulated almost twice as frequently in the
20th Century AD as in the natural reference period (4000–3000 BP).
Discharge (m3s−1)
Time period >800 >1300 >1950 >3000
4000–3000 BP 26 days 165 days 3.2 years 77 years 1000–2000 AD 25 days 168 days 3.4 years 65 years 20th Century AD 22 days 150 days 3.0 years 40 years
1900 AD, and 1000–1900 AD and 1901–2000 AD respec-tively (K-S test, p<0.001).
We examined the changes in the simulated recurrence times of high-flow events of the following magnitudes: Q>800 m3s−1, 1300 m3s−1, 1950 m3s−1, and 3000 m3s−1 (Table 3). These correspond approximately to the discharge percentiles Q95, Q99, Q99.9, and Q99.995 in the observed
record at Borgharen (1912–2000). Little change is evident in the recurrence times of relatively small to medium high-flows (Q>800 m3s−1 and 1300 m3s−1) between 4000–3000 BP
and 1000–2000 AD, although there is a slight but clear in-crease in frequency with regards to the 20th Century. For large high-flow events (Q>3000 m3s−1), a clear increase in recurrence frequency can be seen between 4000–3000 BP and 1000–2000 AD, with a further increase in the 20th Cen-tury. The recurrence time of flows of this magnitude is almost twice as short in the 20th Century as in the reference period 4000–3000 BP. We also calculated the magnitude of high-flows with an extremely long return period (1250 years): this increased from 4007 m3s−1in the period 4000–3000 BP, to 4143 m3s−1in the period 1000–2000 AD. For the 20th Cen-tury it was not possible to estimate the magnitude of high-flows with this return frequency, since only 400 years of sim-ulations (100 years × 4 ensemble members) are available.
To examine whether the simulated number of large high-flow events (Q>3000 m3s−1) for the 20th Century falls within the limits of natural variability, we calculated the number of flow events for which Q>3000 m3s−1 for each possible 100-yr period in the simulations. Note that the results of the 4 ensemble members have been lumped to-gether, and hence each 100-year period corresponds to 400-years of observations. Firstly, we filtered out flow events of Q>3000 m3s−1whereby the simulated discharges occurred within 10 days of each other, so as to ensure that independent events were counted, following Tu (2006). For the period 1901–2000 AD, 10 flow events with Q>3000 m3s−1 were simulated in the 4 ensemble runs. Then we calculated the
number of flow events for which Q>3000 m3s−1for every possible 100-yr period in the simulations; 900 possible pe-riods of 100-yr duration exist for each millennial time-slice. During 1000–2000 AD, there were 8 periods of 100-yr du-ration in which this frequency of high-flow events (10 per 100-yr for Q>3000 m3s−1) was simulated; for the period 4000–3000 BP it was simulated only one time. Hence, the frequency of large high-flows has been particularly great over the last 100 years, but does not fall outside natural variability. 4.3 20th Century trends
We investigated the presence or absence of monotonic trends (M-K test) in simulated discharge, precipitation, tempera-ture, and AE time-series over the 20th Century. On this timescale land use is assumed to be constant in our model, so any trend can be ascribed to climatic change. For mean an-nual, summer, and winter discharge, as well as for the 75th, 90th, 95th, and 99th percentiles of daily discharge, we found no significant trends. Upward trends were found for mean annual, summer, and winter temperature, which forced sig-nificant upward trends in annual and winter AE, although no significant trend in summer AE. For mean annual, summer, and winter precipitation no significant trends were simulated, although these parameters increased weakly. Hence, despite significantly increasing trends in AE over the last 100 years, no significant discharge trend was noted due to the compen-satory effect of the weak increasing trend in precipitation. 4.4 Relative contributions of climate and land use change
to changes in discharge
The results described in Sects. 4.1 to 4.3 show an increase in mean discharge and flood frequency between the natu-ral reference state and the last millennium, with a further increase in the 20th Century. Given that the simulated in-crease in mean discharge mainly took place in the summer, that precipitation shows no trend over the last 1000 years, and that the intensity of large precipitation events was higher in 4000–3000 BP, we attribute the increase in mean discharge and high-flow events to a large extent to changes in land use (lower evapotranspiration due to decreased forested area). However, comparing the 20th Century results to those of the 19th Century, it appears that a significant increase in pre-cipitation has become the dominant mechanism, since the observed reforestation over that period should theoretically have led to decreased discharge. To test this theory we car-ried out further hydrological simulations to delineate the ef-fects of land use and climatic change.
For the period 4000–3000 BP we carried out a further sim-ulation with STREAM, using one ECBilt-CLIO-VECODE ensemble member as climate input data, but using the land use and WHC maps of the 20th Century. Similarly, we ran a simulation with the 20th Century climate input data, but using the land use and WHC data for 4000–3000 BP. In this
Table 4. Percentage change in mean annual (Qann), summer (Qsum), and winter (Qwin) discharge and various high-flow percentiles (Qk, k=75, 90, 95, 99) between 4000–3000 BP and the 20th Century AD (above), and between the 19th and 20th Centuries AD (below). The
increase in discharge and high-flow magnitude between the period 4000–3000 BP and the 20th Century AD is mainly due to changes in land use. However, the increase in discharge and high-flow magnitude between the 19th and 20th Centuries AD is due to climatic change (mainly increased mean winter precipitation and increased precipitation intensity).
Qann Qsum Qwin Q75 Q90 Q95 Q99
Percentage change between 4000–3000 BP and 20th Century AD
Climate and land use +12.5 +28.8 +7.7 +11.3 +7.1 +5.6 +4.1
Climate only – +0.7 −0.1 −0.4 +0.6 +0.1 −0.6
Land use only +12.4 +28.1 +7.8 +11.7 +6.6 +5.5 +4.8 Percentage change between 19th Century AD and 20th Century AD
Climate and land use +3.5 +0.3 +4.6 +4.3 +2.9 +3.2 +4.0 Climate only +4.5 +2.2 +5.4 +5.5 +3.7 +3.7 +4.5 Land use only −1.0 −1.9 −0.7 −1.2 −0.8 −0.5 −0.5
way the effects of changes in climate and land use were de-lineated. Similarly, we ran STREAM using climate data of the 19th Century with land use data for the 20th Century, and vice versa.
The results of these simulations (Table 4) show that the change in climatic conditions between 4000–3000 BP and the 20th Century has had almost no effect on discharge; al-most all of the change on this timescale can be attributed to large-scale changes in land use (mainly a large decrease in forest at the expense of agricultural and urban land). The re-sults of our sensitivity analysis show that changes in WHC have very little effect on either mean discharge or flood fre-quency, and hence we can attribute the increases to the sig-nificant reduction in AE which occurred as a direct result of deforestation. An examination of the changes in discharge characteristics between the 19th and 20th Centuries reveals the opposite pattern. As expected, the increased crop fac-tor (due to reforestation) between these two time-periods means that the effect of land use change alone is to force a slight reduction in mean discharge and high-flow magnitude. However, the increase in precipitation (mean and intensity) between these two time-periods has overwhelmed the land use forcing, leading to increased discharge magnitudes, es-pecially in the winter half-year (due to a relatively large in-crease in winter precipitation), and inin-creased magnitude of high-flow events (due to increased precipitation intensity and increased winter half-year antecedent soil moisture).
5 Discussion
5.1 Effects of land use change on discharge
Our results are in agreement with those of recent studies on the effects of land use change on Meuse discharge. Tu (2006) investigated the observed discharge characteristics
of the Meuse for the period 1912–2000, and found the ef-fects of land use change to be marginal or statistically un-detectable. Ashagrie et al. (2006) used the HBV model to simulate changes in Meuse discharge over the 20th Century, and concluded that the observed change in land use did not have a significant effect on discharge. Although we did not simulate changes in land use within the 20th Century, we see that the effect of land use change in the 20th Century in re-lation to the 19th Century is minor. On this timescale the changes in land use were relatively small and worked in a compensatory fashion in terms of their effects on AE, since the crop factor associated with forest is high, whereas that associated with urban areas is low.
Whilst land use change has not greatly influenced dis-charge over the last century, our results show that on a longer timescale the large-scale deforestation of the basin has led to significant increases in mean discharge and flood frequency. It is now widely accepted that forests can cause a reduction in mean discharge, especially during the summer half-year (Calder, 1993). The results of paired catchment studies in temperate zones have established strong links between de-forestation and increasing mean discharge, and vice versa (Andr´eassian, 2004; Bosch and Hewlett, 1982; Hornbeck et al., 1993; Sahin and Hall, 1996). In single basin studies, large increases in discharge due to deforestation, or decreases due to reforestation, have been noted in Europe (Gallart and Llorens, 2004; Keesstra, 2006), Africa (Mahe et al., 2005; Scott et al., 2005), North America (Trimble et al., 1987), and South America (Costa et al., 2003; Iroum´e et al., 2005). Var-ious modelling studies of European streamflow have simu-lated significant changes in response to land use change (Bul-tot et al., 1990; Kl¨ocking and Hamberlandt, 2002; Wege-henkel, 2002). Two of the most important factors affecting discharge via land use change are: (a) alterations in evap-otranspiration totals (Calder, 1993; Hornbeck et al., 1993;
Keesstra, 2006; Robinson et al., 2003) due to changes in leaf area, stomatal response, and interception; and (b) changes in soil water holding characteristics (Cosandey et al., 2005; Mahe et al., 2005); in our model the discharge effects of land use change can be mainly ascribed to changes in AE, since the model is fairly insensitive to changes in WHC.
The effect of deforestation on high-flow events is more de-bated (EEA, 2001). In a review of 113 paired catchments, Andr´eassian (2004) found that flood volumes and peak-flows could increase after deforestation, but that the response was much more varied in time and space than for mean discharge. Nevertheless, large-scale deforestation has led to increased peak-flows around the globe (Brown et al., 2005; Gentry and Parody, 1980; Jones, 2000; Mahe et al., 2005), whilst refor-estation has led to significant reductions in flood peaks (Fa-hey, 1994; Robinson et al., 1991). In our simulations, large-scale deforestation led to increased flood frequency due to significant decreases in AE; this decrease in AE has both a direct effect due to increased surplus water availability, and an indirect effect due to earlier soil saturation.
5.2 Comparison of simulation results with proxy and his-torical data
In order to validate the results of our model for the late Holocene, we compared our findings with qualitative re-sults based on multi-proxy data. Simulated mean summer and winter temperatures are in reasonable agreement with multi-proxy reconstructions of regional temperature for the late Holocene, which show a gradual decrease in tempera-ture (especially in summer) (Bohncke et al., 1987; Goosse et al., 2006; Zagwijn, 1994). Proxy data on late Holocene precipitation change in the region are scarce, but suggest a slight increase in precipitation in the last millennium com-pared to the period 4000–3000 BP (Bohncke and Vanden-berghe, 1991; Van Geel et al., 1996), though they give no indication of seasonal changes. Whilst these proxy data are very limited in detail, their main trends are in agreement with our results.
The qualitative results of multi-proxy studies on late Holocene Meuse discharge are in agreement with our conclu-sion of increasing mean discharge and high-flows. Berend-sen and Stouthamer (2001) suggest that an increase in mean-der wavelengths in the Rhine-Meuse delta after ca. 2800 BP may be indicative of increased bankfull discharge in both rivers. Furthermore, they postulate that an increase in flood frequency may have occurred somewhere between 3000– 2000 BP, as attested by an increase in avulsion frequency and the reoccupation of residual channels by floodwaters (e.g. Hofstede et al., 1989). De Moor (2007) states that the in-creasing thickness of fining-up sequences in the fluvial de-posits of the Geul (Meuse tributary) could represent an in-crease in bankfull discharge due to deforestation since Ro-man times. Zagwijn (1986) suggests that a reduction of forested area in the Netherlands, especially since Roman
times, led to a reduction in evapotranspiration, and conse-quently increased discharge. Similarly, Bohncke and Van-denberghe (1991) derived qualitative estimates of changes in evapotranspiration, precipitation, and temperature in the Mark Basin (southern Netherlands) to suggest that discharge was higher at 1000–2000 AD than at 4000–3000 BP. Based on an examination of historically documented floods over the period 1000–2000 AD, WL (1994b) conclude that the fre-quency of high-flow events since 1911 appears to have been greater than in the preceding centuries. However, it should be stressed that the frequency of floods in the historical record may be underestimated due to the lack of systematic mea-surements.
5.3 Uncertainties and limitations
Our model experiment includes a number of limitations, the most important being those associated with database uncer-tainties: (1) the climate model has a low spatial resolution and simplified physics compared to GCMs. This makes it impossible to correctly simulate the regional details and vari-ability of daily precipitation; (2) the downscaling of precip-itation is carried out using a simple linear correction tech-nique based on monthly correction factors. Leander and Buishand (2007) found it to be advantageous to correct also for the variability of 10-day precipitation amounts. How-ever, given the long timescales involved in the palaeodis-charge approach a more sophisticated downscaling method was found to be unfeasible; (3) the land use data represent only a generalised pattern of land use change over the last millennium; (4) the resolution used in STREAM means that only larger river networks can be delineated. The chosen res-olution does, however, allow for the assessment of changes in long-term discharge trends at the basin-scale (Ward, 2007); and those associated with physical process uncertainties: (1) the Thornthwaite & Mather equation (1957) for AE is highly simplified; (2) the impact of anthropogenic water extraction and canalisation is not fully accounted for; (3) STREAM (and indeed any hydrological model), cannot fully describe the hydrological processes within the basin, and especially the groundwater and soil water processes are overly simpli-fied. Hence it is difficult to assess the effects of changing soil characteristics on Meuse discharge, although changes in soil water holding capacity have been estimated.
These limitations inevitably introduce uncertainties in our results, and hence they should be used with caution. The dis-charge results should not be taken as exact figures for each period studied, but rather they give an indication of the main trends in mean discharge and flood frequency over the late Holocene, and can be used to examine relative changes be-tween the time-slices studied. Similarly, the land use data do not represent the exact situation per century, but give an indication of the trend in land use change over the last millen-nium, and hence allow for an investigation of the sensitivity of the hydrological system to those changes.
Despite these limitations, the calibration and validation of the model was successful for annual, monthly and daily discharge characteristics. Furthermore, the climate and dis-charge results are in agreement with the general trends in-ferred from the limited local and regional multi-proxy data. One of the major advantages of our approach is that we were able to perform millennial-scale simulations in ensem-ble mode, with multiple land use scenarios, which would not have been feasible with a full GCM.
6 Conclusions
According to our simulations the mean discharge, flood fre-quency, and flood magnitudes of the Meuse river were signif-icantly greater in the last millennium than in the period 4000– 3000 BP, as was the variability of mean annual discharge. The mean annual discharge increased by 6.6% between these time-slices; the most marked increase occurred in the sum-mer half-year (+21.6%). The recurrence time of large high-flow events (Q>3000 m3s−1) decreased from 77 years in the period 4000–3000 BP, to 65 years in 1000–2000 AD. On this timescale these increases can be almost fully attributed to changes in land use, and namely decreased evapotranspira-tion as a result of the large-scale deforestaevapotranspira-tion of the basin. On a millennial timescale climatic change has had an in-significant effect on late Holocene Meuse discharge.
However, between the 19th and 20th Centuries climate change has overwhelmed land use change as the most im-portant mechanism. Although evapotranspiration was higher in the 20th Century than in the 19th Century (due to refor-estation and increased temperature), the mean discharge was greater in the 20th Century than during any preceding cen-tury, and 2.5% greater than in the 19th Century. The
oc-currence of large high-flows (Q>3000 m3s−1) was almost twice as frequent during the 20th Century as during the nat-ural reference period 4000–3000 BP. Mean discharge and flood frequency were also greater in the 20th Century than in the period 1000–1900 AD, although the discharge and flood frequency in the latter period were still greater than in the natural reference period 4000–3000 BP. The increases in mean discharge and flood frequency in the 20th Century are the result of a strong increase in annual and winter pcipitation compared to the preceding centuries, probably re-lated to anthropogenic climate change. The effect of land use change alone between the 19th and 20th Centuries was to force a slight decrease in mean discharge and flood fre-quency, but these decreases were more than compensated for by increased precipitation in the 20th Century.
Many basins in western Europe have experienced similar changes in land use as a result of human activities during the late Holocene, and similar land use changes have occurred at different times throughout the mid-latitudes. The results of this study suggest that more research is needed to ex-amine the potential contribution of land use management to flood mitigation in these regions. Theoretically, large-scale reforestation may offer protection against increased flooding in basins with a similar hydrological setting to the Meuse. However, in many basins space is at a premium, and large-scale reforestation is not a viable option. Therefore, further experiments are needed to assess the relative effects of lim-ited reforestation in the coming century, in combination with projected climate change scenarios. Since our model has been validated against (limited) multi-proxy data on a millen-nial timescale, and for large environmental changes, it forms a useful tool for such assessments.
Appendix A Land use Urban Forests Agriculture & Grasslands Wetlands Water Bodies 11th Century AD 4000 - 3000 BP 18th Century AD 17th Century AD 16th Century AD 15th Century AD 14th Century AD 13th Century AD 12th Century AD 20th Century AD 19th Century AD
Fig. A1. Reconstructed Meuse basin land use maps for the late Holocene, showing the large decrease in forested area between 4000–3000 BP
and 1000–2000 AD. In the 20th Century AD some reforestation has occurred. The maps are based on CORINE data, census data, historical records, and pollen analyses.
Appendix B
Table B1. Results of sensitivity analysis, obtained by running the STREAM model with one climate ensemble member for the period
1961–2000, and adjusting individual calibration parameters by ±10% and ±50%. The correlation between the mean monthly values of each simulation and the observed values is given (r and N&S). The model is sensitive to changes in crop factor, relatively insensitive to changes in soil water holding capacity (WHC) and slope (C), and very insensitive to changes in other parameters.
Discharge scenario r N&S Qann(m3s−1) Q10(m3s−1) Q90(m3s−1)
Borgharen observed N/A N/A 275.1 61.0 625.0
Borgharen simulated 0.97 0.94 274.1 57.9 613.3 Crop factor−10% 0.96 0.90 300.7 70.0 645.9 Crop factor+10% 0.97 0.92 251.7 48.7 586.4 WHC−10% 0.97 0.93 277.0 59.4 618.4 WHC+10% 0.97 0.95 271.5 56.8 608.7 C−10% 0.97 0.94 274.1 54.0 617.4 C+10% 0.97 0.94 274.1 61.4 610.4 Crop factor−50% 0.89 −0.57 445.2 150.3 812.8 Crop factor+50% 0.98 0.18 148.9 18.5 406.3 WHC−50% 0.95 0.88 292.6 68.3 643.0 WHC+50% 0.99 0.95 253.8 50.4 577.0 C=1 0.97 0.94 274.1 49.4 622.1 C+50% 0.95 0.90 274.3 79.4 597.9
Acknowledgements. This research project was carried out in the
framework of the Dutch National Research Programme “Climate changes Spatial Planning” (www.klimaatvoorruimte.nl). We would like to thank M. de Wit for the provision of numerous datasets, and for reviewing an earlier version of the manuscript. We also thank M. Sivapalan, D. Labat, and an anonymous reviewer for their useful comments, which helped to improve the paper.
Edited by: M. Sivapalan
References
Aerts, J. C. J. H. and Bouwer, L. M.: STREAM Krishna. A hydro-logical model for the Krishna River in India, RIKZ/Coastal Zone Management Centre, The Hague, The Netherlands, www.geo.vu. nl/users/ivmstream/public/aerts&bouwer2002a.pdf, 2002. Aerts, J. C. J. H., Kriek, M., and Schepel, M.: STREAM (Spatial
Tools for River Basins and Environment and Analysis of Man-agement Options): Set Up and Requirements, Phys. Chem. Earth B. 24(6), 591–595, 1999.
Aerts, J. C. J. H., Renssen, H., Ward, P. J., De Moel, H., Odada, E., Bouwer, L. M., and Goosse, H.: Sensitivity of global river dis-charges under Holocene and future climate conditions, Geophys. Res. Lett., 33, L19401, doi:10.1029/2006GL027493, 2006. Andr´eassian, V.: Waters and forests: from historical
con-troversy to scientific debate, J. Hydrol., 291, 1–27, doi:10.1016/j.jhydrol.2003.12.015, 2004.
Ashagrie, A. G., De Laat, P. J. M., De Wit, M. J. M., Tu, M., and Uhlenbrook, S.: Detecting the influence of land use changes on discharges and floods in the Meuse River Basin - the predictive power of a ninety-year rainfall-runoff relation?, Hydrol. Earth Syst. Sci., 10, 691–701, 2006,
http://www.hydrol-earth-syst-sci.net/10/691/2006/.
Berendsen, H. J. A. and Stouthamer, E.: Palaeogeographic devel-opment of the Rhine-Meuse delta, The Netherlands, Koninklijke Van Gorcum, Assen, The Netherlands, 2001.
Berger, H. E. J.: Flow Forecasting for the River Meuse, Ph.D thesis, Technische Universiteit Delft, Delft, The Netherlands, 1992. Bohncke, S. J. P. and Vandenberghe, J.: Palaeohydrological
devel-opment in the Southern Netherlands during the last 15000 years, in: Temperate palaeohydrology, edited by: Starkel, L., Gregory, K. J., and Thornes, J. B., John Wiley & Sons, Chichester, U.K, 253–281, 1991.
Bohncke, S. J. P., Vandenberghe, J., Coope, R., and Reiling, R.: Geomorphology and palaeoecology of the Mark valley (southern Netherlands), II Palaeoecology and climate during the Weich-selian Late Glacial, Boreas, 16, 69–85, 1987.
Booij, M. J.: Appropriate modelling of climate change impacts on river flooding, Ph.D thesis, Universiteit Twente, The Nether-lands, 2002.
Booij, M. J.: Impact of climate change on river flooding assessed with different spatial model resolutions, J. Hydrol., 303(1–4), 176–198, doi:10.1016/j.jhydrol.2004.07.013, 2005.
Bosch, J. M. and Hewlett, J. D.: A review of catchment experiments to determine the effect of vegetation changes on water yield evap-oration, J. Hydrol., 55, 3–23, 1982.
Bouwer, L. M., Vermaat, J. E., and Aerts, J. C. J. H.: Winter at-mospheric circulation and river discharge in northwest Europe,
Geophys. Res. Lett., 33, L06403, doi:10.1029/2005GL025548, 2006.
Brovkin, V., Bendtsen, J., Claussen, M., Ganopolski, A., Kubatzki, C., Petoukhov, V., and Andreev, A.: Carbon cycle, vegeta-tion, and climate dynamics in the Holocene: Experiments with the CLIMBER-2 model, Global Biogeochem. Cy., 16(4), 1139, doi:10.1029/2001GB001662, 2002.
Brovkin, V., Claussen, M., Driesschaert, E., Fichefet, T., Kick-lighter, D., Loutre, M.-F., Matthews, H. D., Ramankutty, N., Schaeffer, M., and Sokolov, A.: Biogeophysical effects of his-torical land cover changes simulated by six Earth system mod-els of intermediate complexity, Clim. Dynam., 26, 587–600, doi:10.1007/s00382-005-0092-6, 2006.
Brown, A. E., Zhang, L., McMahon, T. A., Western, A. W., and Vertessy, R.: A review of paired catchment studies for determin-ing changes in water yield resultdetermin-ing from alterations in vegeta-tion, J. Hydrol., 310, 28–61, doi:10.1016/j.jhydrol.2004.12.010, 2005.
Bultot, F., Coppens, A., Dupriez, G. L., Gellens, D., and Meulen-berghs, F.: Repercussions of a CO2doubling on the water cycle
and on the water balance – A case study for Belgium, J. Hydrol., 99(3–4), 319–347, 1988.
Bultot, F., Dupriez, G. L., and Gellens, G.: Simulation of land use changes and impacts on the water balance – case study for Bel-gium, J. Hydrol., 114, 327–348, 1990.
Bunnik, F. P. M.: Pollenanalytische Ergebnisse zur Vegetations-und Land-wirtschaftsgeschichte der J¨ulicher L¨oßb¨orde von der Bronzezeit bis in die fr¨uhe Neuzeit, Bonner Jahrb¨ucher, 195, 313–349, 1995.
Calder, I. R.: Hydrologic effects of land use change, in: Handbook of Hydrology, edited by: Maidment, D. R., McGraw-Hill Inc., New York, 13.1–13.50, 1993.
Coe, M. T. and Harrison, S. P.: The water balance of northern Africa during the Mid-Holocene: an evaluation of the 6 ka BP PMIP simulations, Clim. Dynam., 19, 155–166, 2002.
Cosandey, C., Andr´eassian, V., Martin, C., Didon-Lescot, J. F., Lavabre, J., Folton, N., Mathys, N., and Richard, D.: The hydro-logical impact of the mediterranean forest: a review of French research, J. Hydrol., 301, 235–249, 2005.
Costa, M. H., Botta, A., and Cardille, J. A.: Effects of large-scale changes in land cover on the discharge of the To-cantins River, Southeastern Amazonia, J. Hydrol., 283, 206–217, doi:10.1016/S0022-1694(03)00267-1, 2003.
De Moor, J. J. W.: Human impact on Holocene catchment devel-opment and fluvial processes – the Geul River catchment, SE Netherlands, Ph.D thesis, Vrije Universiteit Amsterdam, Ams-terdam, The Netherlands, 2007.
De Wit, M., Warmerdam, P., Torfs, P., Uijlenhout, R., Roulin, E., Cheymol, A., Van Deursen, W., Van Walsum, P., Ververs, M., Kwadijk, J., and Buiteveld, H.: Effect of climate change on the hydrology of the river Meuse. Dutch National Research Pro-gramme on Global Air Pollution and Climate Change, Report number 410.200.090, RIVM, Bilthoven, The Netherlands, 2001. De Wit, M. J. M., Van den Hurk, B., Warmerdam, P. M. M., Torfs, P. J. J. F., Roulin, E., and Van Deursen, W. P. A.: Impact of climate change on low-flows in the river Meuse, Climatic Change, 82(3– 4), 1573–1480, doi:10.1007/s10584-006-9195-2, 2007. Dutoo, D.: Onderzoeksproject Watersnood Maas. Het areaal onder