HAL Id: hal-00296475
https://hal.archives-ouvertes.fr/hal-00296475
Submitted on 5 Mar 2008
HAL is a multi-disciplinary open access
archive for the deposit and dissemination of
sci-entific research documents, whether they are
pub-lished or not. The documents may come from
teaching and research institutions in France or
abroad, or from public or private research centers.
L’archive ouverte pluridisciplinaire HAL, est
destinée au dépôt et à la diffusion de documents
scientifiques de niveau recherche, publiés ou non,
émanant des établissements d’enseignement et de
recherche français ou étrangers, des laboratoires
publics ou privés.
J. D. Allan, D. Baumgardner, G. B. Raga, O. L. Mayol-Bracero, F.
Morales-García, F. García-García, G. Montero-Martínez, S. Borrmann, Jodi
Schneider, S. Mertes, et al.
To cite this version:
J. D. Allan, D. Baumgardner, G. B. Raga, O. L. Mayol-Bracero, F. Morales-García, et al.. Clouds
and aerosols in Puerto Rico ? a new evaluation. Atmospheric Chemistry and Physics, European
Geosciences Union, 2008, 8 (5), pp.1293-1309. �hal-00296475�
www.atmos-chem-phys.net/8/1293/2008/ © Author(s) 2008. This work is licensed under a Creative Commons License.
Chemistry
and Physics
Clouds and aerosols in Puerto Rico – a new evaluation
J. D. Allan1, D. Baumgardner2, G. B. Raga2, O. L. Mayol-Bracero3, F. Morales-Garc´ıa3, F. Garc´ıa-Garc´ıa2, G. Montero-Mart´ınez2, S. Borrmann4,5, J. Schneider5, S. Mertes6, S. Walter5, M. Gysel7,*, U. Dusek8,**, G. P. Frank8,***, and M. Kr¨amer9
1National Centre for Atmospheric Science, University of Manchester, Manchester, UK
2Centro de Ciencias de la Atm´osfera, Universidad Nacional Aut´onoma de M´exico, Mexico City, Mexico 3Institute for Tropical Ecosystem Studies, University of Puerto Rico, San Juan, Puerto Rico
4Institute for Atmospheric Physics, Johannes Gutenberg University, Mainz, Germany 5Particle Chemistry Department, Max Planck Institute for Chemistry, Mainz, Germany 6Leibniz-Institute for Tropospheric Research, Leipzig, Germany
7School of Earth, Atmospheric & Environmental Science, University of Manchester, Manchester, UK 8Biogeochemistry Department, Max Planck Institute for Chemistry, Mainz, Germany
9Institute for Chemistry and Dynamics of the Geosphere 1: Stratosphere, Forschungszentrum J¨ulich, J¨ulich, Germany *now at: Paul Scherrer Institut, Villigen, Switzerland
**now at: University of Utrecht, Utrecht, The Netherlands
***now at: Department of Physics, Lund University, Lund, Sweden
Received: 20 August 2007 – Published in Atmos. Chem. Phys. Discuss.: 24 August 2007 Revised: 19 November 2007 – Accepted: 31 January 2008 – Published: 5 March 2008
Abstract. The influence of aerosols, both natural and
an-thropogenic, remains a major area of uncertainty when pre-dicting the properties and behaviour of clouds and their in-fluence on climate. In an attempt to better understand warm cloud formation in a tropical marine environment, a period of intensive measurements took place in December 2004 in Puerto Rico, using some of the latest developments in online instrumentation such as aerosol mass spectrometers, cloud condensation nuclei counters and a hygroscopicity tandem differential mobility analyser. Simultaneous online measure-ments of aerosol size distributions, composition, hygroscop-icity and optical properties were made near the lighthouse of Cape San Juan in the north-eastern corner of the island and at the top of East Peak mountain (1040 m a.s.l.), the two sites separated by 17 km. Additional measurements of the cloud droplet residual and interstitial aerosol properties were made at the mountain site, accompanied by measurements of cloud droplet size distributions, liquid water content and the chem-ical composition of cloud and rain water samples.
Both aerosol composition and cloud properties were found to be sensitive to wind sector. Air from the east-northeast
Correspondence to: D. Baumgardner
(ENE) was mostly free of anthropogenic influences, the sub-micron fraction being mainly composed of non-sea salt sul-phate, while that from the east-southeast (ESE) was found to be moderately influenced by populated islands upwind, adding smaller (<100 nm), externally mixed, carbonaceous particles to the aerosol that increased the number concen-trations by over a factor of 3. This change in composition was also accompanied with a reduction in the measured hy-groscopicity and fractional cloud activation potential of the aerosol. At the mountain site, the average cloud droplet con-centrations increased from 193 to 519 cm−3, median volume diameter decreased from 20 to 14 µm and the liquid water content increased from 0.24 to 0.31 g m−3when the winds
shifted from the ENE to ESE. Larger numbers of interstitial particles were recorded, most notably at sizes greater than 100 nm, which were absent during clean conditions. The average size of the residual particles and concentrations of cloudwater nitrate, sulphate and insoluble material increased during polluted conditions.
Previous studies in Puerto Rico had reported the presence of a significant non-anthropogenic organic fraction in the aerosols measured and concluded that this was a factor con-trolling the in situ cloud properties. However, this was not observed in our case. In contrast to the 1.00±0.14 µg m−3
of organic carbon measured in 1992 and 1995, the organic matter measured in the current study of 0.17±0.35 µg m−3
is many times lower, most of which can be attributed to an-thropogenic sources. During clean conditions, the submi-cron aerosol was observed to be almost entirely inorganic, an observation supported by the hygroscopicity measurements. This suggests that organic aerosols from marine sources may not be completely ubiquitous (either spatially or tempo-rally) in this environment and requires further investigation to quantify their true extent and implications, with more ex-tensive, longer-term sampling in conjunction with wind field analyses.
1 Background and objectives
Aerosol properties have long been recognized as an impor-tant influence on the dynamics and properties of clouds (Mc-Figgans et al., 2006; Twomey, 1977). Quantitatively link-ing aerosol properties to cloud albedo and lifetime is a pri-ority in climate science, as this is needed to address a large area of uncertainty in radiative forcing (Forster et al., 2007). This is especially true for marine clouds in tropical envi-ronments, as these have a dramatic influence on the plan-etary radiation budget due to both the high solar radiation flux and the low albedo of the surface they obscure. Re-cent advances in our understanding of interactions between aerosols and warm clouds has been driven in part by modern instrumentation that allows aerosol composition analyses to be performed online and in a greater detail than before (Mc-Murry, 2000; Canagaratna et al., 2007). The object of the Puerto Rico Aerosol Cloud Interaction Study (PRACS) pre-sented here was to perform detailed in situ measurements of both aerosol and cloud properties in a tropical environment at two sites simultaneously and compare the two in a “quasi Lagrangian” framework, as has been used in studies at other locations (e.g. Bower et al., 1999).
Puerto Rico is a tropical, Caribbean island whose fair weather climate is dominated by north-easterly trade winds. The island has been the site of a number of studies to mea-sure the properties of aerosols in clean, maritime flow, taking advantage of air that is devoid of major anthropogenic influ-ences. The second feature of Puerto Rico that makes it an attractive site for atmospheric research is the high frequency with which clouds envelop the mountain peaks and provides a region where the interaction of aerosols with clouds can be studied over extended periods of time. The first stud-ies of this type were made in 1992 at the El Yunque moun-tain site (Novakov and Penner, 1993; Novakov et al., 1994). Sulphate and organic carbon (OC) were analyzed on aerosol samples taken with an eight stage micro-orifice uniform de-posit impactor (MOUDI) and compared with measurements of condensation nuclei (CN) and cloud condensation nuclei (CCN). An inversion algorithm was invoked in order to
esti-mate the number concentration as a function of size so that the mass distributions could be used to derive CCN compo-sition. From these studies it was estimated that 37% of CCN were composed of sulphate with the remainder composed of OC. A relationship between CCN and non-sea salt (nss) sul-phate was derived for clear and cloudy conditions and a good agreement was found between pre-cloud CCN and droplet concentrations. While sulphate constituted a large fraction of CCN mass, the researchers concluded that this had been added to the particles through processing after activation and therefore did not affect the initial CCN number concentra-tions, which were more dependent on the sea spray fraction. In a follow-up study, measurements were made in 1995 at the Cape San Juan lighthouse located on the northeast corner of the island (Novakov et al., 1997). Analysis of aerosol par-ticles less than 0.6 µm in diameter, captured on quartz filters, showed that a large fraction of the OC was water soluble. In another project concluded in 1998, a chemical analysis of the OC in aerosol particles in regions upwind and to the NE of Puerto Rico showed that black carbon concentrations were low-to-non detectable and that there were no polycyclic aro-matic hydrocarbons (PAHs) in the OC (Mayol-Bracero et al., 2001), suggesting that the OC was likely of natural origin. Another study at the same lighthouse location of Novakov et al. (1997) was conducted in 1999 using a MOUDI (Kirch-stetter et al., 2000), but with a denuder to remove the posi-tive artefacts produced by condensation of organic gases on the filters. The primary result from this experiment was to show that the non-anthropogenic OC is highly volatile and, perhaps even more importantly, that results from filter mea-surements should be interpreted with caution when sampling organics, otherwise serious artefacts can arise.
Evaluation of filters taken further upwind (Maria et al., 2002) from aircraft near St. Croix revealed that 60–90% of organic matter in the free troposphere was water soluble, with hydrophobic organic compounds accounting for 20– 50% of the organic matter in the marine boundary layer. In an evaluation of how aerosols may affect cloud formation over Puerto Rico, Comarazamy et al. (2006) examined the effect of aerosols on precipitation rate using a sun photome-ter to estimate aerosol loading and a cloud model to predict precipitation at the Arecibo Observatory. They predicted that cloud droplet concentrations are significantly larger and the precipitation diminished when formed in polluted air.
Following on from these works, a period of intensive mea-surements was conducted in Puerto Rico in December 2004, with the goal of improving further our understanding of warm cloud formation in a tropical marine environment and the role of marine organic aerosols though the use of some of the latest developments in online instrumentation, such as aerosol mass spectrometers, cloud condensation nuclei coun-ters and a hygroscopicity tandem differential mobility anal-yser. While the previous studies provided valuable insights into potentially important processes, most of the composition measurements were made using bulk sampling methods that
18.50 18.45 18.40 18.35 18.30 18.25 18.20 18.15 L a ti tu d e ( °N ) -65.90 -65.85 -65.80 -65.75 -65.70 -65.65 -65.60 Longitude (°E) 1000 800 600 400 200 0 E le v a tio n (m a m s l)
Cape San Juan Lighthouse East Peak NADP Site El Yunque 20 19 18 17 16 15 14 -68 -66 -64 -62 -60
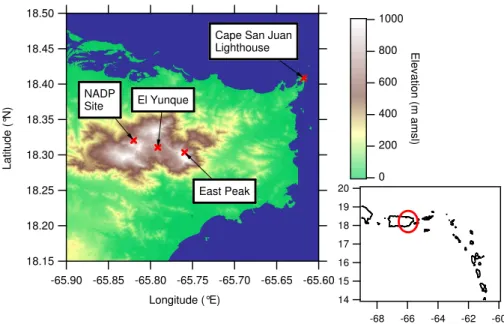
Fig. 1. Map of eastern Puerto Rico showing the Cape San Juan and East Peak sampling sites. Shown also is the site of the rain water sampler
used by the National Acid Deposition Project (NADP) and the El Yunque site where previous aerosol measurements have been made.
require substantial exposure times to acquire a sample that is adequate for chemical analysis and that are susceptible to artefacts that contaminate the samples. Recent developments in the field of aerosol instrumentation have allowed the quan-tification of the composition and the hygroscopic properties of atmospheric aerosols online with high size and time res-olution. These instruments have been in use for some time in northern mid-latitude environments (Zhang et al., 2007); however, their application to tropical locations has been very limited. Here we present measurements of aerosol proper-ties measured using these instruments simultaneously at the Cape San Juan lighthouse and at East Peak, a mountain site in the El Yunque National Forest, and evaluate their relation-ships with meteorological conditions and cloud properties, also measured in situ. These sites are subsequently referred to as CSJ and EP, respectively, in this paper.
2 Measurement and analysis methodology
Figure 1 shows the locations of the measurement sites, CSJ (18◦22.85′N, 65◦37.07′W) located at the northeast tip of the
island and EP (18◦18.21′N, 65◦45.57′W), one of the highest
points on the island (1040 m a.m.s.l.) and the farthest to the NE. The line of sight distance to the lighthouse installation was 17 km. This location is close to El Yunque peak where previous measurements have been made of aerosol compo-sition and cloud properties (Novakov and Penner, 1993; No-vakov et al., 1994) and is also close to the precipitation sam-pler (18◦19.35′N, 65◦49.22′W, 380 m a.m.s.l.) that is oper-ated as part of the National Atmospheric Deposition Program
(NADP). The EP site experienced a layer of boundary-layer convective cloud on most days during these measurements.
The aerosol properties measured at each site were 1) con-centrations of CN and CCN, 2) particle number size distribu-tions, 3) light absorption coefficients, 4) particle mass con-centrations of sulphate, nitrate, ammonium and organic mat-ter and 5) sub-saturated hygroscopic growth factors (light-house site only). The list of instrumentation is summarized in Table 1. All commercial instrumentation was operated un-der the manufacturer’s normal operating procedures unless stated otherwise. The instruments that were operated at Cape San Juan were connected to a standard NOAA ESRL GMD1 aerosol inlet system that consists of a 10 m stack, a heater that maintained the relative humidity below 40% and a flow splitter (Sheridan et al., 2001).
Both of the Aerodyne aerosol mass spectrometer (AMS) systems were of the type originally introduced by Jayne et al. (2000) and used the data analysis methods described by Allan et al. (2004b, 2003). This system uses aerodynamic sizing, thermal vaporization, 70 eV electron ionization and quadrupole mass spectrometry to deliver the size-resolved mass concentrations for the non-refractory, submicron com-ponent of the aerosol. This means that it is capable of mea-suring sulphate, particulate organic matter (POM), ammo-nium and nitrate, but is incapable of detecting elemental car-bon, sea salt or mineral dust. In the absence of a reliable
1Global Monitoring Division, National Oceanic and
Atmo-spheric Administration Earth System Research Laboratory, Boul-der, CO, USA; http://www.cmdl.noaa.gov/aero/instrumentation/ inlet system.html; http://www.esrl.noaa.gov/gmd/aero/net/index. html
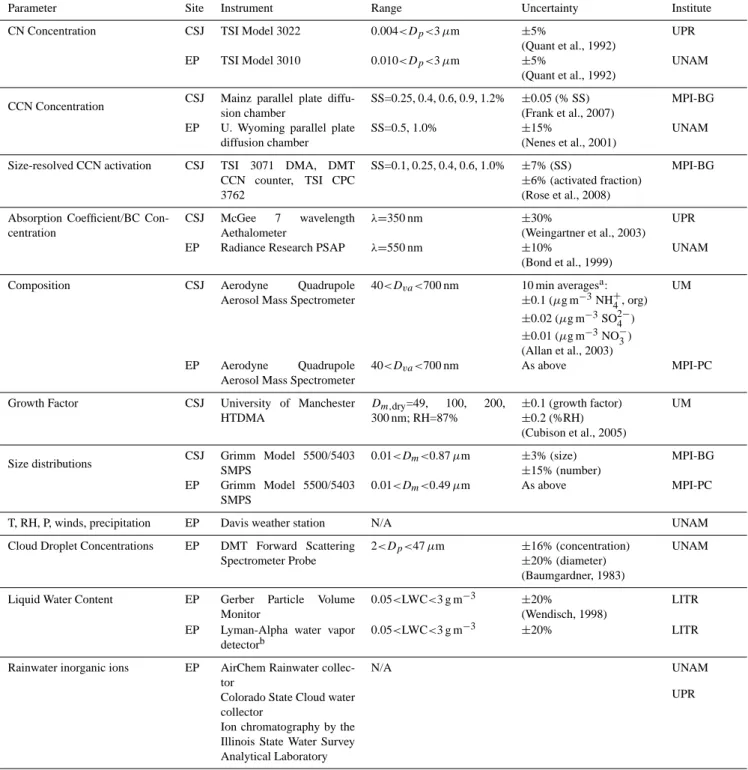
Table 1. List of instrumentation used during the project. The two sites are listed in the second column and referred to as: CSJ = Cape San Juan
lighthouse and EP = East Peak. Diameter metric conventions are Dp= physical, Dva= vacuum aerodynamic, Dm= electrostatic mobility (DeCarlo et al., 2004). The last column lists the research institute that owns the instrumentation: UPR = University of Puerto Rico; UNAM = Universidad Nacional Aut´onoma de M´exico, MPI-BG = Biogeochemistry Dept., Max Planck Institute for Chemistry; UM = University of Manchester, MPI-PC: Particle Chemistry Dept., Max Planck Institute for Chemistry/University of Mainz; LITR = Leibniz-Institute for Tropospheric Research.
Parameter Site Instrument Range Uncertainty Institute CN Concentration CSJ TSI Model 3022 0.004<Dp<3 µm ±5%
(Quant et al., 1992)
UPR EP TSI Model 3010 0.010<Dp<3 µm ±5%
(Quant et al., 1992)
UNAM
CCN Concentration CSJ Mainz parallel plate diffu-sion chamber SS=0.25, 0.4, 0.6, 0.9, 1.2% ±0.05 (% SS)(Frank et al., 2007) MPI-BG EP U. Wyoming parallel plate
diffusion chamber
SS=0.5, 1.0% ±15%
(Nenes et al., 2001)
UNAM
Size-resolved CCN activation CSJ TSI 3071 DMA, DMT CCN counter, TSI CPC 3762 SS=0.1, 0.25, 0.4, 0.6, 1.0% ±7% (SS) ±6% (activated fraction) (Rose et al., 2008) MPI-BG
Absorption Coefficient/BC Con-centration CSJ McGee 7 wavelength Aethalometer λ=350 nm ±30% (Weingartner et al., 2003) UPR EP Radiance Research PSAP λ=550 nm ±10%
(Bond et al., 1999)
UNAM
Composition CSJ Aerodyne Quadrupole Aerosol Mass Spectrometer
40<Dva<700 nm 10 min averagesa: ±0.1 (µg m−3NH+ 4, org) ±0.02 (µg m−3SO2−4 ) ±0.01 (µg m−3NO−3) (Allan et al., 2003) UM EP Aerodyne Quadrupole Aerosol Mass Spectrometer
40<Dva<700 nm As above MPI-PC
Growth Factor CSJ University of Manchester HTDMA Dm,dry=49, 100, 200, 300 nm; RH=87% ±0.1 (growth factor) ±0.2 (%RH) (Cubison et al., 2005) UM
Size distributions CSJ Grimm Model 5500/5403 SMPS 0.01<Dm<0.87 µm ±3% (size) ±15% (number) MPI-BG EP Grimm Model 5500/5403 SMPS 0.01<Dm<0.49 µm As above MPI-PC
T, RH, P, winds, precipitation EP Davis weather station N/A UNAM Cloud Droplet Concentrations EP DMT Forward Scattering
Spectrometer Probe
2<Dp<47 µm ±16% (concentration)
±20% (diameter) (Baumgardner, 1983)
UNAM
Liquid Water Content EP Gerber Particle Volume Monitor
0.05<LWC<3 g m−3 ±20%
(Wendisch, 1998)
LITR EP Lyman-Alpha water vapor
detectorb
0.05<LWC<3 g m−3 ±20% LITR
Rainwater inorganic ions EP AirChem Rainwater collec-tor
Colorado State Cloud water collector
Ion chromatography by the Illinois State Water Survey Analytical Laboratory
N/A UNAM
UPR
aFor longer averaging periods, the uncertainty is reduced in proportion to the square root of the averaging time bUsed to evaluate CVI sampling characteristics
external constraint, a collection efficiency of 0.5 was as-sumed based on validations performed in similar environ-ments (Allan et al., 2004a). The equivalent black carbon (EBC) values are derived from an Aethalometer (Magee Sci-entific) and Particle Soot Absorption Photometer (PSAP, Ra-diance Research) using specific absorbencies of 19 m2g−1 and 10 m2g−1, respectively. These factors are by no means definitive (Bond and Bergstrom, 2006), but uncertainty in this factor will not effect the conclusions of our study given that the EBC is reported here only as a qualitative indicator for the presence of anthropogenic particles.
The design of the hygroscopicity tandem differential mo-bility analyzer (HTDMA) is given by Cubison et al. (2005) and a multi-triangle inversion method was applied (Gysel et al., 2007). This is an instrument designed to study the amount of water vapour taken up by dried, monodisperse aerosols exposed to high relative humidity (87% was used during this study), which is related to the mixing states and water activity of the particle constituents. Two of the CCN counters used to measure total concentrations used the paral-lel plate diffusion chamber technique. The counter deployed at the lighthouse is an in-house design developed at the Max Planck Institute (Frank et al., 2007) and the counter used at East Peak is the University of Wyoming model 101 (Delene and Deshler, 2000; Delene et al., 1998). These are designed to count the number of particles that activate at selected su-persaturations, thereby helping to predict the fraction of par-ticles that will activate and form cloud droplets under a given cloud scenario. Additionally, size resolved CCN spectra were measured at CSJ using a Droplet Measurement Tech-nologies continuous flow CCN counter (Lance et al., 2006; Rose et al., 2008; Roberts and Nenes, 2005) coupled to a Differential Mobility Analyzer (TSI 3071), to derived size-resolved CCN spectra as described in Frank et al. (2007). Both CCN counters operated at CSJ were calibrated with re-spect to supersaturation and counting efficiency using ammo-nium sulphate particles according to the method described in Frank et al. (2007). The two scanning mobility particle sizers (SMPS) were included to measure the aerosol size distribu-tions.
At the mountain site, cloud and rain water samples were taken for chemical analysis of the ion mass content. The precipitation sampler is the same model used by the NADP network (AirChem Inc.) and the cloud water sampler a Cal-tech Active Strand Cloud Collector Version 2 (Demoz et al., 1996), provided by Colorado State University. The cloud and water samples were sent to the Illinois State Water Sur-vey Analytical Laboratory for analysis of pH and inorganic ion mass. This institute performs the analysis for all the sam-ples collected by the NADP. The number, volume concentra-tion and size distribuconcentra-tion of insoluble particles in the cloud and rain water samples were analyzed at Forschungszen-trum J¨ulich, Germany, with a Beckmann Multisizer 3 Coulter Counter that measures from 0.4 to 1.2 µm. In addition, the ion mass is derived from pH and conductivity measurements
as described by Kr¨amer et al. (1996). The cloud droplet size distributions were measured with a Forward Scattering Spec-trometer Probe (FSSP, Droplet Measurement Technologies, Boulder, USA) and the liquid water content (LWC) was mea-sured with a Particle Volume Monitor (PVM, Gerber Asso-ciates). An automated meteorological station (Davis Instru-ments) measured temperature, relative humidity, pressure, winds and precipitation.
Part of the instrumentation at East Peak was installed in a trailer located directly at the edge of an overlook facing the lighthouse. Three types of inlets were used to sample the aerosols: 1) total, 2) interstitial and 3) a counter flow vir-tual impactor (CVI). Air from the “total” inlet was heated to 50◦C to dry the aerosol particles and evaporate water droplets when in cloud; hence, the particles measured from this inlet include interstitial particles and cloud droplet nuclei, when sampling cloudy air. The interstitial inlet separated water droplets from the air stream with an impactor (upper cut-size of 4 µm), such that only non-activated particles would be measured when in cloud. The remaining inlet, a CVI with a lower cut-size diameter of 5 µm (Mertes et al., 2005), re-moved the interstitial particles, evaporated the water droplets and allowed the residual nuclei to be delivered to the aerosol instrumentation. The AMS and the SMPS alternated between the CVI and interstitial inlet. Due to technical problems, the AMS at East Peak was only operated between 8 December and 11 December. To eliminate any possible influence from a nearby generator, any data coincident with the EBC being greater than 3 standard deviations from the mean were ex-cluded from the analysis.
The PVM was mounted on the roof of the trailer and the FSSP was installed horizontally on the roof of a small building approximately 10 m from the PVM. No aspirator was used to maintain a constant velocity of droplets through the FSSP but the prevailing wind maintained a steady flow through the probe from 2 to 10 m s−1 and the probe was aligned as close to parallel with the wind direction as pos-sible. Given that the variable velocity through the FSSP was not directly measured, the flow volume was estimated by ad-justing the sample volume such that the liquid water content (LWC) derived from the measured size distribution matched the LWC measured directly with the PVM. This approach was taken since the PVM is considered more accurate than the FSSP for measuring LWC when the mass is dominated by droplets less 30 µm (Wendisch, 1998) whereas the FSSP is an accurate droplet counting instrument. Assuming that the sizing by the FSSP is accurate to within 20%, the uncer-tainty in LWC is approximately 35% (Baumgardner, 1983). This leads to an estimated uncertainty in the derived sample volume of approximately 38%, assuming that the PVM has an accuracy of 15%, as cited by the manufacturer. Hence, the number concentration, derived from the FSSP droplet count divided by the sample volume, has an uncertainty of 38%, assuming negligible counting losses due to coincidence. The FSSP was only operated during daylight hours given staff
limitations but all the other instrumentation, at both measure-ment sites, were operated 24 h a day during the project.
3 Results
3.1 Overview
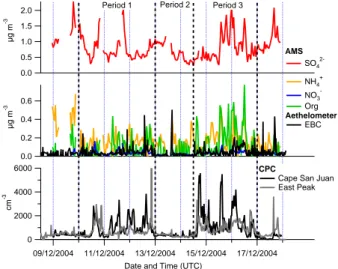
The measurements took place over the period 9–18 Decem-ber 2004. The winds were east southeast (ESE) during the first three days, changing to the east northeast (ENE) on 13 December then back ESE on 15 December where they remained throughout the rest of the measurement program. While at no point were the two sites explicitly linked in a true Lagrangian manner, it is reasonable to assume that given their proximity, the measured compositions will be similar enough to make statements regarding the variations in com-position of the regional aerosol. This assumption is backed up by the similarity in the CN concentration time series be-tween the two sites shown in Fig. 2. Using principally the CN concentration and EBC mass concentrations, in conjunction with meteorological data, the observations during the cam-paign were stratified into three periods defined as “polluted”, “clean” and “polluted”. These time intervals, henceforth re-ferred to as periods 1, 2 and 3, are shown in the time series of Figs. 2 and 3, along with the concentrations of CN and CCN, mean hygroscopic growth factors and mass concentra-tions of inorganic ions, POM and EBC, all measured at the lighthouse. Table 2 lists the averages and standard deviations for these parameters during the three periods, as well as the EBC, CN, CCN and AMS-derived mass concentrations mea-sured at East Peak. The spikes seen in the EBC time series are indicative of local pollution and the corresponding times were excluded from the averages.
The average CN concentrations measured at the two sites changed by approximately the same amount between the pe-riods although the concentration at the East Peak was always somewhat higher. Periods 1 and 3 have much higher CN and the mass concentrations of OC and EBC at the light-house are also elevated, which is manifested in the reduced growth factors of the aerosol, possibly as a result of the ad-dition of lower solubility material. This behaviour is most pronounced for period 3. There are more CCN during the polluted episodes but there are less relative to the number of CN, since CN increased by a factor of greater than 3, whereas CCN increased by a factor of 2.
3.2 Cape San Juan
The AMS-measured nitrate was also found to have increased during period 3, although it must be noted that this is proba-bly mainly in the form of sodium nitrate in sea salt particles, as nitrate does not coexist with sulphate on acidic particles. This is further supported by the fact that the overwhelming majority of nitrate signal is contained within m/z30 as op-posed to 46, which can be indicative of sodium as opop-posed to
0.6 0.4 0.2 0.0 µg m -3 09/12/2004 11/12/2004 13/12/2004 15/12/2004 17/12/2004 Date and Time (UTC)
2.0 1.5 1.0 0.5 0.0 µg m -3 6000 4000 2000 0 cm -3 NH4 + NO3 Org Aethelometer EBC AMS SO4 2-CPC
Cape San Juan East Peak Period 1 Period 2 Period 3
Fig. 2. Overview of the online aerosol measurements at the Cape
San Juan site. The AMS data has been averaged down to a 1-h resolution for clarity. The CPC data from the East Peak site is also included to demonstrate the linkage between the two sites. ammonium nitrate (Allan et al., 2004a; Topping et al., 2004). If this is the case, the values reported by the AMS will gen-erally be low compared to the actual total concentrations, as sea salt particles are not detected efficiently due to their size and low volatility. POM concentrations are generally very low but these too show an increase during periods 1 and 3. The ratio of POM to EBC during period 3, the period when the most significant amounts of carbonaceous aerosols were observed, was 2.66. This is greater than the primary OM/EC ratio of 1.4 reported by Zhang et al. (2005), which is to be expected, as there is likely to be a secondary organic com-ponent here. If an OM/OC ratio of 2.1 is assumed (Turpin and Lim, 2001), this corresponds to an OC/BC ratio of 1.27, which is close to the OC/BC ratios ranging from 1.3 to 2.4 reported by Novakov et al. (2005). However, as stated ear-lier, the absolute values of the EBC are to be treated with caution, especially at low black carbon concentrations where positive artefacts due to scattering and weakly absorbing ma-terial such as dust may be greatest. The fact that POM, EBC and CN exhibit such marked increases implies that they are linked, probably through the presence of sooty primary emis-sions in the form of small Aitken-mode particles. In the sec-ond period when the site was exposed to air from the clean northeasterly sector, there are reductions in POM and EBC to the point of being at or below the detection limits.
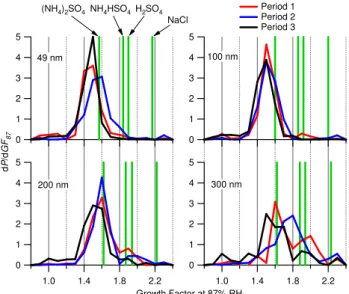
The growth factor spectra recorded by the HTDMA shown in Fig. 4 generally show a consistent mode around a growth factor of 1.5–1.6. This is quite close to the growth factors that are predicted for ammonium sulphate by the model of Topping et al. (2005a) (1.57, 1.60, 1.62 and 1.62 for dry diameters of 49, 100, 200 and 300 nm, respectively2), but
2D. O. Topping, University of Manchester, personal
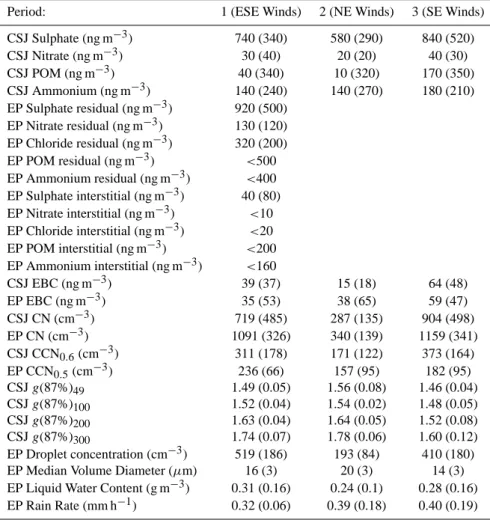
Table 2. Averages of the AMS-derived composition, CN, CCN, humidity growth factor and cloud properties as a function of the different
periods observed during the field campaign. CSJ = Cape San Juan lighthouse, EP=East Peak. Numbers in parentheses are standard deviations. Data for the EP AMS was unavailable for periods 2 and 3.
Period: 1 (ESE Winds) 2 (NE Winds) 3 (SE Winds)
CSJ Sulphate (ng m−3) 740 (340) 580 (290) 840 (520) CSJ Nitrate (ng m−3) 30 (40) 20 (20) 40 (30) CSJ POM (ng m−3) 40 (340) 10 (320) 170 (350) CSJ Ammonium (ng m−3) 140 (240) 140 (270) 180 (210) EP Sulphate residual (ng m−3) 920 (500) EP Nitrate residual (ng m−3) 130 (120) EP Chloride residual (ng m−3) 320 (200) EP POM residual (ng m−3) <500 EP Ammonium residual (ng m−3) <400 EP Sulphate interstitial (ng m−3) 40 (80) EP Nitrate interstitial (ng m−3) <10 EP Chloride interstitial (ng m−3) <20 EP POM interstitial (ng m−3) <200 EP Ammonium interstitial (ng m−3) <160 CSJ EBC (ng m−3) 39 (37) 15 (18) 64 (48) EP EBC (ng m−3) 35 (53) 38 (65) 59 (47) CSJ CN (cm−3) 719 (485) 287 (135) 904 (498) EP CN (cm−3) 1091 (326) 340 (139) 1159 (341) CSJ CCN0.6(cm−3) 311 (178) 171 (122) 373 (164) EP CCN0.5(cm−3) 236 (66) 157 (95) 182 (95) CSJ g(87%)49 1.49 (0.05) 1.56 (0.08) 1.46 (0.04) CSJ g(87%)100 1.52 (0.04) 1.54 (0.02) 1.48 (0.05) CSJ g(87%)200 1.63 (0.04) 1.64 (0.05) 1.52 (0.08) CSJ g(87%)300 1.74 (0.07) 1.78 (0.06) 1.60 (0.12) EP Droplet concentration (cm−3) 519 (186) 193 (84) 410 (180)
EP Median Volume Diameter (µm) 16 (3) 20 (3) 14 (3)
EP Liquid Water Content (g m−3) 0.31 (0.16) 0.24 (0.1) 0.28 (0.16) EP Rain Rate (mm h−1) 0.32 (0.06) 0.39 (0.18) 0.40 (0.19)
lower than what would be expected for ammonium bisul-phate (1.84, 1.86, 1.87 and 1.88). It may be that the parti-cles are principally ammonium sulphate or they are a more acidified form of sulphate that is internally mixed with a less soluble component. The latter is deemed unlikely given the consistency of the growth factors, which would require a constant mass ratio between the two components to achieve this. Unfortunately, without adequate size-resolved ammo-nium measurements from the AMS (which are not possible in this experiment due to signal-to-noise limitations), it is difficult to definitively say which is happening. In addition to the main mode, there is frequently an additional compo-nent of high growth factor (≈2) particles, in particular for the larger dry sizes. These are almost certainly sea spray particles, although their growth factors are often lower than those expected of pure sodium chloride. This could be due to processing (the predicted growth factor of sodium nitrate is around 18% lower), or an internally mixed component of reduced solubility. However, the fact that this activity is
gen-erally less significant than the principle mode shows that the majority of particles of these dry sizes are not of this type, so will be less significant a fraction of the total number. Dur-ing period 2, the modal growth factor for 300 nm particles increases to around 1.7, which could be indicative of more acidic sulphate particles. During period 3 (and to a lesser extent period 1), the main mode persists, but a significant “shoulder” of particles of a growth factor of less than 1.2 ap-pears, which is likely to be externally mixed soot particles, consistent with the increased EBC and POM concentrations measured.
The hygroscopic behaviour is also reflected in the CCN measurements. Figure 5 shows size-resolved CCN activa-tion efficiencies as a funcactiva-tion of different supersaturaactiva-tions for parts of periods 1 and 2 (data for period 3 were unavailable). During period 1, the small particles (<100 nm) are less eas-ily activated compared to period 2 and the CCN spectra do not always reach unity at high supersaturations. This is in agreement with the lower HTDMA growth factors observed
5000 4000 3000 2000 1000 0 c m -3 09/12/2004 11/12/2004 13/12/2004 15/12/2004 17/12/2004 Date and Time (UTC)
1.8 1.7 1.6 1.5 1.4 G F8 7 CPC Total CCN SS (%) 0.6 0.4 0.25 Period 1 Period 2 Period 3
Fig. 3. CCN number concentrations and mean HTDMA growth
factors measured at the Cape San Juan site. The CCN fractions are the ratios of CCN concentrations to CPC counts.
5 4 3 2 1 0 d P /d G F8 7 2.2 1.8 1.4 1.0 Growth Factor at 87% RH 5 4 3 2 1 0 2.2 1.8 1.4 1.0 5 4 3 2 1 0 5 4 3 2 1 0 Period 1 Period 2 Period 3 49 nm 100 nm 200 nm 300 nm (NH4)2SO4NH4HSO4H2SO4 NaCl
Fig. 4. Retrieved HTDMA growth factor spectra (as normalised
frequency distributions) from the Cape San Juan site divided into the three periods identified in the text. Predicted growth factors for ammonium sulphate, ammonium bisulphate, sulphuric acid and sodium chloride are also show, based on the model of Topping et al. (2005a). Within the measurement uncertainties, the modes of the spectra are close to the predicted growth factors of ammonium sulphate. Note the absence of a low growth factor mode during period 2.
during this period (Fig. 4) and is consistent with there being an increased number of POM-containing Aitken mode parti-cles, assuming that these particles are less hygroscopic than the inorganic particles. The activation diameters for pure
am-1.0 0.8 0.6 0.4 0.2 0.0 Activated Fraction 2 3 4 5 6 7 8 9 100 Mobility Diameter (nm) 1.0 0.8 0.6 0.4 0.2 0.0 0.1% 0.25% 0.39% 0.6% 1.0% Period 1 Period 2
Fig. 5. Size-resolved CCN activation efficiencies for periods 1 and
2, taken from the DMA-DMT CCN instrument configuration. The dashed vertical lines are theoretical activation diameters for pure ammonium sulphate particles for the supersaturations used during measurement (0.1, 0.25, 0.39, 0.6 and 1.0%). No data is available for period 3.
monium sulphate were calculated using the K¨ohler equation with a variable Van’t Hoff factor as is used in the calibration of the CCN counters (Frank et al., 2007) and are shown as dashed vertical lines on the figure. The activation behaviour is roughly consistent with these during in period 1, also in agreement with the HTDMA growth factors. In period 2 the particles are, in some cases, somewhat more CCN-active than pure ammonium sulphate, especially for the smaller par-ticles. This could, much like the HTDMA growth factors, indicate the presence of acidified sulphate particles. Sea salt particles could also be responsible, but as these are mechani-cally generated, a bias in this discrepancy towards the larger dry sizes would be expected, which is not the case here.
The frequency distributions shown in Fig. 6 highlight the differences in some of the aerosol properties related to air mass origins. The frequency of occurrence for each of the three cases (red, blue and black) is given as a percentage of all events during the respective time periods. The same num-ber of intervals is used for the three cases and for each aerosol parameter. Overall, the measurements during period 3 show the most signs of influence from anthropogenic emissions. The average values of the CN at the lighthouse and East Peak change by a factor of more than three during periods of SE winds, although there are large variations during both clean and polluted periods as seen in the standard deviations. The CCN concentration, measured at 0.6% supersaturation was on average less than 200 cm−3during the clean period at the lighthouse but more than doubled between the second and
Fig. 6. Frequency distributions of CN, CCN and EBC
concentra-tions during the three periods at the different sites.
third periods. The EBC at East Peak is similar between peri-ods 1 and 2, then increases by nearly a factor of two between periods 2 and 3.
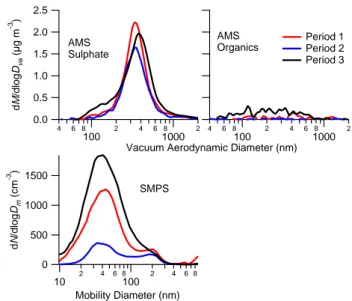
The variations in particle composition are also evident when comparing the averaged size distributions measured with the scanning mobility particle sizer (SMPS). As shown in Fig. 7, the overall number concentrations of Aitken mode (Dm<100 nm) particles are significantly elevated for
peri-ods 1 and 3, which will be manifested in the total CN and CCN number concentrations. In the accumulation mode (Dm≈200 nm), the increases during periods 1 and 3 are more
subtle, but are also evident in the AMS sulphate mass dis-tributions from the lighthouse. All of the disdis-tributions also contain a “shoulder” in the lower particle diameters, which corresponds to the Aitken modes in the number distributions. A discernable organic mass distribution is only found during period 3, which is more biased towards the smaller particle sizes compared to sulphate, consistent with it being associ-ated with smaller primary particles.
1500 1000 500 0 d N /dlog Dm (cm -3 ) 10 2 4 6 8100 2 4 6 8 Mobility Diameter (nm) 2.5 2.0 1.5 1.0 0.5 0.0 d M /dlog Dva (µg m -3 ) 4 6 8 100 2 4 6 81000 2 4 6 8100 2 4 6 81000 2
Vacuum Aerodynamic Diameter (nm) Period 1 Period 2 Period 3 SMPS AMS Sulphate AMS Organics
Fig. 7. Cape San Juan particle mass and number distributions for
the three identified periods. Due to signal-to-noise limitations, only sulphate and organic distributions could be reliably derived from the AMS data. 0 1 2 3 4 Io n M a s s ( m g l -1) NADP Historical Period 1 Period 2 Period 3 Na+ Cl- NO 3- (nss)SO42- (ss)SO42- NH4
-Fig. 8. Average inorganic solute composition of cloud and rainwater
samples for the three periods, with the historical NADP data shown for comparison.
3.3 East Peak
The difference in air mass origin during the three periods was also manifested at the East Peak in the cloud/rain wa-ter chemistry. Figure 8 shows the mass concentrations of selected ions, stratified by time period. Also shown in this figure are averages from the NADP archives from 1985 to 2005. The major component during all periods was sea salt. The sea salt (ss) sulphate, calculated using a mass ratio of SO2−4 to Na+ of 0.252 (Quinn et al., 2000). The concen-trations of non-sea salt (nss) sulphate and nitrate were sig-nificantly greater in the third period compared to the other
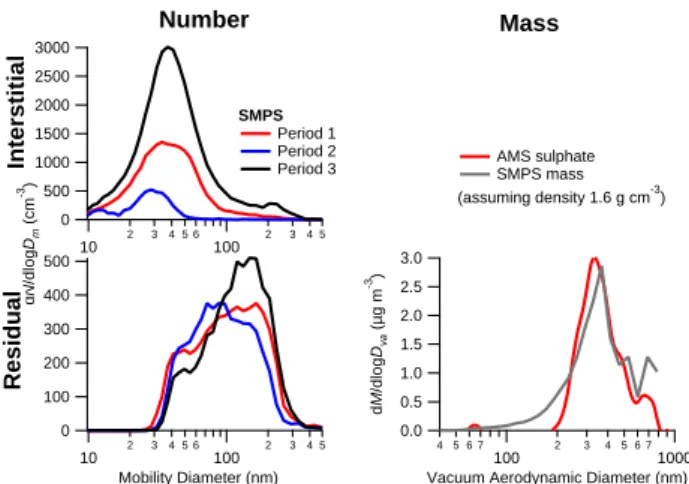
500 400 300 200 100 0 d N /dlog Dm (cm -3) 10 2 3 4 5 6 100 2 3 4 5 Mobility Diameter (nm) 3000 2500 2000 1500 1000 500 0 10 2 3 4 5 6 100 2 3 4 5 3.0 2.5 2.0 1.5 1.0 0.5 0.0 d M /dlog Dva (µg m -3) 4 5 6 7 100 2 3 4 5 6 7 1000 Vacuum Aerodynamic Diameter (nm)
SMPS Period 1 Period 2 Period 3 Interstitial Residual AMS sulphate SMPS mass (assuming density 1.6 g cm-3) Number Mass
Fig. 9. Interstitial and cloud residual size distributions for the three
periods as measured using the SMPS at East Peak. Also included is the averaged residual chemical mass distribution of residual par-ticles measured with the AMS connected to the CVI on 10 Decem-ber, although only sulphate is included, as this was the only species above detection limit for size-resolved data.
periods, probably due to the oxidation of anthropogenic SO2
and NOx. It is also of interest to note that the chloride to
sodium ratio was much smaller during period 3, which indi-cates that some of the chloride will have been displaced by the uptake of nitric and/or sulphuric acid onto the sea salt particles. The same conclusions were reached during mea-surements performed in January 2005 at the same site as part of the Rain In Cumulus over the Ocean experiment (Gioda et al., 20083).
Due to technical issues, the data coverage of composi-tion measurements using the AMS downstream of the CVI at East Peak was not extensive, but the data that were col-lected during part of period 1 (only on 10 December) con-sistently showed particle residuals mainly composed of sul-phate, with small amounts of nitrate and chloride (Table 2). The detection limit for organic matter of the AMS operated on East Peak was 0.2 µg m−3 for the averaged time period. The cloud residual data has to include corrections due to the CVI sampling efficiency and enrichment, which equate to factors of 10 and 0.25, respectively, yielding an ambient de-tection limit of 0.5 µg m−3. The average concentration of or-ganic matter was clearly below this detection limit. Figure 9 shows a size distribution of the droplet residual aerosol mass concentration of sulphate compared with a mass size distri-bution estimated from the SMPS. Chloride size distridistri-butions were not recorded. The size distribution is very similar to that measured by the AMS at CSJ (Fig. 7). Adding up the AMS
3Gioda, A., Mayol-Bracero, O. L., Morales-Garc´ıa, F., Collett,
J., Decesari, S., Emblico, L., Facchini, M. C., Morales-De Jes´us, R. J., Mertes, S., Borrmann, S., Walter, S., and Schneider, J.: Chem-ical composition of cloud water in the Puerto Rican tropChem-ical trade winds, Water Air Soil Poll., submitted, 2008.
mass concentrations leads to a slightly greater total than what can be inferred from the SMPS data, which is probably due to uncertainties in the particle density and AMS collection efficiency. Through the absence of any measurable organics, these results suggest that no significant amounts of submi-cron organic particles (primary or secondary) were emitted by the rain forest or human activity in the intervening dis-tance between the site and the coast. In the interstitial aerosol measured at East Peak all substances detectable by the AMS were below detection limit with the exception of sulphate (Table 2). The measured sulphate mass concentrations in the cloud residuals were higher by a factor of about 20. While it is possible that some of the mass could have been added in the cloud through aqueous processes, the fact that very little remained in the interstitial aerosol indicates that almost all sulphate-containing particles were activated as CCN.
Sodium chloride would probably dominate the larger residual particles but this is undetectable by the AMS. In spite of this, significant amounts of chloride (detected as HCl+ after ionisation) were measured by the AMS in the residuals at East Peak, but not in the interstitial aerosol. A speculative explanation for this finding may be that aqueous chloride is displaced by sulphate and nitrate absorbed within the cloud and converted to HCl as the cloud droplet dries in the CVI. Being volatile, this is expected to evaporate from the particle, but a fraction may not have time before the aerosol is passed to the instrument, so will be detected on the particles by the AMS.
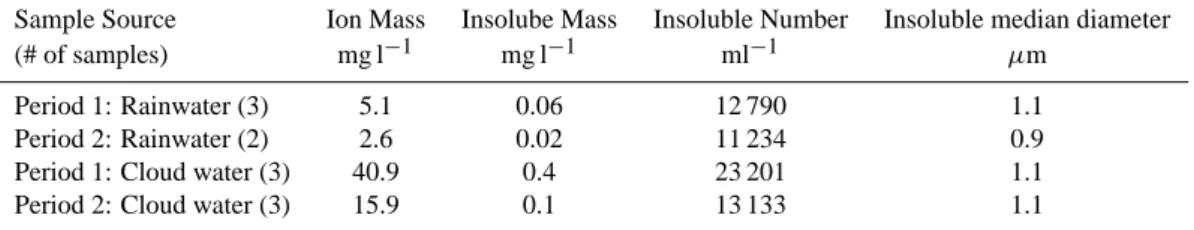
An analysis of the total ion mass, insoluble mass, insolu-ble particle number concentrations and median diameter of the insoluble particles in the cloud and rain water samples is listed in Table 4 for periods 1 and 2. The total ion mass and insoluble mass in the cloud water is nearly ten times more than measured in the rain water. The total ion mass and insol-uble mass decrease by more than a factor of two between the first and second periods. The insoluble mass may be sooty particles or possibly dust. There is little change in the me-dian insoluble particle diameter between periods 1 and 2 for either the cloud or rain water samples.
In an effort to better understand the activation behaviour of the particles, the SMPS size distributions were compared be-tween the times spent sampling via the CVI residual line and the interstitial inlet during cloudy periods (defined as those time intervals when the LWC was greater than 0.1 g m−3 and the cloud droplet number concentration greater than 100 cm−3 for at least twenty minutes). The averaged
dis-tributions are shown in Fig. 9. In addition to the larger num-bers of interstitial particles overall, the more polluted cases show a significant number of larger particles that are not ac-tivated within the clouds. The interstitial particles observed during period 1 are very small (30–60 nm), which due to their small size are not expected to contribute significantly to the chemical mass concentrations. Period 3 shows significant numbers of non-activated particles of sizes up to 300 nm, whereas in period 2, there are few particles above 50 nm that
are not activated. These particles must be lower-solubility particles, externally mixed and with higher critical supersat-urations than those that activate in the cloud. The HTDMA growth factor distributions at CSJ confirm the presence of a fraction of externally mixed non-hygroscopic particles at dry size 300 nm during period 3, indicating the presence of a lower solubility component. In the residual particles, the number of particles smaller than 80 nm is fewest in period 3 and greatest during period 2, which may be another mani-festation of the increase in the overall solubility of particles, although the addition of secondary material in polluted con-ditions through aqueous processes in the cloud may be partly responsible for an increase in the size of the residual particles (Chandler et al., 1989).
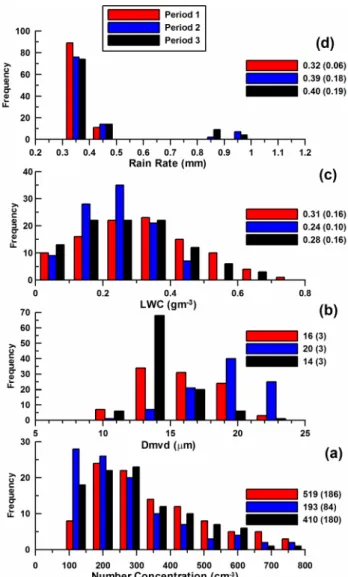
The frequency diagrams shown in Fig. 10 illustrate the changes in bulk cloud properties as a function of air mass origin. The frequency of events is presented in the same man-ner as discussed for Fig. 6. The figure shows that the average droplet concentrations change by a factor of two between the clean and first polluted period, by 25% from the clean to the second polluted period and that these concentrations are con-sistent with the average CCN concentrations that were mea-sured at the lighthouse and East Peak (Table 2). The average value of the median volume diameter is 4 µm larger during the clean period (20 µm) than during the polluted period 1 (16 µm) and 6 µm larger than period 3 (14 µm). The LWC during the clean period is 0.24 gm−3compared to 0.30 gm−3 in the periods influenced by anthropogenic emissions. The average precipitation during all periods is nearly the same.
The 00:00 UTC and 12:00 UTC (19:00 and 07:00 local time) soundings from the San Juan International airport4, launched by the US National Weather Service, were evalu-ated to compare the meteorological state of the atmosphere during the three periods. The droplet concentration and size distribution, in addition to being sensitive to the characteris-tics of the CCN at cloud base, will depend on the vertical pro-file of temperature and water vapor and the vertical velocity. The pressure of the lifted condensation level (LCL) is used as an indicator of expected cloud base and the precipitable water (PW) as a measure of potential rain amounts. The aver-age LCLs for the three periods were 956±8 mb, 962±11 mb, and 963±4 mb, respectively, indicating little difference in ex-pected cloud bases for the three identified periods. The aver-age PW for these same periods was 40±6 mm, 44±11 mm, and 50±5 mm. There is a positive trend in PW during the nine days of the project; however, this is not reflected in ei-ther the precipitation rates or in situ liquid water contents that were measured (Table 2 and Fig. 10). The mountain site was approximately 300 m above cloud base as estimated from the pressure measured at the site and the photos that were recorded from the lighthouse every five minutes with a web camera. These photos showed that the daytime cloud
4Data provided by the University of Wyoming, http://weather.
uwyo.edu/upperair/sounding.html
Fig. 10. Frequency distributions of in situ cloud microphysical data
from the three periods, measured at the East Peak site.
bases and tops were not visibly different for the three periods, consistent with the sounding information that indicated fairly constant pressures and temperature at cloud base during the observational period.
The vertical velocity for the three time periods was not directly measured. In order to assess the effect of changes in vertical velocity at cloud base versus changes in the CCN concentrations, we ran a closed parcel model with constant updraft to estimate droplet activation, within 300 m of cloud base. The model incorporates the parameterization intro-duced by Twomey and Wojciechowski (1969), of the CCN concentration (C) as a function of supersaturation, S, of the form C=C0Sk. The values of C0 and k were estimated from the CCN measurements made at the lighthouse site. Table 3 shows the results of the model for constant updraft velocities of 0.2 and 1 ms−1 and for the C0 and k values derived for the clean and polluted periods. It can be seen in the table
Table 3. Results of a closed parcel model with constant updraft
ve-locity (W ), based on the observed CCN characteristics at the light-house, for the three periods identified in the study. Note that pe-riods 1 and 3 had similar characteristics, so are grouped for these purposes.
Period C0 K ND(W =0.2 ms−1) ND(W =0.2 ms−1)
1 & 3 700 0.8 373 397
2 250 0.8 142 172
that the droplet concentration, ND, predicted for an altitude
of 300 m above cloud base increases by less than 20% when the vertical velocity is increased by a factor of five. The ob-served increase in the CCN concentration (represented in this case only by the change in C0) increases the droplet concen-tration by more than a factor of two when C0 is increased by a factor of three. This increase in concentration is simi-lar to what was observed in the measured droplet concentra-tions. These results suggest that the observed differences in the LWC, droplet concentration and median volume diameter are the result of changes in the aerosol between the periods, rather that due to changes in the type of convection or other mesoscale forcing.
4 Discussion
4.1 Overview
As shown in Table 2, the overall aerosol composition mea-sured was principally inorganic in nature. The sulphate mass concentrations are consistent with previous field studies in this location and in other non-polluted MBL sites (Coe et al., 2006; Allan et al., 2004a) with the amounts of POM repre-senting a much smaller fraction. This apparent lack of a sig-nificant organic matter mass fraction is corroborated by the HTDMA and size-resolved CCN measurements which con-sistently showed the majority of the particles exhibiting the hygroscopicity that would be expected with principally inor-ganic aerosols.
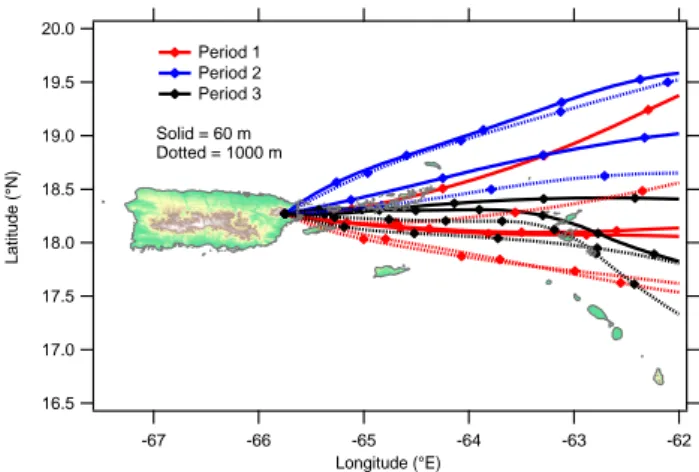
The two main conditions observed during the study, dic-tated by the wind sector, were clean conditions when the air originated from the NE (period 2) and more polluted con-ditions when the wind was from the ESE (periods 1 and 3) and resulted in marked changes in both the aerosol compo-sition and the in situ cloud properties. HYSPLIT back tra-jectory analysis performed using the NOAA Air Resources Laboratory web service5 (Fig. 11) indicates that there was a tendency for the air to come from the direction of pop-ulated islands to the east (principally the British Virgin
Is-5http://www.arl.noaa.gov/ready/hysplit4.html 20.0 19.5 19.0 18.5 18.0 17.5 17.0 16.5 Latitude (°N) -67 -66 -65 -64 -63 -62 Longitude (°E) Period 1 Period 2 Period 3 Solid = 60 m Dotted = 1000 m
Fig. 11. Back trajectories for the three periods, arriving at the
alti-tudes of the Cape San Juan and East Peak sites. Check marks are shown once every 3 h. Note that the trajectories for period 2 are generally more northerly than those for the other periods. Vertical movement is not shown but all trajectories are within 100 m of their finishing altitudes within the region shown.
lands) during periods 1 and 3, with the airmasses having a more northerly origin during period 2. The polluted periods were evident in increased numbers of particles (especially those below 100 nm in diameter), sulphate, EBC and nitrate, which was evident both in the measurements at sea level and within the cloud itself. The particles in the polluted condi-tions were also shown to, in part, be generally less hygro-scopic, with a fraction exhibiting lower sub-saturated growth factors. This, along with the fact that the most significant amounts of organic matter and EBC were seen during this period, points to the additional Aitken-mode particles being produced by combustion sources upwind.
The addition of a primary aerosol is also manifested in an increase in CCN concentrations, but this increase is not proportional to the (much larger) increase in CN, resulting in lower CCN to CN ratios for particles of a given size. The overall ratio of CCN to CN is likewise suppressed, al-though this may have more to do with the larger number of small particles under these conditions, as activation is very strongly dependent on size (Dusek et al., 2006). However, the greater number concentrations of larger (>100 nm) inter-stitial particles in the polluted cases would seem to suggest that size alone was not the governing factor controlling acti-vation within the clouds observed. The measured changes in the cloud microphysics during the polluted cases would seem to suggest that even at the modest mass concentrations ob-served and in spite of the low hygroscopicity of the particles, the pollution from the upwind islands contributes to the CCN concentrations and has a measurable effect on the properties of warm clouds, namely an increase in cloud droplet num-ber concentration, with a corresponding decrease in droplet diameter.
Table 4. Results of cloud and rainwater analysis for periods 1 and 2: Ion mass derived from pH and Sigma after Kr¨amer et al. (1996),
insoluble mass with the Beckman Multisizer 3 Coulter Counter.
Sample Source Ion Mass Insolube Mass Insoluble Number Insoluble median diameter
(# of samples) mg l−1 mg l−1 ml−1 µm
Period 1: Rainwater (3) 5.1 0.06 12 790 1.1
Period 2: Rainwater (2) 2.6 0.02 11 234 0.9
Period 1: Cloud water (3) 40.9 0.4 23 201 1.1
Period 2: Cloud water (3) 15.9 0.1 13 133 1.1
4.2 Potential technical issues affecting organics
Before arriving at specific conclusions regarding the reduced amounts of organic carbon compared to previous studies, it must first be considered that the disagreement between the measurements made in 1992 and 1995 and the current re-sults are due to differences in the measurement techniques. The previous studies made use of the evolved gas analysis (EGA) of bulk samples collected over 8–12 h, whereas this work relies on the organic matter measurements by the AMS systems on times scales of several minutes. The system-atic differences between the measurements are within the in-strument uncertainties; Novakov et al. (1997, and references therein) estimate the uncertainty of the EGA technique to be around 10%, whereas the error associated with a 36-h aver-age of organic data during this study is about ±7 ng m−3 (Al-lan et al., 2003). A discrepancy between the analytical tech-niques themselves is not deemed likely, as previous quanti-tative comparisons between AMS and similar offline organic measurements have been generally very good (Takegawa et al., 2005; Zhang et al., 2005; Topping et al., 2004; Gilar-doni et al., 2007). The AMS is not able to detect refractory materials, which may cause a problem if the organic matter were to be bound in sea salt particles. However, this is not deemed to be the issue in this case, as thermograms from previous studies (Kirchstetter et al., 2000; Novakov et al., 1997) have shown the bulk of the organic matter to evolve at temperatures below 400◦C, which is well below the vapor-izer temperature of the AMS (550◦C). The fact that the AMS does not measure larger particles is also not deemed to be the source of disagreement, as the 1995 study recorded organic mass concentrations within particles below 0.6 µm in diam-eter, which is below the upper cutoff of the aerodynamic lens used in the AMS.
The AMS analysis relies on assumed values of the rel-ative ionisation efficiencies and collection efficiency. The former values are based on laboratory characterisation work and with the exception of ammonium, have consistently been found to be robust between instruments and deployments (Allan et al., 2004a; Takegawa et al., 2005). It is possible that the actual collection efficiency could be greater than the 0.5 assumed, but this is only typically observed for pure
ammo-nium nitrate or sulphuric acid particles or those with a very high water content (Crosier et al., 2007; Allan et al., 2004a). While considered unlikely, if this were the case, this would mean the actual organic mass concentrations would be lower than reported by up to a factor of 2.
A potential source of discrepancy between the OC derived from EGA and the POM derived from both of the AMSs is a positive artefact caused by organic vapours that condense onto the filters during the long collection periods (Kirchstet-ter et al., 2000). The results for OC mass reported in 1992 for measurements made at El Yunque peak (Novakov and Pen-ner, 1993) were more than a factor of two larger than those reported from the lighthouse in 1995 (Novakov et al., 1997). However, the samples taken in 1995 were also analyzed dif-ferently than those from 1992, correcting for the positive artefact using estimates of the excess material based on mea-surements with a backup filter, but as reported by Kirchstetter et al. (2000), in the absence of a denuder in front of the sam-pler to remove the organic vapours, the amount of condensed vapour may dominate the sample. This indicates that some of the organic matter previously found on filter samples may be volatile species condensing onto the substrate. While it is not expected that any such repartitioning should occur within the AMS itself, it is possible that it may occur in the sampling stack or inlet manifold used in this deployment. In the stan-dard NOAA configuration used in this study, the stack sub-sample is heated to remove water from the sub-sampled particles, so it is possible that some of the more volatile components of the organic fraction are being driven off. However, given the fact that a significant fraction reported in the previous studies only evolves at temperatures greater than 250◦C,
repartition-ing effects generatrepartition-ing either positive or negative artefacts can only account for a discrepancy of a factor of around 2, which is not enough to explain the differences observed here. 4.3 Comparisons with previous work
If technical issues are not the main source of disagreement between the past and current studies, then it must be con-cluded that the organic fraction previously observed at this location is not totally ubiquitous. The study presented here took place in December whereas previous measurements
Table 5. Comparison of sulphate, CN, CCN, Sulphate, POM, OC and droplet concentration measured by Novakov and co-workers in
1992 and 1995 (Novakov et al., 1994, 1997; Novakov and Penner, 1993) and in the 2004 campaign presented here. CSJ = Cape San Juan lighthouse, EP=East Peak, EY = El Yunque. POM was estimated from the OC using a factor of 1.5 during the 1992 study.
Period: 1992 EY 1995 CSJ 1995 CSJ 2004 CSJ 2004 EP 2004 CSJ 2004 EP
SE Winds ESE Winds NE Winds ESE Winds ESE Winds ENE Winds ENE Winds Sulphate (ng m−3) 1200 (60) 290 (70) 270 (40) 840 (520) 960 (510) 580 (290) OC (ng m−3) 660 (140) 410 (110) 340 (70) POM (ng m−3) 1000 (140) 170 (350) <700 10 (320) CN (cm−3) 2322 (870) 904 (498) 1159 (341) 287 (135) 340 (139) CCN (cm−3) 558 (170) 373 (164) 236 (66) 171 (122) 157 (95) CCN/CN 0.26 (0.08) 0.41 0.20 0.60 0.46 (0.5% SS) (0.6% SS) (0.6% SS) (0.5% SS) (0.5% SS) Ndroplet(cm−3) 304 (99) 519 (186) 193 (84) LWC (g m−3) 0.11 (.04) 0.31 (0.16) 0.24 (0.10) Effective Radius (µm) 4.8 (0.32) 6.1 (0.5) 5.9 (0.5)
were made in October, March, April and May, so it is possi-ble that the production of tropical marine organic aerosols is a seasonal phenomenon, in the same way as was con-cluded by O’Dowd et al. (2004) for the northern Atlantic. Or given that some of the measurements took place 10 or more years apart, it could be indicative of a long-term trend of some description. It is also possible that these organic aerosols are produced in a spatially inhomogeneous manner. Previous studies had assumed that the prevailing source sec-tor was northeasterly, bringing air in along the trade winds, but while the climatological wind direction is northeasterly, this work shows an analysis of the daily circulation pattern is essential to precisely locate the air mass origins. A poten-tially significant detail about the measurement area is the fact that there are many more inhabited islands to the east and southeast of Puerto Rico, which will be sources of organic aerosols in their own right. HYSPLIT back trajectory anal-ysis, using archived wind field data, does indeed show that the wind was consistently originating from the SE during the 1992 measurements. However, these variations did not seem to affect the mass concentrations of organic carbon measured in 1995 (Novakov et al., 1997), when air came from both the northeast and southeast sectors. Also, the influence of an-thropogenic emissions was ruled out by Mayol-Bracero et al. (2001), who did not detect any PAHs using GC-MS.
Whereas a major difference with previous studies was ob-served with respect to the general lack of organic aerosols, many of the other measurements are also dissimilar, as shown in Table 5, which lists average CN, CCN, sulphate, organics, droplet concentration, LWC and effective radius from this study and those of the 1992 and 1995 studies. The CN and CCN concentrations measured at the El Yunque site were sig-nificantly greater than at the East Peak, whereas the cloud droplet concentrations were smaller. This may be a manifes-tation of the differences in aerosol composition noted during the studies but differences in the instrumentation may also be
a factor. The CN counter used in 1992 (a TSI Model 3022) has a lower size threshold than the TSI 3010 used here and the classical aerosol spectrometer probe (CASP) is an earlier, exclusively ground-based version of the FSSP. In addition, as stated earlier, the approach used to derive the number con-centration from the FSSP during this study has an uncertainty of almost 40%.
Novakov et al. (1994) observed that the cloud droplet concentration was insensitive to the sulphate concentration, which is apparently at odds with our CCN measurements, which are consistent with sulphate being the dominant com-ponent. However, as originally pointed out, the formation rate of sulphate is not necessarily the controlling factor in number concentrations and CCN measurements alone can-not conclusively show the significant controlling factor in the cloud droplet concentrations, as much will depend on the cloud dynamics. In this study, there is no evidence to sug-gest that the changes in cloud microphysical behaviour noted during this study are attributable to anything other than the influence of anthropogenic emissions and there is not enough variability within the clean case to observationally assess the influence of sulphate or any natural organics that may be present. More extensive measurements are needed to fully evaluate this. A quantitative closure exercise between aerosol properties and cloud microphysics would also go some way to addressing this and the other issues discussed but unfor-tunately, the data in this study is not deemed sufficient, ow-ing to the unfortunate lack of a reliable sea salt measurement and the fact that there was no verifiable flow connectivity between the sites during these measurements. A quantita-tive closure between the aerosol composition, hygroscopicity and size-resolved CCN measurements may be possible, us-ing models already available (e.g. Petters and Kreidenweis, 2007; Topping et al., 2005a, b) but will be highly complex and is considered outside the scope of this paper.
5 Conclusions
The Puerto Rico Aerosol Cloud Interaction Study (PRACS) was an intensive, two-site field experiment that took place during December 2004 with the goal of studying in situ aerosol and cloud properties in a tropical marine environ-ment and attempting to study the linkage between the two in a quasi Lagrangian manner. This built on previous studies that had taken place at this location. Aerosol properties mea-sured at the sea level site included number, size, chemical composition, hygroscopicity and CCN behaviour, and used some of the more recent developments in instrumentation. At the mountain site, cloud base microphysics was studied in situ and droplet and rain water composition was measured using both the offline analysis of bulk samples and online in-strumentation studying the droplet residuals downstream of a counterflow virtual impactor (CVI).
Generally speaking, the majority of the submicron, non sea salt aerosol encountered during the study was exclusively composed of sulphate, with the exception of a period of ESE winds where small amounts of organic matter and black car-bon were detected and to a lesser extent, sulphate and ni-trate were also enhanced. This extra component was mani-fested as additional particles mainly below 100 nm in diam-eter, consistent with urban or industrial primary emissions. These elevated the overall CCN concentrations, despite the added particles having lower hygroscopicities. The change in air mass origin, from clean to moderately polluted, was also detected in the cloud properties as an increase in droplet concentration and significant decrease in the median volume diameter. Changes also occurred in the interstitial and cloud droplet residual particles, with greater numbers of particles, notably so at larger sizes, not activating and the residual par-ticles increasing in size overall. Increases in the sulphate, nitrate and insoluble material were also found in the cloud water consistent with anthropogenic emissions.
Unlike in previous studies, an organic fraction large enough to perturb the CCN properties of the aerosol was not observed in the clean sector and the controlling component was, if anything, non-sea salt sulphate. While this disagree-ment may be due to technical issues associated with differ-ences in the methodologies, it is unlikely to be the sole rea-son. It could be that the organic matter in the region is not ubiquitous and is dependent on either seasonal biological ac-tivity or source region.
In order to answer the questions fully, a complete closure between aerosol and cloud measurements would be required, which would be difficult for this dataset and deemed outside of the scope of this paper. However, these observations do highlight many outstanding questions regarding the extent and effect of tropical aerosols on clouds, the organic fraction in particular. A long term sampling project in this environ-ment and a detailed, systematic comparison with wind field analysis, possibly using more detailed tools such as that of Stohl et al. (2002), would go a long way to addressing the
uncertainty of the true extent and origin of organic aerosols (both natural and anthropogenic) within this region. This would ideally be used in tandem with cloud microphysical measurements and models in order to assess what influence these aerosols have on tropical clouds.
Acknowledgements. The authors would like to thank the following:
P. Sheridan and J. Ogren of the National Oceanographic and Atmospheric Administration (NOAA) Earth Systems Research Laboratory for their support with the aerosol measurements at Cape San Juan; J. Collett of Colorado State University for loan of the cloud water sampler; the Caribbean National Forest and the Federal Aviation Administration for access to the East Peak site and the Conservation Trust of Puerto Rico for access to the Cape San Juan lighthouse site. Coastline data used in the figures was provided by the National Geophysical Data Center, land relief data provided by the U.S. Geological Survey and back trajectories calculated using the NOAA Air Resources Laboratory HYSPLIT service. This project was funded by the Mexican Science Foundation (Conacyt grant #45310), the Royal Society International Joint Projects scheme, the National Science Foundation (grant #0342548) and the Max Planck Society. Special thanks to T. Novakov, whose critical review and helpful suggestions have greatly improved the manuscript.
Edited by: D. Cziczo
References
Allan, J. D., Jimenez, J. L., Williams, P. I., Alfarra, M. R., Bower, K. N., Jayne, J. T., Coe, H., and Worsnop, D. R.: Quantitative sampling using an aerodyne aerosol mass spectrometer – 1. Tech-niques of data interpretation and error analysis, J. Geophys. Res.-Atmos., 108, 4090, doi:10.1029/2002JD002358, 2003.
Allan, J. D., Bower, K. N., Coe, H., Boudries, H., Jayne, J. T., Canagaratna, M. R., Millet, D. B., Goldstein, A. H., Quinn, P. K., Weber, R. J., and Worsnop, D. R.: Submicron aerosol com-position at trinidad head, california, during itct 2k2: Its relation-ship with gas phase volatile organic carbon and assessment of in-strument performance, J. Geophys. Res.-Atmos., 109, D23S24, doi:10.1029/2003JD004208, 2004a.
Allan, J. D., Coe, H., Bower, K. N., Alfarra, M. R., Delia, A. E., Jimenez, J. L., Middlebrook, A. M., Drewnick, F., Onasch, T. B., Canagaratna, M. R., Jayne, J. T., and Worsnop, D. R.: A generalised method for the extraction of chemically resolved mass spectra from aerodyne aerosol mass spectrometer data, J. Aerosol. Sci., 35, 909–922, 2004b.
Baumgardner, D.: An analysis and comparison of 5 water droplet measuring-instruments, J. Clim. Appl. Meteorol., 22, 891–910, 1983.
Bond, T. C., Anderson, T. L., and Campbell, D.: Calibration and intercomparison of filter-based measurements of visible light ab-sorption by aerosols, Aerosol Sci. Technol., 30, 582–600, 1999. Bond, T. C. and Bergstrom, R. W.: Light absorption by
carbona-ceous particles: An investigative review, Aerosol Sci. Technol., 40, 27–67, 2006.
Bower, K. N., Choularton, T. W., Gallagher, M. W., Colvile, R. N., Beswick, K. M., Inglis, D. W. F., Bradbury, C., Martinsson, B. G., Swietlicki, E., Berg, O. H., Cederfelt, S. I., Frank, G., Zhou,