HAL Id: hal-00296487
https://hal.archives-ouvertes.fr/hal-00296487
Submitted on 13 Mar 2008
HAL is a multi-disciplinary open access
archive for the deposit and dissemination of
sci-entific research documents, whether they are
pub-lished or not. The documents may come from
teaching and research institutions in France or
abroad, or from public or private research centers.
L’archive ouverte pluridisciplinaire HAL, est
destinée au dépôt et à la diffusion de documents
scientifiques de niveau recherche, publiés ou non,
émanant des établissements d’enseignement et de
recherche français ou étrangers, des laboratoires
publics ou privés.
and first applications in polar regions
S. Noël, S. Mieruch, H. Bovensmann, J. P. Burrows
To cite this version:
S. Noël, S. Mieruch, H. Bovensmann, J. P. Burrows. Preliminary results of GOME-2 water vapour
retrievals and first applications in polar regions. Atmospheric Chemistry and Physics, European
Geosciences Union, 2008, 8 (6), pp.1519-1529. �hal-00296487�
www.atmos-chem-phys.net/8/1519/2008/ © Author(s) 2008. This work is distributed under the Creative Commons Attribution 3.0 License.
Chemistry
and Physics
Preliminary results of GOME-2 water vapour retrievals and first
applications in polar regions
S. No¨el, S. Mieruch, H. Bovensmann, and J. P. Burrows
Institute of Environmental Physics, University of Bremen, FB 1, P. O. Box 330440, 28334 Bremen, Germany Received: 18 October 2007 – Published in Atmos. Chem. Phys. Discuss.: 3 December 2007
Revised: 13 February 2008 – Accepted: 13 February 2008 – Published: 13 March 2008
Abstract. Global total water vapour columns have been
derived from measurements of the Global Ozone
Monitor-ing Experiment 2 (GOME-2) on MetOp. For this
pur-pose, the Air Mass Corrected Differential Optical Absorp-tion Spectroscopy (AMC-DOAS) method has been adapted, having previously been applied successfully to GOME (on ERS-2) and SCIAMACHY (SCanning Imaging Absorp-tion spectroMeter for Atmospheric CHartographY, on EN-VISAT) data. Comparisons between the derived GOME-2 and SCIAMACHY water vapour columns show a good over-all agreement. This gives confidence that the temporal se-ries of water vapour columns from GOME-type instruments (GOME/ERS-2, SCIAMACHY/ENVISAT), which began in 1995, is successfully continued by the MetOp instrumenta-tion until at least 2020. The enhanced temporal and spa-tial resolution of GOME-2 enables the analysis of diurnal variations in the polar regions. This is especially impor-tant because atmospheric data sources in the polar regions are generally sparse. As an exemplary application, daily wa-ter vapour total columns over the polar research station Ny
˚
Alesund (78◦55′19′′N/11◦56′33′′E) are investigated. At this latitude GOME-2 yields about six data points during daylight hours at varying local times. From these data diurnal varia-tions of water vapour have been successfully retrieved.
1 Introduction
Several retrieval approaches have shown that satellite mea-surements in the visible spectral region can be used to derive global water vapour total columns (see e.g. No¨el et al., 1999; Casadio et al., 2000; Maurellis et al., 2000; Lang et al., 2003; Wagner et al., 2003; Buchwitz et al., 2004). One of these
re-Correspondence to: S. No¨el
(stefan.noel@iup.physik.uni-bremen.de)
trieval methods is the so-called Air Mass Corrected Differ-ential Optical Absorption Spectroscopy (AMC-DOAS) ap-proach (see e.g. No¨el et al., 1999, 2004, 2005, for details) us-ing water vapour and molecular oxygen absorption between 688 and 700 nm to derive total column water vapour. The AMC-DOAS method has already been successfully applied to measurements of the Global Ozone Monitoring Experi-ment (GOME), see e.g. Burrows et al. (1999), on ERS-2 and the SCanning Imaging Absorption spectroMeter for At-mospheric CHartographY (SCIAMACHY), see e.g. Bovens-mann et al. (1999), on-board the European environmental satellite ENVISAT.
In addition to GOME and SCIAMACHY there are various other space-borne instruments providing global water vapour data, some of them with much longer heritage. Most no-tably here is the series of Special Sensor Microwave Imager (SSM/I) instruments (and successors), see e.g. Bauer and Schluessel (1993), which started in 1987 and provides good information about total water vapour columns over ocean. Whereas the SSM/I type instruments work in the microwave (MW) spectral region, other sensors, like the Moderate Res-olution Imaging Spectroradiometer (MODIS) on Aqua/Terra (Gao and Kaufman, 2003) or the Medium Resolution Imag-ing Spectrometer (MERIS) on ENVISAT (Li et al., 2003), operate in the near infrared (NIR). Similar to GOME and SCIAMACHY NIR instruments can provide water vapour data over all surfaces but are typically hampered by clouds. Additional information about the distribution of water vapour can be derived by utilising data from the Global Positioning System (GPS) satellites (see e.g. Dai et al., 2002).
AMC-DOAS water vapour total column data are available over both ocean and land, but only measurements on the day side and under almost cloud free conditions can be used. In contrast to e.g. water vapour columns derived by microwave instruments like SSM/I, which are typically calibrated by using collocated radio sonde data, the AMC-DOAS water vapour results do not rely on any other measurement data,
thus providing a completely new and independent data set. Previous investigations have shown that GOME and SCIA-MACHY water vapour data sets can be successfully com-bined to generate a water vapour climatology covering up to now more than 11 years (No¨el et al., 2007). The applicability of the combined GOME/SCIAMACHY water vapour data set for climatological trend studies has also recently been shown (Mieruch et al., 2008). Similar studies based on water vapour data derived (using different methods) from GOME measurements alone have already been performed by Wag-ner et al. (2006) and Lang et al. (2007).
Although these studies show that even the analysis of short time series can provide interesting results about the global water vapour variability, the applicability of the GOME/SCIAMACHY data set is currently limited by its (in the climatological sense) short duration. Global GOME mea-surements are only available from June 1995 until May 2003. SCIAMACHY is measuring since 2002 and has already ex-ceeded its originally specified life time. However, the SCIA-MACHY instrument is still in good shape and the ENVISAT mission has been extended to 2010; a further extension is currently under investigation.
The launch of the MetOp satellite in October 2006
pro-vides a potential further water vapour data source. One
instrument on-board of MetOp is GOME-2 (Munro et al., 2006), an enhanced version of GOME. Because of the simi-larities between GOME-2 and GOME, the AMC-DOAS re-trieval method can also be applied to GOME-2 data. MetOp is only the first in a series of three similar meteorological satellites which gives confidence that the AMC-DOAS water vapour time series can be continued until at least 2020 (see the EUMETSAT web site, http://www.eumetsat.int, for more details).
Beside the usefulness of the combined GOME/
SCIAMACHY/GOME-2 data set for climatological
trend studies the improved spatial and temporal coverage of GOME-2 will be especially helpful for studies of the polar
regions. Although the absolute contribution of the polar
regions to the global water vapour budget is comparably small, the Arctic and Antarctic water cycle play a significant role for global climate, mainly due to the coupling of surface temperature increase (which is expected to be largest in the Arctic, IPCC, 2007), water vapour feedback, precipitation and ice melt.
Since water vapour is the major greenhouse gas the knowl-edge of the temporal and spatial distribution of water vapour in the polar regions is an essential input for climate models. However, ground based measurements of water vapour are typically sparse in the Arctic region (see e.g. Gerding et al., 2004). Satellite based remote sensing measurements try to fill these gaps, but depending on the underlying measure-ments techniques with different advantages and limitations. Microwave measurements are typically limited to ocean ar-eas (although there have been some successful efforts to de-rive also information over ice, see e.g. Melsheimer and
Heyg-ster (2008)) whereas optical sensors can only measure un-der daylight conditions, usually limited by the presence of clouds.
In this paper we present first AMC-DOAS retrieval results based on GOME-2 measurements and compare them with corresponding validated SCIAMACHY data. In addition, ad-vantages resulting from the improved spatial and temporal coverage of GOME-2 are pointed out. Especially, first results on diurnal variations of water vapour in polar regions derived from GOME-2 measurements over the polar research station
Ny ˚Alesund are presented.
2 The AMC-DOAS algorithm
Since the AMC-DOAS retrieval algorithm has been ex-plained in detail before (see e.g. No¨el et al., 2004) only a short summary of the main features of the method will be given here.
As all DOAS-type applications the AMC-DOAS method uses only the differential absorption structures to derive to-tal columns. All spectrally broadband contributions (e.g. from Rayleigh or aerosol scattering or surface reflectance) are approximated by a low-order polynomial which makes the DOAS retrievals very insensitive to these. Therefore the retrieval does not require any external information from e.g. albedo data bases.
In addition to standard DOAS the AMC-DOAS method considers a non-linear relation between the absorber amount and the absorption depth, thus taking into account the effect of non-resolved saturated absorption lines. Furthermore, the AMC-DOAS method incorporates an air mass correction by which deviations between an assumed model atmosphere and the real conditions are handled. The radiative transfer data base used in the retrieval has been calculated for a tropical at-mosphere assuming no clouds, a fixed surface albedo of 5%, no aerosols and a surface elevation of 0 km. Usually these assumptions are not fulfilled for the measurements. Any de-viations from these assumptions in the “real” measurements are accounted for by the air mass correction factor. The air
mass correction factor is determined from the O2absorption
within the fitting window (688–700 nm). Since the amount
of atmospheric O2(as a well mixed gas in the troposphere) is
known, a measured O2optical depth different from the
mod-elled one can be interpreted as a different average light path or a different air mass factor. The underlying assumption for the air mass correction is, that this air mass factor difference can also be applied to the water vapour absorption, thus cor-recting the derived water vapour column. This assumption
is justified because water vapour and O2 absorptions
over-lap within the fitting window (i.e. the spectral range is very similar) and the absorptions are of similar strength.
Of course the air mass correction method produces bet-ter results for scenes where the atmospheric background and surface conditions do not differ much from the ones assumed
in the radiative transfer calculations. Because of this only data with a retrieved air mass correction factor larger than 0.8 are taken into account. This value of 0.8 has shown to give a good compromise between the achieved data accu-racy and the remaining amount of data. The most probable reason for low air mass correction factors is the presence of clouds in the atmosphere. Therefore the air mass correction factor limit removes too cloudy scenes such that the result-ing AMC-DOAS water vapour data set is essentially cloud-cleared. However, not only too cloudy scenes are sorted out but also regions with too high surface elevation, like the Hi-malaya. Note that in contrast to e.g. cloud masks derived from imaging methods the AMC-DOAS cloud filter method is not very sensitive to bright scenes (e.g. ice in polar re-gions). Furthermore the AMC-DOAS retrieval is not based on external information (i.e. data from different spectral re-gions or from other sensors) which makes the resulting data set very independent.
3 GOME-2 on MetOp
In October 2006 the first of a series of operational meteo-rological satellites (MetOp) has been launched. One instru-ment on-board of MetOp is GOME-2, an enhanced version of GOME covering the same spectral range from about 240 to 790 nm. Compared to the GOME instrument, GOME-2 has a higher spatial resolution (80 km×40 km, comparable to the SCIAMACHY resolution of typically 60 km×30 km) and a larger swath width of 1920 km, resulting in a daily cov-erage at mid-latitudes. The MetOp orbit is – as the ERS-2 and ENVISAT orbit – sun-synchronous with an equator crossing time of 09:30 LT (compared to 10:00 LT for
EN-VISAT and 10:30 LT for ERS-2). All three instruments
(GOME, SCIAMACHY and GOME-2) therefore can ob-serve the same scene within about one hour. This small time difference facilitates the combination of the retrieval re-sults. Currently, GOME-2 is still in its Calibration/Validation phase, therefore all GOME-2 data presented here are of pre-liminary nature.
4 Intercomparison between GOME-2 and
SCIAMACHY water vapour data
The AMC-DOAS algorithm could be applied to GOME-2 data without major modifications; it was only necessary to adapt the radiative transfer data base to the GOME-2 instru-ment slit function which is somewhat broader for GOME-2 (Full Width at Half Maximum (FWHM) 0.488 nm) than for SCIAMACHY (FWHM 0.4 nm). Figure 1 shows a map of the GOME-2 water vapour columns derived this way and the corresponding SCIAMACHY results (V1.0) for the same day (26 March 2007). The larger swath of GOME-2 is clearly visible. An eye inspection of these swath data already re-veals that the observed water vapour structures agree quite
a)
Preliminary GOME-2 AMC-DOAS Water Vapour 20070326
-180 -150 -120 -90 -60 -30 0 30 60 90 120 150 180 Longitude, deg -90 -60 -30 0 30 60 90 Latitude, deg 0 2 4 6 8 10
H2O Vertical Column Amount, g/cm2
b)
SCIAMACHY AMC-DOAS Water Vapour 20070326
-180 -150 -120 -90 -60 -30 0 30 60 90 120 150 180 Longitude, deg -90 -60 -30 0 30 60 90 Latitude, deg 0 2 4 6 8 10
H2O Vertical Column Amount, g/cm2
Fig. 1. (a) GOME-2 water vapour columns derived with the
AMC-DOAS method for 26 March 2007 (swath data). (b) SCIAMACHY water vapour columns for the same day (also swath data).
well. This is confirmed by a more quantitative analysis for
which all data are spatially gridded to 0.5◦×0.5◦and
com-pared. A scatter plot of all resulting collocated data points of GOME-2 and SCIAMACHY for this day is shown in Fig. 2. For this plot, all collocated GOME-2 and SCIAMACHY
re-sults have been put on a 0.05 g/cm2×0.05 g/cm2grid. The
colours in the plot show the numbers of collocations per grid point, normalised to the maximum value (in this case 6561; the total number of collocated data points is 93 620). Fur-thermore, a linear curve has been fitted to the data, involving a latitudinal weighting factor which takes into account the different surface area of the spatial grid pixels. As can be seen from Fig. 2, the agreement between the two data sets is quite good; the linear correlation coefficient is 0.99, and the fitted straight line reveals a slope of 0.96 and a small bias
of 0.05 g/cm2. The density distribution shows that most of
the collocations occur at low columns below about 1 g/cm2
and that the fraction of data deviating from the 1:1 line is considerably small.
However, this is only a single day example for a com-parison between GOME-2 and SCIAMACHY water vapour
GOME-2 vs. SCIAMACHY 20070326 0 2 4 6 8 GOME-2 Column, g/cm2 0 2 4 6 8 SCIAMACHY Column, g/cm 2 0.001 0.010 0.100 1.000 Norm. Density y = x y = a + b*x a = 0.05 b = 0.96 r = 0.99
Fig. 2. Comparison of water vapour columns derived from
prelimi-nary GOME-2 spectral data from 26 March 2007 with correspond-ing SCIAMACHY results. The different colors give the density of collocated data points (normalised to the maximum value of 6561).
columns. Figure 3 shows the result of a more extensive statis-tical analysis based on about seven months of data (8 March to 30 September 2007). There are some small gaps in the time series which are either caused by instrument switch-offs or problems in the reception of the distributed data products. The black dots in Fig. 3 represent the globally averaged de-viation (weighted accounting for the different latitudes) be-tween collocated GOME-2 and SCIAMACHY water vapour columns for one day; the vertical blue bars are the corre-sponding standard deviations. The red line is the monthly average of the daily means. As can be seen from Fig. 3 the overall deviation between the GOME-2 and SCIAMACHY results is rather small. However, the observed standard
de-viations in the order of 0.2–0.3 g/cm2indicate larger
devi-ations on the local scale, which can be mainly attributed to the strong spatial and temporal variability of water vapour.
In fact, a standard deviation of 0.3 g/cm2 is quite small
when looking at intercomparisons between water vapour data sets derived from measurements of different instruments at larger temporal distances which are typically in the order of
0.5 g/cm2 (see e.g. No¨el et al., 2004; Lang and Lawrence,
2005).
A striking feature in Fig. 3 is the sinusoidal variation of the mean deviations as a function of time. With a period of about 9 days the global mean deviations vary with an
amplitude of about 0.1–0.15 g/cm2, with somewhat smaller
amplitudes towards June which then slowly increase again towards the end of the time series. Related to the average
global water vapour column of about 2 g/cm2this variation
is very small (∼6%). Note that in polar regions where both columns and deviations are smaller and instrumental swaths overlap more often the relative variation is less pronounced
but of similar magnitude. This is the order of magnitude of the accuracy of the AMC-DOAS product, which makes an investigation about the causes for the varying differences between the GOME-2 and SCIAMACHY results difficult. Obviously, this variation is related to the relative shift be-tween the ENVISAT and MetOp ground tracks (see Fig. 4). A good agreement between GOME-2 and SCIAMACHY is achieved under symmetrical conditions, i.e. when the SCIA-MACHY ground pixels are either in the centre of the (larger) GOME-2 swath (Fig. 4c) or equally displaced to the East and the West (Fig. 4a). If the matching SCIAMACHY measure-ments occur on the West side of the GOME-2 swath (like in Fig. 4b) the SCIAMACHY columns are typically larger than the GOME-2 columns; on the East side of the swath (like in Fig. 4d) it is vice versa. The effect is however such small and overlayed by the influence of natural variability that it can not be seen directly in the plots.
One possible explanation for the observed deviations is an East-West asymmetry in the GOME-2 swath data which re-sults in typically higher columns in the eastern part of the scan than in the western part. This is qualitatively supported by plots of daily swath data (like Fig. 1) where especially tropical GOME-2 water vapour columns tend to be higher in the eastern part of the swath. This East-West asymmetry could be either related to the calibrated spectra or to the re-trieval method, which could be affected by the extreme scan angles of GOME-2. Although the AMC-DOAS method is very insensitive to geometrical issues because of the involved
air mass factor correction using O2absorption features, small
second order effects caused e.g. by differences in the vertical
distribution of O2and H2O can not be completely ruled out.
This assumption has been checked by applying the AMC-DOAS retrieval to simulated spectra corresponding to a GOME-2 forward scan. These spectra have been derived from calculations with the radiative transfer model SCIA-TRAN (Version 2.2, run in pseudo-spherical mode). The modelled scenario corresponds to a GOME-2 forward scan over the Pacific close to the equator in spring (solar zenith
angle about 42◦); a tropical atmosphere is assumed. This
sce-nario somehow resembles the situation where Fig. 1 seems to show an East-West asymmetry.
Figure 5 shows the derived relative deviation of the retrieved water vapour column from the known column
(4.18 g/cm2) of the tropical reference atmosphere as
func-tion of the GOME-2 ground pixel number within the scan. The scan starts on the Eastern side (ground pixel no. 1) and ends on the Western side (ground pixel no. 24). The
maxi-mum scan angle is about 45◦with respect to the nadir
direc-tion which lies between ground pixels 12 and 13. The scan is symmetric with respect to nadir, but the velocity of the scan is chosen such that the same spatial resolution is kept along the scan, as GOME-2 does.
As can be seen from Fig. 5 the deviations – which can be interpreted as a systematic error of the AMC-DOAS method related to the scan angle – are almost symmetrical towards
-0.4 -0.2 0 0.2 0.4
01-Mar-07 01-Apr-07 01-May-07 01-Jun-07 01-Jul-07 01-Aug-07 01-Sep-07
Mean Deviation GOME2-SCIAMACHY, g/cm
2 GOME-2 - SCIAMACHY Global Mean Deviations
Avg. Deviation: -0.003 g/cm2
Std. Dev. (of Daily Mean) Daily Mean Monthly Mean
Fig. 3. Deviation of GOME-2 and SCIAMACHY water vapour columns as a function of time (8 March 2007 to 30 September 2007).
a) b)
GOME-2 and SCIAMACHY Swath Data 20070321
-20 -10 0 10 20 30 40 Longitude, deg 30 40 50 60 70 Latitude, deg
GOME-2 and SCIAMACHY Swath Data 20070324
-20 -10 0 10 20 30 40 Longitude, deg 30 40 50 60 70 Latitude, deg c) d)
GOME-2 and SCIAMACHY Swath Data 20070326
-20 -10 0 10 20 30 40 Longitude, deg 30 40 50 60 70 Latitude, deg
GOME-2 and SCIAMACHY Swath Data 20070328
-20 -10 0 10 20 30 40 Longitude, deg 30 40 50 60 70 Latitude, deg 0.0 0.5 1.0 1.5 2.0 2.5 3.0 H2O Vertical Column Amount, g/cm2
Fig. 4. GOME-2 (background) and SCIAMACHY (boxes) water vapour swath data over Europe for three days with different relative
loca-tions of the ground tracks. (a) 21 March 2007: SCIAMACHY ground pixels in-between GOME-2 pixels. (b) 24 March 2007: SCIAMACHY ground pixels in the western part of the GOME-2 swath. (c) 26 March 2007: SCIAMACHY ground pixels centred on the GOME-2 swath.
-6 -4 -2 0 2 4 6 0 5 10 15 20 25 Rel. Deviation, %
Ground Pixel No.
GOME-2 Forward Scan Simulation, (Retrieved - Reference)/Reference Column
East
West
Nadir
Fig. 5. Results of a simulated GOME-2 forward scan retrieval:
Rel-ative deviation between the retrieved and the reference column as function of the GOME-2 ground pixel (corresponding to the scan angle).
the nadir direction and typically below 5%. This is some-what smaller than the observed amplitude in Fig. 3. Devia-tions in the East are positive (i.e. the retrieved column is too high) whereas deviations in the West are negative (i.e. the re-trieved column is too low). For larger scan angles deviations are slightly higher in the West than in the East. The derived sign of the deviations is in line with the impression from the swath data (Fig. 1) and the occurrence of maxima and minima of the mean deviation between GOME-2 and SCIA-MACHY (Fig. 3) and i.e. higher GOME-2 columns in the East.
Another potential explanation is that the variations in the mean differences are caused by the large GOME-2 swath of almost 2000 km. The local time difference between a SCIAMACHY and a GOME-2 ground pixel at the same geo-graphic location on the same day depends on the relative po-sition of the SCIAMACHY ground pixels within the GOME-2 swath. This is illustrated in Fig. 6, where the time differ-ence between coincident SCIAMACHY and GOME-2 mea-surements are shown for the same days as in Fig. 4. This time difference has been derived based on gridded data; in cases where more than one measurement per day is avail-able (i.e. at higher latitudes) the difference between averaged measurement times is shown. The SCIAMACHY measure-ments occur (with respect to the local time of the GOME-2 measurements) later on the West side than on the East side of the GOME-2 swath. Depending on the relative lo-cation of the ground tracks the local time differences can be much larger than the 30 min distance due to the differ-ent ENVISAT and MetOp orbits. Local variability and the daily water vapour cycle may then cause systematic devi-ations between the GOME-2 and SCIAMACHY columns. The seasonal dependence of the daily cycle could then be
the reason for the varying amplitude in Fig. 3. This assump-tion of course can only be verified when more GOME-2 data (at least one year) are available. As mentioned before, the best agreement between GOME-2 and SCIAMACHY wa-ter vapour results is achieved in the “symmetrical” cases a) and c). However, as can be seen from Fig. 6 the shortest time differences between GOME-2 and SCIAMACHY mea-surements occur in situation d), where the SCIAMACHY ground pixels are located in the eastern part of the GOME-2 swath, whereas the longest offsets occur in situation a), where the SCIAMACHY/ENVISAT swath falls in-between two GOME-2 swaths; thus overlaps occur for both eastern and western GOME-2 pixels. This indicates that the tempo-ral difference is less relevant for the observed variations in the water vapour column difference between GOME-2 and SCIAMACHY.
Based on our current knowledge we think that most of the variation in the mean differences is caused by the calibration of the GOME-2 data. This is because a) the East-West asym-metry seen e.g. in the swath data (Fig. 1) appears to be larger than expected from the simulations (Fig. 5), and because b) the validation of SCIAMACHY AMC-DOAS water vapour data (see e.g. No¨el et al., 2004) shows no systematic peri-odicity of deviations when comparing to independent data sets from the European Centre for Medium-Range Weather Forecasts (ECMWF) or the Special Sensor Microwave Im-ager (SSM/I), whereas Fig. 5 suggests that there should be a considerable effect also for the smaller SCIAMACHY swath range (approximately corresponding to ground pixels 7 to 18). The scan angle dependency of the AMC-DOAS method may add some additional variation, but because of the air mass correction this is a second order effect. Systematic lo-cal time differences between GOME-2 and SCIAMACHY are expected to play (on global average) a minor role. This is supported by the observation that smallest deviations do not occur at days of smallest time differences.
5 GOME-2 water vapour columns at mid and high
lat-itudes
Although the spatial resolution of the GOME-2 measure-ments is slightly worse than for SCIAMACHY, the GOME-2 coverage is much better due to the wide swath. This is espe-cially the case for mid-latitudes. Figure 7 shows as an exam-ple for the largely improved spatial and temporal coverage of GOME-2 the daily gridded water vapour columns for each day of May 2007 for the European region. In addition to its standard swath of 1920 km GOME-2 performs regularly measurements at a narrow swath width of 320 km with a six times increased spatial resolution. For May 2007 these mea-surements occur on the 8th, 17th and 27th, as can be seen from Fig. 7. Note that meanwhile the frequency of GOME-2 narrow swath data has been reduced to once per month.
a) b) SCIAMACHY - GOME-2 20070321 -20 -10 0 10 20 30 40 Longitude, deg 30 40 50 60 70 Latitude, deg SCIAMACHY - GOME-2 20070324 -20 -10 0 10 20 30 40 Longitude, deg 30 40 50 60 70 Latitude, deg c) d) SCIAMACHY - GOME-2 20070326 -20 -10 0 10 20 30 40 Longitude, deg 30 40 50 60 70 Latitude, deg SCIAMACHY - GOME-2 20070328 -20 -10 0 10 20 30 40 Longitude, deg 30 40 50 60 70 Latitude, deg -2 -1 0 1 2 Time Difference, h
Fig. 6. Average time difference between SCIAMACHY and GOME-2 measurements over Europe for the four scenarios shown in Fig. 4.
Data are given on a 0.5◦×0.5◦latitude/longitude grid. (a) 21 March 2007: SCIAMACHY ground pixels in-between GOME-2 pixels. (b)
24 March 2007: SCIAMACHY ground pixels in the western part of the GOME-2 swath. (c) 26 March 2007: SCIAMACHY ground pixels centred on the GOME-2 swath. (d) 26 March 2007: SCIAMACHY ground pixels in the eastern part of the GOME-2 swath.
Except for these days GOME-2 measurements provide daily coverage for almost the whole of Europe (limited of course by the presence of clouds). The increase of total water vapour especially over the eastern part of Europe by the end of May 2007 is clearly visible as well as the wind-driven gen-eral movement of air masses (including water vapour fields)
from the West to the East. The derived GOME-2 water
vapour columns therefore provide the possibility to study di-urnal variations of the water vapour total columns at latitudes
above about 40◦and to potentially separate transport effects
from regional effects.
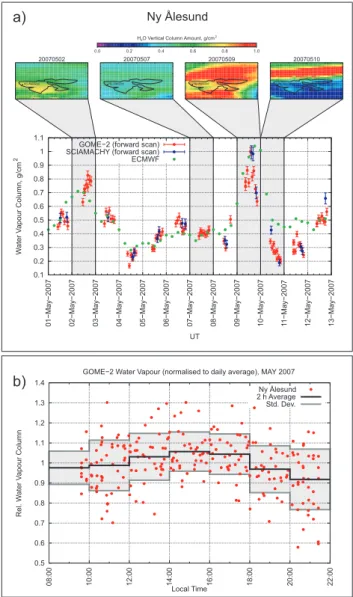
For higher latitudes the temporal coverage of the GOME-2 data is even better. As an example, Fig. 8a shows GOME-2 and SCIAMACHY measurements over the polar research station Ny ˚Alesund (78◦55′19′′N/11◦56′33′′E, located at the western coast of the island Spitsbergen) for twelve days be-ginning of May 2007. For comparison, corresponding water
vapour columns from model data of the European Centre for Medium-Range Weather Forecasts (ECMWF) are also plot-ted in Fig. 8a. The ECMWF water vapour columns have been derived using a combination of assimilated meteorolog-ical fields (geopotential height, temperature, pressure, and specific humidity) from the operational daily analysis data.
These data are provided on a 1.5◦×1.5◦spatial grid at 91
al-titude levels every 6 h. To obtain total water vapour columns the ECMWF data have been integrated over height and
in-terpolated to a 0.5◦×0.5◦ area grid. As can be seen from
this figure, there are typically about six GOME-2
measure-ments over Ny ˚Alesund per day, compared to two for
SCIA-MACHY (limited of course by cloudiness and daylight). Ob-viously, there are four ECMWF data points per day. In the case that adjacent GOME-2 ground pixels overlap (like on 9 May 2007) there may be more than one measurement at
is inside the satellite ground pixels of the forward scan are taken into account. Including also backscan pixels would roughly double the number of collocations, on the cost of spatial resolution. During some days (like 7 May 2007) the water vapour stays rather constant, whereas it is highly vari-able on other days. Obviously, the precision of the AMC-DOAS water vapour product is high enough to follow these changes of very low absolute columns. It is also notable that the individual SCIAMACHY measurements are in good agreement with the corresponding GOME-2 results, demon-strating the high precision of the AMC-DOAS method. The overall agreement between the satellite data sets and the ECMWF model data is also quite good, but the temporal vari-ation of the model data is much smoother such that not all small term variations in the water vapour columns seen by the satellite instruments are followed by the ECMWF data. In some cases small columns are overestimated by up to a factor of two by ECMWF whereas larger columns are some-times underestimated. This is also partly related to the differ-ent spatial resolution of the data sets, as the local variability of water vapour is both of temporal and spatial nature. This is illustrated by some examples for the spatial distribution of water vapour given at the top of Fig. 8a. Here, daily gridded
(0.5◦×0.5◦) GOME-2 water vapour total columns around the
region of Spitsbergen are shown for four selected days. On 7 May 2007 water vapour is quite homogeneously dis-tributed over Spitsbergen; in this case both GOME-2 and ECMWF data do not show much variation over the day and agree quite well. On 2 May 2007 most of the derived GOME-2 water vapour columns are higher than the ECMWF data. This could be related to a small plume of water vapour (yel-low in the plot) passing Spitsbergen that day which is not resolved by the ECMWF model. The water vapour total columns on 9 May 2007 are considerably high (sometimes
larger than 1 g/cm2) over the whole Spitsbergen area. These
high columns as well as their temporal variation is seen by all three data sets, but the rapid decrease of water vapour towards the end of the day is followed by the ECMWF data only with some delay. On the next day (10 May 2007) there is a quite sharp north-south gradient of water vapour just above the Spitsbergen island. In this case the ECMWF data are higher than both the GOME-2 and SCIAMACHY results, probably because some of the higher concentrations in the North go into the model. Taking into account the GOME-2 measurements of water vapour could therefore improve the model results.
Due to the large swath GOME-2 measurements at one place do not always occur at the same local time. The result-ing increased temporal coverage of GOME-2 enables studies of daily variability of atmospheric constituents especially at higher latitudes. As an example, Fig. 8b shows the relative variation of GOME-2 water vapour columns measured over
Ny ˚Alesund in May 2007 as a function of local time. These
data have been derived by dividing all measured columns of one day by the corresponding daily average; this is done
a) b) 0.5 0.6 0.7 0.8 0.9 1 1.1 1.2 1.3 1.4 08:00 10:00 12:00 14:00 16:00 18:00 20:00 22:00 Rel.W aterV apourColumn Local Time
GOME−2 Water Vapour (normalised to daily average), MAY 2007 Ny Ålesund 2 h Average Std. Dev.
0.0 0.2 0.4 0.6 0.8 1.0
H2O Vertical Column Amount, g/cm2
Ny lesundÅ Ny Alesund Ny Alesund Ny Alesund
20070502 20070507 20070509 20070510 Ny Ålesund 0.1 0.2 0.3 0.4 0.5 0.6 0.7 0.8 0.9 1 1.1 01 −May −2007 02 −May −2007 03 −May −2007 04 −May −2007 05 −May −2007 06 −May −2007 07 −May −2007 08 −May −2007 09 −May −2007 10 −May −2007 11 −May −2007 12 −May −2007 13 −May −2007 W aterV apourColumn,g/cm 2 UT GOME−2 (forward scan) SCIAMACHY (forward scan) ECMWF
Fig. 8. Local time variations of water vapour over Ny ˚Alesund. (a)
GOME-2, SCIAMACHY and ECMWF water vapour total columns 1–12 May 2007. For four selected days the spatial distribution of water vapour over the Spitsbergen area as seen by GOME-2 (daily gridded data) is shown. (b) Relative variation of GOME-2 water vapour columns over Ny ˚Alesund in May 2007 as function of local time. The black line shows averages of the Ny ˚Alesund data over two hours of local time, the grey lines and the underlying shaded area mark the corresponding standard deviations.
to remove the effects of varying absolute amounts of wa-ter vapour. Without any daily variations the relative column
data would be equal to 1. The Ny ˚Alesund data span almost
the whole day from 9:30 LT to 21:30 LT. Although the scat-ter of the data is quite high – which is not unusual for
wa-ter vapour – the Ny ˚Alesund data show a small daily cycle.
Highest columns occur around 15:00 LT, lowest columns in the morning and in the evening. The difference between av-erage maximum and minimum water vapour column is about 14%.
6 Conclusions
After GOME and SCIAMACHY the AMC-DOAS method has now also been successfully applied to GOME-2 mea-surements in the visible spectral region. The resulting wa-ter vapour total columns compare well with corresponding SCIAMACHY data, although there is some indication for a small scan angle dependency. The observed systematic East-West differences are on average below about 6% and thus in the order of the accuracy of the water vapour prod-uct. The scan angle dependency may be partly related to sys-tematic effects of the AMC-DOAS retrieval caused by the wide GOME-2 swath range. Other effects, like systematic mismatches in local time, are less probable but may also not been ruled out and need further investigation.
For a full assessment of the quality of the GOME-2 AMC-DOAS water vapour product additional validation
us-ing other water vapour data products is required.
Espe-cially, comparisons with the results from other nadir viewing MetOp instruments (like the Advanced Microwave Sound-ing Units AMSU-A1 and AMSU-A2, the High-resolution In-frared Radiation Sounder HIRS/4, the InIn-frared Atmospheric Sounding Interferometer IASI, and the Microwave Humid-ity Sounder MHS) providing water vapour data at minimum temporal and spatial offsets will be very useful in this con-text.
It should be made clear that from the perspective of water vapour retrieval despite of the observed systematic variations between GOME-2 and SCIAMACHY results the increased GOME-2 swath and the resulting increased spatial and tem-poral coverage is a clear advantage compared to GOME and SCIAMACHY. The periodical deviations of water vapour columns which may be related to a scan-angle dependency of the preliminary GOME-2 data are considered to be rather uncritical for the water vapour retrieval as they are very small and in the order of the assumed accuracy of the data product, especially compared to the scatter in the data which is mainly due to atmospheric variability. For middle and higher lati-tudes GOME-2 provides an at least daily coverage at similar spatial resolution as SCIAMACHY. In polar regions about six data points per day (during daytime) are possible. The better spatial coverage of the GOME-2 water vapour data set will allow for additional applications, like the investi-gation of sources and transport processes. Especially, the large GOME-2 swath width allows for the study of trace gas variations as a function of local time at higher latitudes, as has been shown by the analysis of GOME-2 measurements
obtained in May 2007 over Ny ˚Alesund which revealed a
small average daily variation of water vapour in the order of 14%. Although this is only a first result which requires fur-ther confirmation by independent measurements it shows the potential of GOME-2 to provide new information about wa-ter vapour total columns and variations especially in the polar regions.
Acknowledgements. SCIAMACHY is a national contribution to
the ESA ENVISAT project, funded by Germany, The Netherlands, and Belgium. SCIAMACHY data have been provided by ESA. GOME-2 data have been provided by EUMETSAT. We thank the European Center for Medium Range Weather Forecasts (ECMWF) for providing us with analysed meteorological fields. This work has been funded by DLR Space Agency (Germany) and by the University of Bremen and is part of and supported by the EU ACCENT Network of Excellence.
Edited by: P. Monks
References
Bauer, P. and Schluessel, P.: Rainfall, total water, ice water, and water vapor over sea from polarized microwave simulations and Special Sensor Microwave/Imager data, J. Geophys. Res., 98, 20 737–20 759, 1993.
Bovensmann, H., Burrows, J. P., Buchwitz, M., Frerick, J., No¨el, S., Rozanov, V. V., Chance, K. V., and Goede, A. H. P.: SCIA-MACHY – Mission Objectives and Measurement Modes, J. At-mos. Sci., 56, 127–150, 1999.
Buchwitz, M., No¨el, S., Bramstedt, K., Rozanov, V. V., Bovens-mann, H., Tsvetkova, S., and Burrows, J. P.: Retrieval of trace gas vertical columns from SCIAMACHY/ENVISAT near-infrared nadir spectra: First preliminary results, Adv. Space Res., 34, 809–814, 2004.
Burrows, J. P., Weber, M., Buchwitz, M., Rozanov, V., Ladst¨atter-Weißenmayer, A., Richter, A., de Beek, R., Hoogen, R., Bram-stedt, K., Eichmann, K.-U., Eisinger, M., and Perner, D.: The Global Ozone Monitoring Experiment (GOME): Mission Con-cept and First Scientific Results, J. Atmos. Sci., 56, 151–175, 1999.
Casadio, S., Zehner, C., Pisacane, G., and Putz, E.: Empirical re-trieval of the atmospheric air mass factor (ERA) for the mea-surement of water vapour vertical contenet using GOME data, Geophys. Res. Lett., 27, 1483–1486, 2000.
Dai, A., Wang, J., Ware, R. H., and Hove, T. V.: Diurnal variation in water vapor over North America and its implications for sam-pling errors in radiosonde humidity, J. Geophys. Res., 107(D10), doi:10.1029/2001JD000642, 2002.
Gao, B.-C. and Kaufman, Y. J.: Water vapor retrievals using Moderate Resolution Imaging Spectroradiometer (MODIS) near-infrared channels, J. Geophys. Res., 108, 4389, doi:10.1029/ 2002JD003023, 2003.
Gerding, M., Ritter, C., M¨uller, M., and Neuber, R.: Tropospheric water vapour soundings by lidar at high Arctic latitudes, Atmos. Res., 71, 289–302, 2004.
IPCC: Climate Change 2007: The Physical Science Basis, Con-tribution of Working Group I to the Fourth Assessment Report of the Intergovernmental Panel on Climate Change, edited by: Solomon, S., Qin, D., Manning, M., Chen, Z., Marquis, M., Av-eryt, K. B., Tignor, M., and Miller, H. L., Cambridge University Press, Cambridge, United Kingdom and New York, NY, USA, 996 pp., 2007.
Lang, R. and Lawrence, M. G.: Evaluation of the hydrological cycle of MATCH driven by NCEP reanalysis data: comparison with GOME water vapor field measurements, Atmos. Chem. Phys., 5,
887–908, 2005,
http://www.atmos-chem-phys.net/5/887/2005/.
Lang, R., Williams, J. E., van der Zande, W. J., and Maurellis, A. N.: Application of the Spectral Structure Parameterization technique: retrieval of total water vapor columns from GOME, Atmos. Chem. Phys., 3, 145–160, 2003,
http://www.atmos-chem-phys.net/3/145/2003/.
Lang, R., Casadio, S., Maurellis, A. N., and Lawrence, M. G.: Evaluation of the GOME Water Vapor Climatology 1995–2002, J. Geophys. Res., 112, D17 110, doi:10.1029/2006JD008246, 2007.
Li, Z., Muller, J.-P., Cross, P., Albert, P., Hewison, T., Watson, R., Fischer, J., and Bennartz, R.: Validation of MERIS Near IR Water Vapour Retrievals Using MWR and GPS Measure-ments, in: Proceedings of the MERIS User Workshop 10–13 November 2003 ESA-ESRIN, Frascati, Italy, http://envisat.esa. int/workshops/meris03/proceedings.html, 2003.
Maurellis, A. N., Lang, R., van der Zande, W. J., Aben, I., and Ubachs, W.: Precipitable Water Vapor Column Retrieval from GOME Data, Geophys. Res. Lett., 27, 903–906, 2000.
Melsheimer, C. and Heygster, G.: Improved retrieval of total water vapor over polar regions from AMSU-B microwave radiometer data, IEEE Trans. Geosci. Remote Sens., in press, 2008. Mieruch, S., No¨el, S., Bovensmann, H., and Burrows, J. P.:
Anal-ysis of global water vapour trends from satellite measurements in the visible spectral range, Atmos. Chem. Phys., 8, 491–504, 2008,
http://www.atmos-chem-phys.net/8/491/2008/.
Munro, R., Eisinger, M., Anderson, C., Callies, J., Corpaccioli, E., Lang, R., Lefebvre, A., Livschitz, Y., and Albi˜nana, A. P.: GOME-2 on MetOp, in: Proc. of The 2006 EUMETSAT Me-teorological Satellite Conference, Helsinki, Finland, 12–16 June 2006, EUMETSAT P.48, 2006.
No¨el, S., Buchwitz, M., Bovensmann, H., Hoogen, R., and Bur-rows, J. P.: Atmospheric Water Vapor Amounts Retrieved from GOME Satellite Data, Geophys. Res. Lett., 26, 1841–1844, 1999.
No¨el, S., Buchwitz, M., and Burrows, J. P.: First retrieval of global water vapour column amounts from SCIAMACHY measure-ments, Atmos. Chem. Phys., 4, 111–125, 2004,
http://www.atmos-chem-phys.net/4/111/2004/.
No¨el, S., Buchwitz, M., Bovensmann, H., and Burrows, J. P.: Val-idation of SCIAMACHY AMC-DOAS water vapour columns, Atmos. Chem. Phys., 5, 1835–1841, 2005,
http://www.atmos-chem-phys.net/5/1835/2005/.
No¨el, S., Mieruch, S., Bovensmann, H., and Burrows, J. P.: A Com-bined GOME and SCIAMACHY Global Water Vapour Data Set, in: Proc. ENVISAT Symposium, Montreux, Switzerland, 23–27 April 2007, ESA SP-636, 2007.
Wagner, T., Heland, J., Z¨oger, M., and Platt, U.: A fast H2O total
column density product from GOME – Validation with in-situ aircraft measurements, Atmos. Chem. Phys., 3, 651–663, 2003, http://www.atmos-chem-phys.net/3/651/2003/.
Wagner, T., Beirle, S., Grzegorski, M., and Platt, U.: Global trends (1996–2003) of total column precipitable water observed by Global Ozone Monitoring Experiment (GOME) on ERS-2 and their relation to near-surface temperature, J. Geophys. Res., 111, D12 102, doi:10.1029/2005JD006523, 2006.