HAL Id: hal-00302058
https://hal.archives-ouvertes.fr/hal-00302058
Submitted on 9 Aug 2006HAL is a multi-disciplinary open access
archive for the deposit and dissemination of sci-entific research documents, whether they are pub-lished or not. The documents may come from teaching and research institutions in France or abroad, or from public or private research centers.
L’archive ouverte pluridisciplinaire HAL, est destinée au dépôt et à la diffusion de documents scientifiques de niveau recherche, publiés ou non, émanant des établissements d’enseignement et de recherche français ou étrangers, des laboratoires publics ou privés.
Night-time radical chemistry during the NAMBLEX
campaign
R. Sommariva, M. J. Pilling, W. J. Bloss, D. E. Heard, J. D. Lee, Z. L.
Fleming, P. S. Monks, J. M. C. Plane, A. Saiz-Lopez, S. M. Ball, et al.
To cite this version:
R. Sommariva, M. J. Pilling, W. J. Bloss, D. E. Heard, J. D. Lee, et al.. Night-time radical chem-istry during the NAMBLEX campaign. Atmospheric Chemchem-istry and Physics Discussions, European Geosciences Union, 2006, 6 (4), pp.7715-7745. �hal-00302058�
ACPD
6, 7715–7745, 2006 Night-time radical chemistry during NAMBLEX R. Sommariva et al. Title Page Abstract Introduction Conclusions References Tables Figures J I J I Back CloseFull Screen / Esc
Printer-friendly Version Interactive Discussion
EGU Atmos. Chem. Phys. Discuss., 6, 7715–7745, 2006
www.atmos-chem-phys-discuss.net/6/7715/2006/ © Author(s) 2006. This work is licensed
under a Creative Commons License.
Atmospheric Chemistry and Physics Discussions
Night-time radical chemistry during the
NAMBLEX campaign
R. Sommariva1,*, M. J. Pilling1, W. J. Bloss1, D. E. Heard1, J. D. Lee1,**,
Z. L. Fleming2, P. S. Monks2, J. M. C. Plane3,***, A. Saiz-Lopez3,****, S. M. Ball4,*****, M. Bitter4, R. L. Jones4, N. Brough3, S. A. Penkett3, J. R. Hopkins5, A. C. Lewis5, and K. A. Read1
1
School of Chemistry, University of Leeds, Leeds, UK
2
Department of Chemistry, University of Leicester, Leicester, UK
3
School of Environmental Sciences, University of East Anglia, Norwich, UK
4
University Chemical Laboratory, University of Cambridge, Cambridge, UK
5
Department of Chemistry, University of York, York, UK
*
Now at Earth System Research Laboratory, National Oceanic and Atmospheric Administration, Boulder, CO, USA
**
Now at Department of Chemistry, University of York, York, UK
***
Now at School of Chemistry, University of Leeds, Leeds, UK
****
Now at NASA Jet Propulsion Laboratory, California Institute of Technology, Pasadena, CA, USA
*****
Now at Department of Chemistry, University of Leicester, Leicester, UK Received: 8 May 2006 – Accepted: 15 June 2006 – Published: 9 August 2006 Correspondence to: M. J. Pilling (M.J.Pilling@leeds.ac.uk)
ACPD
6, 7715–7745, 2006 Night-time radical chemistry during NAMBLEX R. Sommariva et al. Title Page Abstract Introduction Conclusions References Tables Figures J I J I Back CloseFull Screen / Esc
Printer-friendly Version Interactive Discussion
EGU
Abstract
Night-time chemistry in the Marine Boundary Layer has been modelled using a number of observationally constrained zero-dimensional box-models. The models were based upon the Master Chemical Mechanism (MCM) and the measurements were taken dur-ing the North Atlantic Marine Boundary Layer Experiment (NAMBLEX) campaign at
5
Mace Head, Ireland in July–September 2002.
The model could reproduce, within the combined uncertainties, the measured con-centration of HO2 (within 30−40%) during the night 31 August–1 September and of HO2+RO2(within 15−30%) during several nights of the campaign. The model always overestimated the NO3measurements made by Differential Optical Absorption
Spec-10
troscopy (DOAS) by up to an order of magnitude or more, but agreed with the NO3 Cavity Ring-Down Spectroscopy (CRDS) measurements to within 30−50%. The most likely explanation of the discrepancy between the two instruments and the model is reaction of the nitrate radical with inhomogeneously distributed NO, which was mea-sured at concentrations of up to 10 ppt, even though this is not enough to fully explain
15
the difference between the DOAS measurements and the model.
A rate of production and destruction analysis showed that radicals were generated during the night mainly by the reaction of ozone with light alkenes. The cycling between HO2/RO2 and OH was maintained during the night by the low concentrations of NO and the overall radical concentration was limited by slow loss of peroxy radicals to form
20
peroxides. A strong peak in [NO2] during the night 31 August–1 September allowed an insight into the radical fluxes and the connections between the HOx and the NO3 cycles.
1 Introduction
Radical chemistry during the night is controlled by the reactivity of ozone and of the
25
ACPD
6, 7715–7745, 2006 Night-time radical chemistry during NAMBLEX R. Sommariva et al. Title Page Abstract Introduction Conclusions References Tables Figures J I J I Back CloseFull Screen / Esc
Printer-friendly Version Interactive Discussion
EGU present in significant concentrations only during the night, since it is quickly photolyzed
by sunlight yielding either NO2or NO.
NO2+ O3→ NO3+ O2 (R1)
NO3reacts with NO2to form N2O5, which thermally decomposes giving back NO2and NO3(R2). In the night-time boundary layer NO3and N2O5quickly reach an equilibrium,
5
unless the concentration of NO2is very low (Allan et al.,2000). N2O5therefore acts as an important reservoir of oxidized nitrogen, directly or through the production of HNO3 via the reaction with water (R3–R4) (Atkinson et al., 2003). N2O5 and NO3 are also uptaken on aerosol.
NO3+ NO2+ M N2O5+ M (R2)
10
N2O5+ H2O → 2HNO3 (R3)
N2O5+ 2H2O → 2HNO3+ H2O (R4)
NO3reacts with alkenes and some aromatics (Atkinson and Arey,2003). The reaction proceeds either by H-abstraction or by addition to the double-bond producing peroxy and nitro-peroxy radicals which then react with NO, HO2or other peroxy radicals.
Re-15
action with NO leads to the formation of HO2 and, via the reaction of HO2 with NO and/or O3, to the formation of OH. In this way the nitrate radical acts as a source of HOx during the night, when ozone and formaldehyde photolysis, the main sources of HOxradicals during the day, are absent.
Another significant source of HOx during the night is the decomposition of Criegee
20
intermediates from the reaction of ozone with alkenes (Atkinson and Arey,2003). The relative importance of NO3 and O3as HOx sources during the night depends on NOx and hydrocarbon concentrations.
Many studies on NO3 chemistry have been reported, e.g. Allan et al.(1999,2000); Brown et al.(2003,2004);Vrekoussis et al. (2004), but comparatively few have been
25
ACPD
6, 7715–7745, 2006 Night-time radical chemistry during NAMBLEX R. Sommariva et al. Title Page Abstract Introduction Conclusions References Tables Figures J I J I Back CloseFull Screen / Esc
Printer-friendly Version Interactive Discussion
EGU was measured at night at concentrations of up to 7.6×10⁷molecule cm−3at Oki Island
(Kanaya et al., 1999), 1.4×10⁸molecule cm−3 at Okinawa (Kanaya et al., 2001) and 1.1×10⁸ molecule cm−3 at Rishiri Island (Kanaya et al.,2002). In all three campaigns the radical source was attributed to the reactions of alkenes and monoterpenes with O3with little or no contribution by NO3chemistry. Carslaw et al.(1997) found a positive
5
correlation between NO3 and HO2+RO2 during spring and autumn at Weybourne on the North Sea, evidence of production of peroxy radicals from reactions of the nitrate radical. No OH and HO2 measurements were made during that campaign. Salis-bury et al. (2001) reported a study of nocturnal peroxy radicals at Mace Head under comparatively clean conditions during the EASE97 campaign. HO2was measured on
10
two nights at concentrations of up to 5.1×10⁷molecule cm−3. Their study showed that ozone-initiated oxidation routes of alkenes outweighed those of NO3, except when the air was coming from the west and south-west sector. An analysis of peroxy radicals during the night at Cape Grim was also reported byMonks et al.(1996).
This paper discusses modelling and measurements of radicals (OH, HO2, organic
15
peroxy radicals and NO3) at Mace Head, Ireland, during the North Atlantic Marine Boundary Layer Experiment (NAMBLEX) (Heard et al., 2005). The campaign took place during the summer of 2002 (July–September) and involved ten British univer-sities (Aberystwyth, Bristol, Birmingham, Cambridge, East Anglia, Edinburgh, Leeds, Leicester, UMIST, York) and the National University of Ireland, Galway. A complete
20
overview of the campaign is inHeard et al.(2005). Description and analysis of the rad-ical measurements can be found in Smith et al.(2006) and Saiz-Lopez et al.(2005). Two companion papers describe OH and HO2 day-time chemistry (Sommariva et al., 2006) and peroxy radical (HO2and HO2+RO2) chemistry (Fleming et al.,2005) during NAMBLEX.
25
Section2of the paper briefly describes the models and the measurements used in this work. Sections 3 and 4 discuss the model-measurements comparisons of OH, HO2, HO2+RO2 and of NO3, NO3+N2O5, respectively. Section 5 contains a detailed rate of production and destruction analysis and Sect. 6 an analysis of one particular
ACPD
6, 7715–7745, 2006 Night-time radical chemistry during NAMBLEX R. Sommariva et al. Title Page Abstract Introduction Conclusions References Tables Figures J I J I Back CloseFull Screen / Esc
Printer-friendly Version Interactive Discussion
EGU night of NAMBLEX (31 August–1 September). Finally, Sect.7 contains the summary
and the main conclusions of this work.
2 Models and measurements
The models used in this work are described in detail inSommariva et al.(2006). They were built following the guidelines detailed inCarslaw et al.(1999) and inSommariva
5
et al. (2004) and using version 3.1 of the Master Chemical Mechanism (MCM, http: //mcm.leeds.ac.uk/).
Four base models, with different degrees of chemical complexity, were used to study the impact of hydrocarbons, oxygenates and peroxides on the calculated concentra-tions of radicals. All the models were constrained to 15 min averages of measured
10
concentrations of CO, CH4, H2, O3, NO, NO2, HCHO, selected NMHCs, H2O and to measured temperature and photolysis rates (j(O1D), j(NO2), j(HONO), both channels of j(HCHO), j(CH3COCH3), j(CH3CHO)). The constraints of the different models used in this work are shown in Table1.
The NMHCs data were linearly interpolated to 15 min. The measured species were:
15
ethane, propane, i-butane, n-butane, i-pentane, n-pentane, n-hexane, n-heptane, ethene, propene, acetylene, trans-2-butene, but-1-ene, i-butene, cis-2-butene, 1,3-butadiene, isoprene, benzene, toluene, ethylbenzene, m-xylene+ p-xylene, o-xylene plus three oxygenates (acetaldehyde, methanol, acetone) and two peroxides (H2O2 and CH3OOH) (Lewis et al.,2005). SO2was not measured and was set to a constant
20
value of 55 ppt (Berresheim et al.,2002).
No peroxides measurements were available after 30 August. Even before 30 Au-gust their concentrations, and in particular [CH3OOH], were often below or close to the detection limit (0.02 ppb,Morgan and Jackson(2002)). HCHO was measured with two techniques (Still et al.,2005). The University of East Anglia (UEA) measurements
25
were used to constrain the model, because they were made closer to the radical mea-surements than the Leeds meamea-surements. HCHO data were not available after August
ACPD
6, 7715–7745, 2006 Night-time radical chemistry during NAMBLEX R. Sommariva et al. Title Page Abstract Introduction Conclusions References Tables Figures J I J I Back CloseFull Screen / Esc
Printer-friendly Version Interactive Discussion
EGU 21, therefore the models for the following days were not constrained to HCHO, which
was instead calculated. Also, measurements of chloroform (CHCl3) were not available before 3 August. The omission of peroxides, formaldehyde and chloroform did not influ-ence significantly the calculated concentrations of radicals at night. In the models which were not constrained to the concentrations of oxygenates and hydroperoxides
concen-5
trations (“clean” and “full” models), these species were calculated as intermediates and the calculated concentrations were, especially for species with longer lifetimes, more than an order of magnitude less than the measured concentrations, because of the importance of transport.
Dry deposition terms were also included using the values ofDerwent et al.(1996)
ex-10
cept for peroxides (1.1 cm s−1 for H2O2 and 0.55 cm s−1 for organic peroxides), methyl and ethyl nitrate (1.1 cm s−1) and HCHO (0.33 cm s−1) (Brasseur et al.,1998). Dry de-position velocity for CH3CHO and other aldehydes was assumed to be the same as that for HCHO. A clear diurnal cycle of the boundary layer (BL) was not always rec-ognizable during NAMBLEX and often the synoptic pattern dominated over the local
15
conditions (Norton et al., 2006). On many days during the campaign the boundary layer was roughly constant throughout the day with heights of 700–1500 m, while on a few days, such as 9 August, the BL showed a diurnal variation with a height of 1000– 1500 m during the day and 400–500 m during the night.
Heterogeneous uptake was calculated using Eq. (1) assuming irreversible loss of
20
gas-phase species on aerosol.
khet=Av γ¯
4 (1)
where A is the total aerosol surface area, ¯v is the mean molecular speed and γ is the
temperature dependent gas/surface reaction probability. The values of γ used for HO2, NO3, N2O5 were 0.006 (at 298 K), 0.004 and 0.032, respectively (Gratpanche et al.,
25
1996;Allan et al.,1999;Behnke et al.,1997).
The models were used to calculate OH, HO2, total peroxy radicals (HO2+RO2), NO3 (or NO3+N2O5) for several nights of the campaign. The model results were compared
ACPD
6, 7715–7745, 2006 Night-time radical chemistry during NAMBLEX R. Sommariva et al. Title Page Abstract Introduction Conclusions References Tables Figures J I J I Back CloseFull Screen / Esc
Printer-friendly Version Interactive Discussion
EGU to the measurements. OH and HO2 were measured by laser-induced fluorescence
(LIF) using the FAGE (Fluorescence Assay by Gas Expansion) technique. During the night the detection limits for the two radicals were 6×10⁴ and 1×10⁶molecule cm−3, respectively (Smith et al., 2006). Total peroxy radicals (HO2+RO2) were measured by the PERCA (Peroxy Radical Chemical Amplifier) technique with a detection limit of
5
about 0.5 ppt. The FAGE and the PERCA instruments are described inSmith et al. (2006) andFleming et al.(2005), respectively.
NO3 was measured by Differential Optical Absorption Spectroscopy (DOAS). The DOAS instrument was located about 100 m from the shore with the retro-reflector on an island about 4 km west of Mace Head. The total light path was 8.4 km and NO3
10
was measured in the 645–680 nm spectral region with a detection limit of 0.4–0.5 ppt (Saiz-Lopez et al.,2005). A Cavity Ring-Down Spectrometer (CRDS) was also present at Mace Head. It was located about 25 m inland from the DOAS. The CRDS measured NO3and NO3+N2O5in the spectral region 655–675 nm with an estimated light path of ∼20 km and a detection limit of approximately 1 ppt, depending on the aerosol loading
15
(Bitter et al.,2005). The details of the two instruments are given inSaiz-Lopez et al. (2005);Bitter et al.(2005).
The modelling of the night-time chemistry in the marine boundary layer was concen-trated on a few nights, which can be divided roughly in two periods. The semi-polluted period at the beginning of August (1–5 August), and the unpolluted period during the
20
rest of the campaign (Heard et al.,2005). The semi-polluted period was characterized by comparatively high concentrations of NOx, CO, and NMHCs (Table 2). Acetylene, an anthropogenic marker, was 2 to 3 times higher than during other periods of the campaign. The five-day back trajectories showed that the air masses arriving at Mace Head were coming from east-northeast, passing over Northern England and Ireland
25
(Norton et al.,2006). Most of the rest of the campaign and particularly the night 31 August–1 September was characterized by comparatively unpolluted conditions, with low NOxand hydrocarbons concentrations (Table2) and air masses of oceanic origin coming from west, north-west and south-west. More details on the chemical conditions
ACPD
6, 7715–7745, 2006 Night-time radical chemistry during NAMBLEX R. Sommariva et al. Title Page Abstract Introduction Conclusions References Tables Figures J I J I Back CloseFull Screen / Esc
Printer-friendly Version Interactive Discussion
EGU during NAMBLEX can be found inHeard et al.(2005) and a complete discussion of the
meteorology during the campaign can be found inNorton et al.(2006).
3 OH, HO2and RO2
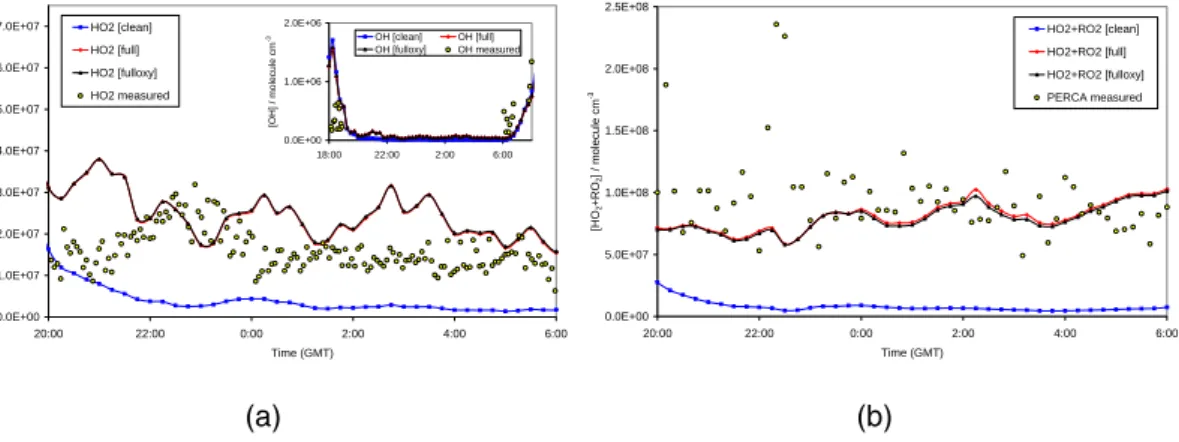
OH and HO2 were measured during one night (31 August–1 September). OH was always below the instrumental detection limit (6×10⁴molecule cm−3). Late
5
evening and early morning measurements showed concentrations of the order of 1– 2×10⁵molecule cm−3, about twice as much as the modelled concentration during the night (Fig.1(a)). The model overestimated the measurements at sunset, but underes-timated them at sunrise suggesting the presence of an OH source unaccounted for or underestimated by the model, such as HONO (Smith et al.,2006).
10
HO2 concentrations of the order of 1–3×10⁷molecule cm−3 were detected, similar to previous measurements in Mace Head during two nights of the EASE97 campaign (1.5–5×10⁷molecule cm−3, Salisbury et al. (2001)). The models overestimated HO2 by about 30–40% (Fig.1(a)). Compared to daytime, when the model overestimated the measurements by about a factor of 2 (Sommariva et al.,2006), the agreement
be-15
tween the model and the measurements is reasonably good and well within the com-bined uncertainties of the model and of the instrument (25–30% and 50%, respectively, Sommariva et al.,2004).
PERCA measurements were taken every night during the campaign. The compar-isons with the model results are shown in Fig. 1(b) and Fig. 2(a). The agreement
20
between modelled and measured HO2+RO2 was within 15–30% during most of the modelled nights. Contrary to the day-time, the model showed a tendency to under-estimate the PERCA measurements during the night (see Fig. 4b in Fleming et al., 2005). During the night 20–21 August the model underestimated the measurements by about 50% (Figs.1(b)–2(a)). On some occasions measured [HO2+RO2] increased
25
throughout the night, which appeared to be related to NOxevents, but was not always reproduced by the model (e.g. 17–18 August). Fleming et al.(2005) showed that the
ACPD
6, 7715–7745, 2006 Night-time radical chemistry during NAMBLEX R. Sommariva et al. Title Page Abstract Introduction Conclusions References Tables Figures J I J I Back CloseFull Screen / Esc
Printer-friendly Version Interactive Discussion
EGU measured peroxy radicals concentration during the night was generally higher at higher
[NOx].
The speciation of modelled peroxy radicals during NAMBLEX, showed that CH3O2 was the dominant radical during the night. In the unpolluted period CH3O2 was up to 60% of HO2+RO2, while HO2 was about 20% of HO2+RO2. This was approximately
5
the reverse of the day-time proportion and in good agreement with the results of the EASE97 campaign bySalisbury et al.(2001). During the semi-polluted period CH3O2 was up to 40% of HO2+RO2, while HO2was about 40% of HO2+RO2indicating a faster production of inorganic radicals in presence of higher NOxand NMHCs concentrations. The modelled HO2/(HO2+RO2) ratio was about 50% higher than the measured ratio,
10
as a consequence of the overestimation of HO2(Fleming et al.,2005).
Comparing the results of the different models (Table 1) it is clear that the difference between the “full”, ‘fulloxy’ and “fulloxyper” models was negligible (Figs. 1 and 2(a)), indicating that additional constraints of oxygenates and peroxides did not influence significantly the concentrations of HO2and RO2. However for the “clean” model, which
15
was constrained only to CO and CH4, calculated concentrations of HO2 (Fig. 1(a)) and HO2+RO2(Figs.1(a)and2(a)) were about an order of magnitude lower than the concentrations calculated by the “full” and “fulloxy” models. This was due to the fact that the only peroxy radical of the “clean” model was CH3O2, which mainly came from CH4 oxidation, a very slow reaction at night (kCH
4+NO3<1×10
−18
cm3molecule−1s−1,
20
Atkinson et al.,2003).
Similar results were obtained during the baseline periods of the SOAPEX-2 cam-paign in the Southern Hemisphere using a model similar to the “clean” model ( Som-mariva et al.,2004). On one occasion (15–16 February 1999), late evening and early morning measurements of OH and HO2 were made, showing late evening
concen-25
trations of HO2 about a factor of two larger than the predictions of the “clean” model (Fig.2(b)). The model underestimated HO2+RO2 by about almost an order of mag-nitude, a similar factor to that found when using the ‘clean’ model for NAMBLEX (Fig.1(b)). Since the more detailed models (“full”, “fulloxy” and “fulloxyper”) provide
ACPD
6, 7715–7745, 2006 Night-time radical chemistry during NAMBLEX R. Sommariva et al. Title Page Abstract Introduction Conclusions References Tables Figures J I J I Back CloseFull Screen / Esc
Printer-friendly Version Interactive Discussion
EGU much better agreement with the NAMBLEX observations of HO2+RO2, this
observa-tion suggests that even in the extremely clean condiobserva-tions of Cape Grim (Sommariva et al., 2004) CO and CH4 alone cannot account for the radical budget and even low concentrations of NMHCs play a significant role.
4 NO3
5
The nitrate radical was measured for many nights during NAMBLEX by DOAS and CRDS (Saiz-Lopez et al.,2005; Bitter et al., 20061). Data from the CRDS instrument were available only for the initial semi-polluted period of the campaign when the con-centrations were higher (Table2). The model-measurements comparisons are shown in Fig.3.
10
The models always underestimated the DOAS measurements of [NO3], on average by about a factor of 4–5 up to a factor of 10 (Figs. 3(b)–3(c)). On some nights, like 18–19 and 19–20 August, the modelled concentrations of NO3 were up to 60 times lower than the DOAS measurements. This was similar to the results obtained for the one night in the SOAPEX-2 campaign which was modelled (15–16 February 1999) and
15
for which NO3measurements were available (Fig.2(b)).
The agreement between modelled NO3 and NO3+N2O5and the measurements by CRDS was generally better (Fig.3(a)). Modelled concentrations were typically within 30–50% of the measurements, with the model showing a tendency to underestimate the measurements. Note that on the night 1–2 August the high CRDS measurements
20
before midnight (Fig.3(a)) were subject to a larger uncertainty than the measurements taken later in the night, due to the higher aerosol optical depth (Bitter et al., 20061).
A detailed comparison between the DOAS and CRDS measurements and a discus-sion of the possible reasons for the different [NO3] measured by the two instruments
1
Bitter, M., Ball, S. M., Povey, I. M., Jones, R. L., Saiz-Lopez, A., and Plane, J. M. C.:
Measurements of NO3, N2O5, OIO, I2, water vapour and aerosol optical depth by broadband
ACPD
6, 7715–7745, 2006 Night-time radical chemistry during NAMBLEX R. Sommariva et al. Title Page Abstract Introduction Conclusions References Tables Figures J I J I Back CloseFull Screen / Esc
Printer-friendly Version Interactive Discussion
EGU is presented in Bitter et al. (2006)1. An important point to note is that while the DOAS
measurements were averages over a long path (8.4 km at Mace Head) crossing a branch of sea, the CRDS measurements were point measurements made about 100 m from the shore (Heard et al.,2005). The fact that the model-DOAS discrepancy was similar in such diverse conditions as SOAPEX-2 (Sommariva et al.,2004) and
NAM-5
BLEX (Table2) in contrast with the good agreement between the model and the CRDS point measurements suggests that the zero-dimensional approach used in this work might not be suitable to model DOAS measurements.
Under the relatively low [NO2] conditions at Mace Head, NO3and N2O5rapidly equi-librate (R3) and any loss of N2O5resulted in the removal of NO3from the system. N2O5
10
can be removed by reaction with H2O and by uptake on aerosol. Previous studies have shown that, under certain conditions (semi-polluted air masses with little marine influ-ence), removal of N2O5can be a major loss pathway for NO3(Allan et al.,1999,2000). Semi-polluted conditions were experienced at the beginning of the NAMBLEX cam-paign (1–2 August). To test the impact of N2O5 uptake on modelled [NO3] the model
15
was run with an uptake rate coefficient for N2O5 equal to 0.016 (in the base model
γN
2O5=0.032). The effect on modelled [NO3] was negligible (model “fulloxy-n2o5” in
Fig.3(a)), showing that the model was not very sensitive to N2O5heterogeneous up-take under these conditions.
An important issue in night-time chemistry is the concentration of nitric oxide. NO
20
rapidly reacts with radicals, for which there are few night-time sources, and with ozone. With 30 ppb of O3, NO has a lifetime of about 1 min at 283 K. Its concentration is there-fore expected to be extremely low during the night. However, this is not always the case, since NO local sources might be present. During NAMBLEX, NO concentra-tions above the detection limit of the instrument (3–4 ppt) were often detected during
25
the night. The night-time average mixing ratio was about 15–20 ppt during the semi-polluted period and about 6.5–7 ppt during the unsemi-polluted period. This suggests the presence of a local source of NO, possibly emissions from the soil during the night.
ACPD
6, 7715–7745, 2006 Night-time radical chemistry during NAMBLEX R. Sommariva et al. Title Page Abstract Introduction Conclusions References Tables Figures J I J I Back CloseFull Screen / Esc
Printer-friendly Version Interactive Discussion
EGU reaction), particularly in Ireland, because of the presence of peaty soils around Mace
Head (Williams and Fehsenfeld, 1991; Williams et al., 1992; Regina et al., 19998). Since the DOAS sampled over the sea, while the CRDS sampled over the land, local NO soil emissions might explain the difference between the two instrument’s measure-ments and the underestimation of the DOAS observations by the model. This
hypothe-5
sis is discussed in more detail in Bitter et al. (2006)1, who used a simple box model to show how NO emitted over land could suppress NO3at the levels observed by CRDS but, as the air mass was advected over the sea and away from the NO source by o ff-shore winds, the concentration of NO3would steadily increase to the levels observed by DOAS. Conversely under a sea-breeze, the higher NO3concentrations maintained
10
over the sea are rapidly titrated by the NO emissions at the shore when the air mass arrives over the land (Bitter et al., 2006)1.
The “clean” and the “fulloxy” models were therefore run with measured NO during the day and [NO]=0 during the night to understand the impact of nitric oxide on modelled NO3and to see if this could explain the discrepancy between the model and the DOAS
15
measurements. The results of these test runs are shown in Fig.4. Also shown are the results of model runs with [DMS]=0 and with both [NO] and [DMS]=0.
Figure 4 suggests that setting [DMS] to zero did not have a significant effect on the calculated NO3, except when the models were also constrained to zero [NO]. In fact, when the models were constrained to measured NO, the main fate of NO3 was
20
the reaction with NO. The models showed that when both [DMS] and [NO] were set to zero, NO3 mainly reacted with NMHCs. These reactions were slower, resulting in a higher [NO3] and the models became more sensitive to DMS. Therefore, when both [DMS] and [NO] were set to zero, [NO3] became 3–4 times larger than when NO was present. However, this was not enough to increase the calculated [NO3] up
25
to the values measured by the DOAS and caused an overestimation of the CRDS measurements (about 40–50% and up to a factor of 3).
Another issue which might be significant in explaining the differences between the DOAS, the CRDS and the models is the vertical profile of NO3.Saiz-Lopez et al.(2005)
ACPD
6, 7715–7745, 2006 Night-time radical chemistry during NAMBLEX R. Sommariva et al. Title Page Abstract Introduction Conclusions References Tables Figures J I J I Back CloseFull Screen / Esc
Printer-friendly Version Interactive Discussion
EGU observed a positive vertical NO3gradient over Mace Head, which they attributed in part
to the temperature and NO2vertical profile and in part to the reaction of NO3with DMS, whose concentration was higher near the sea surface (Purvis et al.,2005). The NO3 gradient could also cause a downward motion of NO3over the ocean. This could in part explain the fact that the DOAS measurements were higher than the CRDS
measure-5
ments (Bitter et al., 2006)1. In fact, while the heights of the CRDS and of the DOAS telescope were roughly the same, the DOAS retro-reflector was located at a higher position, so the average height of measurement for DOAS measurements was greater than that of the CDRS. A significant vertical gradient in [NO3] would compromise the zero-dimensional model used in this study and lead to poor prediction of the measured
10
[NO3].
5 Analysis of the radical fluxes
The rates of production and destruction of modelled OH, HO2and NO3were calculated for the nights 1 and 2 August, characterized by semi-polluted conditions and higher [NO3], and 31 August and 1 September, characterized by unpolluted conditions and
15
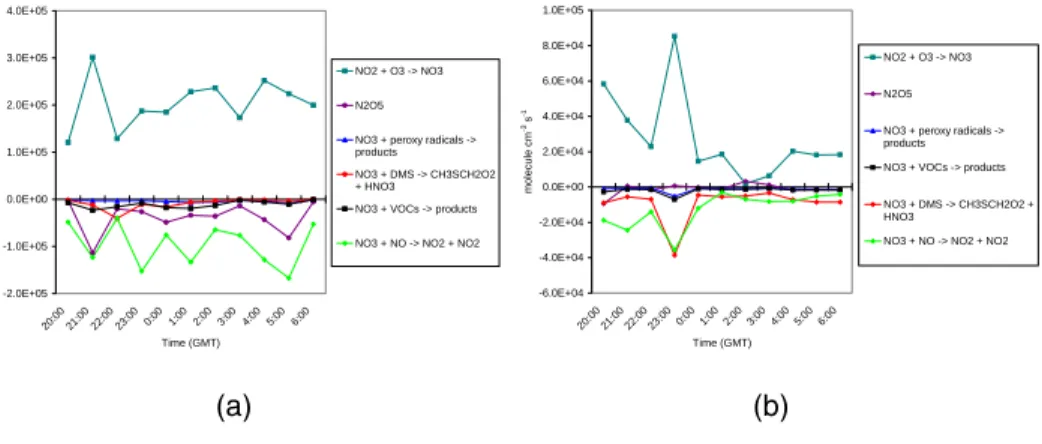
lower [NO3] (Table 2). The objective of the analysis was to identify the most important reactions and the processes driving the night-time chemistry under those conditions. The “fulloxy” model was used as reference. The results of the rate of production and destruction analysis are shown in Fig.5for HOxduring the night 31 August–1 Septem-ber and in Fig.6for NO3during the nights of 1–2 August and 31 August–1 September.
20
There were essentially two interacting chain cycles, one directly linking OH to HO2 via CO, the other proceeding via RO2, with CH3O2 as the main immediate precursor of HO2. The time constant of the former was quite short, of the order of 1 s, and was largely determined by the OH reactions shown in Fig.5(a), primarily involving CO, but also HCHO, O3 and H2. The route through CH3O2 involved not only reaction of OH
25
with CH4, but also with NMHCs. There were also two other, longer time constants associated with the chain cycle, involving the conversion of CH3O2to HO2 by reaction
ACPD
6, 7715–7745, 2006 Night-time radical chemistry during NAMBLEX R. Sommariva et al. Title Page Abstract Introduction Conclusions References Tables Figures J I J I Back CloseFull Screen / Esc
Printer-friendly Version Interactive Discussion
EGU with NO and of HO2 to OH by reaction with O3 and NO, with the latter decreasing
in importance with time. If there was no source term, the coupled radical pool would slowly decay, via both peroxy-peroxy and OH+NO2 reactions. There was, however, a radical source (mainly of OH and CH3O2), provided by Criegee intermediates formed from O3+alkene reactions (mainly propene, c-2-butene, butene, c-2-pentene,
t-2-5
pentene), that helped to maintain the radical concentrations, although there was gener-ally a slow decrease with time. The decomposition of CH3SO3to give SO3and CH3O2 and the reaction of CH3CO3with NO provided additional CH3O2sources.
Fleming et al. (2005) calculated the fluxes of radicals from alkenes+O3 and alkenes+NO3 during several nights of the NAMBLEX campaign. They showed that
10
ozone reactivity dominated the formation of radicals most of the nights, except when the NO3concentration was high, such as in the semi-polluted period at the beginning of the campaign. This is in broad agreement with the results of the reaction rate analysis discussed above (it must be noted thatFleming et al.(2005) used [NO3] as measured by DOAS, which was typically an order of magnitude higher than the modelled [NO3]
15
used here).
On the night of 1-2 August, the main formation and destruction routes for NO3were NO2+O3and NO3+NO2respectively (Fig.6). The NO3+NO2N2O5equilibration was rapid but led to a net sink for NO3, because of the loss of N2O5 by hydrolysis and heterogeneous uptake. On 31 August–1 September, the N2O5loss was less significant
20
than on 1–2 August, so that the forward and reverse steps in the equilibration balanced. The main losses of NO3on both nights were the reactions with NO and with DMS. On the unpolluted night 31 August–1 September the two reaction rates were comparable (∼5×10³molecule cm−3s−1), while on the semi-polluted night 1–2 August the reaction with NO was about a factor of 4 faster (Fig.6). In fact, on this night the concentration
25
of NO was generally higher (about a factor of 3 during the night), as polluted air arrived at Mace Head from the north-east, and the DMS concentration was lower. Other sinks for NO3were the reactions with a range of NMHCs (mainly alkenes like but-1-ene and t-2-butene and aromatics like phenol and cathecols) and peroxy radicals (HO2 and
ACPD
6, 7715–7745, 2006 Night-time radical chemistry during NAMBLEX R. Sommariva et al. Title Page Abstract Introduction Conclusions References Tables Figures J I J I Back CloseFull Screen / Esc
Printer-friendly Version Interactive Discussion
EGU CH3O2).
6 A case-study night
Measurements of HO2, HO2+RO2 and NO3 were all made on the night between 31 August and 1 September. OH was also measured, but was always below the detection limit. A large spike of NO2 occurred in the middle of the night allowing the couplings
5
between the species and the cycles of HOxand NO3to be studied.
Between 22:00 and 24:00 on 31 August the measured concentration of NO2 rose from its “normal” value of 40 ppt to about 300 ppt. The concentration of NO did not change as much (Fig.7). The spike appeared to be related to a change in the local wind direction from ∼200◦(S-SW, from the open sea) to ∼150◦(S-SE, along the coastline).
10
The most probable explanation was a local source of NO2, which was brought to the instrument as the wind shifted direction. Figure 8 shows the reactions of the most important species in the night-time chemistry on 31 August–1 September (Sect.5) and their connections via ozone and NO. O3 in particular had a double role. It converted HO2 to OH, and also reacted with NO2 to generate NO3. NO2 was produced from
15
NO, through its reactions with CH3O2and HO2. NO3and NO2were linked through the reaction NO3+NO and through the equilibrium of N2O5. Ozone, nitrogen oxides (NO, NO2, NO3) and OH, HO2 and CH3O2 were therefore interconnected and a change in the concentration of one of these species, namely NO2, quickly propagated through the cycles to affect all the others.
20
The fluxes during the NO2 event (23:00) and under “normal” conditions (24:00) are shown in Fig.8. It can be seen that with high [NO2] the rate of O3+NO2 was about 6 times faster than with low [NO2]. This caused an increment in [NO3] and the rapid consumption of ozone. With higher NO3concentration the rates of the reactions with DMS and NO (to regenerate NO2) increased by a factor of 8 and 3, respectively. The
25
consequence was a decrease in ozone by about 30% and of NO by almost a factor of 4, which is clearly visible in the measurements (Fig.7). With less O3and NO present, the
ACPD
6, 7715–7745, 2006 Night-time radical chemistry during NAMBLEX R. Sommariva et al. Title Page Abstract Introduction Conclusions References Tables Figures J I J I Back CloseFull Screen / Esc
Printer-friendly Version Interactive Discussion
EGU conversion between HO2and OH slowed down to about half its normal rate. While OH
continued to be produced by the decomposition of the Criegee intermediates (mainly CH3CHOO), the decrease in the propagation rates lead to a decrease in [OH].
The measurements reflected these changes. In correspondence to the NO2 spike the concentration of NO and O3 decreased (Fig. 7) and the concentration of NO3
5
showed a slight increase (Fig.3(c)). The DMS profile showed an initial increase until 22:30, which was then followed by a fast decline until midnight, due to the reaction with NO3(Fig.7).
7 Conclusions
Night-time measurements of radicals were made during a field campaign (NAMBLEX)
10
in a marine environment in the Northern Hemisphere. OH was always below the de-tection limit (6×10⁴molecule cm−3), but HO2concentrations of 1–3×10⁷molecule cm−3 were measured during one night (31 August–1 September). HO2+RO2 and NO3were measured on several nights. On the night of 31 August–1 September simultaneous measurements of HO2, HO2+RO2and NO3were available, together with many other
15
supporting measurements, allowing a thorough study of night-time chemistry. The radicals concentrations were calculated using a set of zero-dimensional box-models, based on the Master Chemical Mechanism and constrained to measured species and parameters.
The agreement between the model and the measurements was reasonably good for
20
HO2, with a tendency to overestimate the measurements by less than 40%. The agree-ment with HO2+RO2 was more variable, but within 15–30% during most of the nights. A model containing only CO and CH4chemistry always underestimated both [HO2] and [HO2+RO2] by about an order of magnitude, showing that most of the peroxy radicals generated during the night derived from the oxidation of NMHCs. The most important
25
peroxy radicals were HO2(20% on unpolluted nights and 40% on semi-polluted nights) and CH3O2(60% on unpolluted nights and 40% on semi-polluted nights).
ACPD
6, 7715–7745, 2006 Night-time radical chemistry during NAMBLEX R. Sommariva et al. Title Page Abstract Introduction Conclusions References Tables Figures J I J I Back CloseFull Screen / Esc
Printer-friendly Version Interactive Discussion
EGU The measurements indicated that the radical concentrations remained more or less
constant throughout the night, suggesting a nocturnal radical source. The model showed that reaction of O3with alkenes (mainly propene, butenes and pentenes) was a slow but steady source of OH during the night which compensated the slow removal of radicals via the formation of peroxides from peroxy-peroxy reactions.
5
The model consistently underestimated [NO3] measured by DOAS by a factor of 5–10 or more. The agreement with the CRDS measurements during NAMBLEX was much better, within 30–50%. Scavenging of NO3 by NO over land was explored as one of the possible explanations for the discrepancy between the two instruments and with the model. Reaction with NO was the main loss process for NO3during the night
10
31 August–1 September, followed by the reaction with DMS. When the model was run with [NO]=0, NO3mainly reacted with DMS resulting in an increase in modelled NO3 of about 50%. With [DMS]=0, modelled NO3increased by about 70–80% and the main losses for the nitrate radical became the reactions with a variety of alkenes, aromatics and peroxy radicals or the uptake on aerosol. The only source of NO3was the reaction
15
of NO2with O3.
On 31 August–1 September a spike of NO2of up to 300 ppt allowed an examination of the coupling between NO3and HOx. The increase in NO2 caused an acceleration of the reaction with O3, increasing the production of NO3 (and hence the rates of its reactions with DMS and NO) and depleting O3. The decrease in NO and O3caused a
20
slowing of the HO2→OH conversion rate.
Acknowledgements. We gratefully acknowledge the support and the help of the Mace Head
Atmospheric Research Station during the NAMBLEX campaign, particularly G. Spain. Thanks to G. P. Johnson for technical assistance with the operation of the FAGE instrument during the
campaign. We also would like to thank G. Mills for help with the NOx dataset, J. Methven for
25
providing the back trajectories and the Universities of Leeds, Leicester, East Anglia, Manch-ester and York for the use of their data. R. Sommariva acknowledges the University of Leeds for a scholarship. D. E. Heard would like to thank the Royal Society for a University Research Fellowship and some equipment funding.
ACPD
6, 7715–7745, 2006 Night-time radical chemistry during NAMBLEX R. Sommariva et al. Title Page Abstract Introduction Conclusions References Tables Figures J I J I Back CloseFull Screen / Esc
Printer-friendly Version Interactive Discussion
EGU
References
Allan, B. J., Carslaw, N., Coe, H., Burgess, R. A., and Plane, J. M. C.: Observations of the
nitrate radical in the marine boundary layer, J. Atmos. Chem., 33, 129–154, 1999. 7717,
7720,7725
Allan, B. J., McFiggans, G., Plane, J. M. C., Coe, H., and McFadyen, G. G.: The nitrate radical
5
in the remote marine boundary layer, J. Geophys. Res., 105, 24 191–24 204, 2000. 7717,
7725
Atkinson, R. and Arey, J.: Atmospheric degradation of volatile organic compounds, Chem. Rev.,
103, 4605–4638, 2003. 7717
Atkinson, R., Baulch, D. L., Cox, R. A., Crowley, J. N., Jr., R. F. H., Kerr, J. A., M. J, R., and
10
Troe, J.: Summary of evaluated kinetic and photochemical data for atmospheric chemistry, Tech. rep., IUPAC Subcommittee on Gas Kinetic Data Evaluation for Atmospheric Chemistry,
http://www.iupac-kinetic.ch.cam.ac.uk, 2003. 7717,7723
Behnke, W., George, C., Scheer, V., and Zetzsch, C.: Production and decay of ClNO2from the
reaction of gaseous N2O5 with NaCl solution: bulk and aerosol experiments, J. Geophys.
15
Res., 102, 3795–3804, 1997. 7720
Berresheim, H., Elste, T., Tremmel, H. G., Allen, A. G., Hansson, H.-C., Rosman, K., Maso,
M. D., M ¨akel ¨a, J. M., and Kulmala, M.: Gas-aerosol relationship of H2SO4, MSA, and OH:
observations in the coastal marine boundary layer at Mace Head, Ireland, J. Geophys. Res.,
107(D19), 8100, doi:10.1029/2000JD000229, 2002. 7719
20
Bitter, M., Ball, S. M., Povey, I. M., and Jones, R. L.: A broadband cavity ringdown spectrometer for in-situ measurements of atmospheric trace gases, Atmos. Chem. Phys., 5, 2547–2560,
2005. 7721
Brasseur, G. P., Hauglustaine, D. A., Walters, S., Rasch, P. J., Muller, J. F., Granier, C., and Tie, X. X.: MOZART, a global chemical transport model for ozone and related chemical tracers –
25
1. Model description, J. Geophys. Res., 103, 28 265–28 289, 1998. 7720
Brown, S. S., Stark, H., Ryerson, T. B., Williams, E. J., Nicks, D. K., Trainer, M., Fehsenfeld, F. C., and Ravishankara, A. R.: Nitrogen oxides in the nocturnal boundary layer:
simulta-neous in situ measurements of NO3, N2O5, NO2, NO and O3, J. Geophys. Res., 108(D9),
4299, doi:10.1029/2002JD002917, 2003. 7717
30
Brown, S. S., Dibb, J. E., Stark, H., Aldener, M., Vozella, M., Whitlow, S., Williams, E. J., Lerner, B. M., Jakoubek, R., Middlebrook, A. M., DeGouw, J. A., Warneke, C., Goldan, P. D., Kuster,
ACPD
6, 7715–7745, 2006 Night-time radical chemistry during NAMBLEX R. Sommariva et al. Title Page Abstract Introduction Conclusions References Tables Figures J I J I Back CloseFull Screen / Esc
Printer-friendly Version Interactive Discussion
EGU
W. C., Angevine, W. M., Sueper, D. T., Quinn, P. K., Bates, T. S., Meagher, J. F., Fehsenfeld,
F. C., and Ravishankara, A. R.: Nighttime removal of NOx in the summer marine boundary
layer, Geophys. Res. Lett., 31, 2004. 7717
Carslaw, N., Carpenter, L. J., Plane, J. M. C., Allan, B. J., Burgess, R. A., Clemitshaw, K. C., Coe, H., and Penkett, S. A.: Simultaneous observations of nitrate and peroxy radicals in the
5
marine boundary layer, J. Geophys. Res., 102, 18 917–18 933, 1997. 7718
Carslaw, N., Creasey, D. J., Heard, D. E., Lewis, A. C., McQuaid, J. B., Pilling, M. J., Monks,
P. S., Bandy, B. J., and Penkett, S. A.: Modeling OH, HO2, and RO2 radicals in the
ma-rine boundary layer – 1. Model construction and comparison with field measurements, J.
Geophys. Res., 104, 30 241–30 255, 1999. 7719
10
Derwent, R. G., Jenkin, M. E., and Saunders, S. M.: Photochemical ozone creation potentials for a large number of reactive hydrocarbons under European conditions, Atmos. Environ.,
30, 181–199, 1996. 7720
Fleming, Z. L., Monks, P. S., Rickard, A. R., Heard, D. E., Bloss, W. J., Seakins, P. W., Still, T. J., Sommariva, R., Pilling, M. J., Morgan, R., Green, T. J., Brough, N., Mills, G. P., Penkett,
15
S. A., Lewis, A. C., Lee, J. D., Saiz-Lopez, A., and Plane, J. M. C.: Peroxy radical chemistry and the control of ozone photochemistry at Mace Head, Ireland during the summer of 2002,
Atmos. Chem. Phys., 6, 2193–2214, 2006 . 7718,7721,7722,7723,7728
Gratpanche, F., Ivanov, A., Devolder, P., Gershenzon, Y., and Sawerysyn, J.-P.: Uptake coe
ffi-cients of OH and HO2radicals on material surfaces of atmospheric interest, in 14th
Interna-20
tional Symposium on Gas Kinetics, Leeds, 1996. 7720
Heard, D. E., Read, K. A., Al-Haider, S., Bloss, W. J., Johnson, G. P., Pilling, M. J., Rickard, A., Seakins, P. W., Smith, S. C., Sommariva, R., Stanton, J. C., Still, T., Brooks, B., Jackson, A. V., McQuaid, J. B., Morgan, R., Smith, M. H., Carpenter, L. J., Carslaw, N., Hamilton, J., Hopkins, J. R., Lee, J. D., Lewis, A. C., Purvis, R. M., Wevill, D. J., Brough, N., Green, T.,
25
Mills, G., Penkett, S., Plane, J. M. C., Saiz-Lopez, A., Worton, D., Monks, P. S., Fleming, Z., Alfarra, M., Allan, J. D., Bower, K., Coe, H., Cubison, M., Flynn, M., McFiggans, G., Gallagher, M., Norton, E. G., Shillito, J., Topping, D., Vaughan, G., Williams, P., Bitter, M., Ball, S. M., Jones, R. L., Povey, I. M., ODoherty, S., Noone, C., Simmonds, P. G., Allen, A., Kinnersley, R., Beddows, D., DallOsto, M., Harrison, R. M., Donovan, R., Heal, M., Methven,
30
J., Jennings, G., , and Spain, G.: The North Atlantic Marine Boundary Layer Experiment (NAMBLEX). Overview of the campaign held at Mace Head, Ireland in summer 2002, Atmos.
ACPD
6, 7715–7745, 2006 Night-time radical chemistry during NAMBLEX R. Sommariva et al. Title Page Abstract Introduction Conclusions References Tables Figures J I J I Back CloseFull Screen / Esc
Printer-friendly Version Interactive Discussion
EGU
Kanaya, Y., Sadanaga, Y., Matsumoto, J., Sharma, U. K., Hirokawa, J., Kajii, Y., and Akimoto,
H.: Nighttime observation of the HO2radical by an LIF instrument at Oki Island, Japan, and
its possible origins, Geophys. Res. Lett., 26, 2179–2182, 1999. 7718
Kanaya, Y., Matsumoto, J., Kato, S., and Akimoto, H.: Behavior of OH and HO2radicals during
the observations at a remote island of Okinawa (ORION99) field campaign – 2. Comparison
5
between observations and calculations, J. Geophys. Res., 106, 24 209–24 223, 2001. 7718
Kanaya, Y., Nakamura, K., Kato, S., Matsumoto, J., Tanimoto, H., and Akimoto, H.: Nighttime
variations in HO2 radical mixing ratios at Rishiri Island with elevated monoterpene mixing
ratios, Atmos. Environ., 36, 4929–4940, 2002. 7718
Lewis, A. C., Hopkins, J. R., Carpenter, L. J., Stanton, J., Read, K. A., and Pilling, M. J.: Sources
10
and sinks of acetone, methanol, and acetaldehyde in North Atlantic air, Atmos. Chem. Phys.,
5, 1963–1974, 2005. 7719
Monks, P. S., Carpenter, L. J., Penkett, S. A., and Ayers, G. P.: Night-time peroxy radical chemistry in the remote marine boundary layer over the Southern Ocean, Geophys. Res.
Lett., 23, 535–538, 1996. 7718
15
Morgan, R. B. and Jackson, A. V.: Measurements of gas-phase hydrogen peroxide and methyl hydroperoxide in the coastal environment during the PARFORCE project, J. Geophys. Res.,
107(D19), 8109, doi:10.1029/2000JD000257, 2002. 7719
Norton, E. G., Vaughan, G., Methven, J., Coe, H., Brooks, B., Gallagher, M., and Longley, I.: Boundary layer structure and decoupling from synoptic scale flow during NAMBLEX, Atmos.
20
Chem. Phys., 6, 433–445, 2006. 7720,7721,7722
Purvis, R. M., McQuaid, J. B., Lewis, A. C., Hopkins, J. R., and Simmonds, P.: Horizontal and vertical profiles of ozone, carbon monoxide, non-methane hydrocarbons and dimethyl sulphide near the Mace Head observatory, Ireland, Atmos. Chem. Phys. Discuss., 5, 12 505–
12 530, 2005. 7727
25
Regina, K., Nykanen, H., Maljanen, M., Silvola, J., and Martikainen, P. J.: Emissions of N2O
and NO and net nitrogen mineralization in a boreal forested peatland treated with different
nitrogen compounds, Canadian J. Forest Res., 28, 132–140, 1998. 7726
Saiz-Lopez, A., Shillito, J. A., Coe, H., and Plane, J. M. C.: Measurements and modelling of
I2, IO, OIO, BrO and NO3in the mid-latitude marine boundary layer, Atmos. Chem. Phys., 6,
30
1513–1528, 2006 . 7718,7721,7724,7726
Salisbury, G., Rickard, A. R., Monks, P. S., Allan, B. J., Bauguitte, S., Penkett, S. A., Carslaw, N., Lewis, A. C., Creasey, D. J., Heard, D. E., Jacobs, P. J., and Lee, J. D.: Production of
ACPD
6, 7715–7745, 2006 Night-time radical chemistry during NAMBLEX R. Sommariva et al. Title Page Abstract Introduction Conclusions References Tables Figures J I J I Back CloseFull Screen / Esc
Printer-friendly Version Interactive Discussion
EGU
peroxy radicals at night via reactions of ozone and the nitrate radical in the marine boundary
layer, J. Geophys. Res., 106, 12 669–12 687, 2001. 7718,7722,7723
Smith, S. C., Lee, J. D., Bloss, W. J., Johnson, G. P., Ingham, T., and Heard, D. E.:
Concentra-tions of OH and HO2radicals during NAMBLEX: measurements and steady-state analysis,
Atmos. Chem. Phys., 6, 1435–1453, 2006. 7718,7721,7722
5
Sommariva, R., Haggerstone, A.-L., Carpenter, L. J., Carslaw, N., Creasey, D. J., Heard, D. E.,
Lee, J. D., Lewis, A. C., Pilling, M. J., and Z ´ador, J.: OH and HO2chemistry in clean marine
air during SOAPEX-2, Atmos. Chem. Phys., 4, 839–856, 2004. 7719, 7722, 7723, 7724,
7725,7739
Sommariva, R., Bloss, W. J., Brough, N., Carslaw, N., Flynn, M., Haggerstone, A.-L., Heard,
10
D. E., Hopkins, J. R., Lee, J. D., Lewis, A. C., McFiggans, G., Monks, P. S., Penkett, S. A., Pilling, M. J., Plane, J. M. C., Read, K. A., Saiz-Lopez, A., Rickard, A. R., and Williams,
P. I.: OH and HO2 chemistry during NAMBLEX: roles of oxygenates, halogen oxides and
heterogeneous uptake, Atmos. Chem. Phys., 6, 1135–1153, 2006. 7718,7719,7722
Still, T. J., Al-Haider, S., Seakins, P. W., Sommariva, R., Stanton, J. C., Mills, G., and Penkett,
15
S. A.: Ambient formaldehyde measurements made at a remote marine boundary layer site during the NAMBLEX campaign – a comparison of data from chromatographic and modified
Hantzsch techniques, Atmos. Chem. Phys. Discuss., 5, 12 531–12 567, 2005. 7719
Vrekoussis, M., Kanakidou, M., Mihalopoulos, N., Crutzen, P. J., Lelieveld, J., Berresheim, D.
P. H., and Baboukas, E.: Role of the NO3 radicals in oxidation processes in the eastern
20
Mediterranean troposphere during the MINOS campaign, Atmos. Chem. Phys., 4, 169–182,
2004. 7717
Williams, E. J. and Fehsenfeld, F. C.: Measurements of soil nitrogen oxide emissions at three
North American sites, J. Geophys. Res., 96, 1033–1042, 1991. 7726
Williams, E. J., Guenther, A., and Fehsenfeld, F. C.: An inventory of nitric oxide emissions from
25
ACPD
6, 7715–7745, 2006 Night-time radical chemistry during NAMBLEX R. Sommariva et al. Title Page Abstract Introduction Conclusions References Tables Figures J I J I Back CloseFull Screen / Esc
Printer-friendly Version Interactive Discussion
EGU
Table 1. Models used in this work.
Base Models Constraints
“clean” H2, O3, NO, NO2, HCHO and H2O, temperature,
photolysis rates. CO, CH4
“full” as “clean”+ 22 hydrocarbons, DMS, CHCl3
“fulloxy” as “full”+ 3 oxygenates
“fulloxyper” as “fulloxy”+ 2 peroxides
Test Models Constraints
“fulloxy-n2o5” as “fulloxy” with γN2O5 = 0.016
“fulloxy-no” as “fulloxy” with [NO]= 0
“fulloxy-dms” as “fulloxy” with [DMS]= 0
ACPD
6, 7715–7745, 2006 Night-time radical chemistry during NAMBLEX R. Sommariva et al. Title Page Abstract Introduction Conclusions References Tables Figures J I J I Back CloseFull Screen / Esc
Printer-friendly Version Interactive Discussion
EGU
Table 2. Average (20:00–05:00) measurements on some selected nights during NAMBLEX.
Concentrations in molecule cm−3, temperature in◦C.
Measurements 1–2 Aug 18–19 Aug 19–20 Aug 20–21 Aug 31 Aug–
1 Sep O3 7.8×10¹¹ 7.0×10¹¹ 6.1×10¹¹ 5.8×10¹¹ 8.8×10¹¹ NO 3.2×10⁸ 1.5×10⁸ 2.0×10⁸ 1.3×10⁸ 9.2×10⁷ NO2 7.1×10⁹ 1.8×10⁹ 3.2×10⁹ 6.1×10⁹ 1.6×10⁹ CH4 5.0×10¹³ 4.7×10¹³ 4.8×10¹³ 4.7×10¹³ 4.6×10¹³ CO 4.0×10¹² 2.2×10¹² 2.0×10¹² 2.0×10¹² 3.0×10¹² H2 1.4×10¹³ 1.3×10¹³ 1.3×10¹³ 1.3×10¹³ 1.3×10¹³ HCHO (UEA) 1.7×10¹⁰ 3.1×10⁹ 3.5×10⁹ 5.6×10⁹ – HCHO (Leeds) 3.9×10¹⁰ 1.5×10¹⁰ 1.4×10¹⁰ 1.8×10¹⁰ – Propene 6.0×10⁸ 3.6×10⁸ 5.3×10⁸ 5.8×10⁸ 2.5×10⁸ DMS 6.4×10⁸ 2.6×10⁹ 1.0×10⁹ 1.1×10⁹ 1.1×10⁹ Acetylene 7.2×10⁹ 1.5×10⁹ 1.9×10⁹ 1.5×10⁹ 3.5×10⁹ Acetaldehyde 2.3×10¹⁰ 1.2×10¹⁰ 1.1×10¹⁰ 9.9×10⁹ 6.5×10⁹ Temperature 17.5 13.8 12.8 14.3 14.1
ACPD
6, 7715–7745, 2006 Night-time radical chemistry during NAMBLEX R. Sommariva et al. Title Page Abstract Introduction Conclusions References Tables Figures J I J I Back CloseFull Screen / Esc
Printer-friendly Version Interactive Discussion EGU 0.0E+00 1.0E+07 2.0E+07 3.0E+07 4.0E+07 5.0E+07 6.0E+07 7.0E+07 20:00 22:00 0:00 2:00 4:00 6:00 Time (GMT) [HO 2 ] / m o lecule cm -3 HO2 [clean] HO2 [full] HO2 [fulloxy] HO2 measured 0.0E+00 1.0E+06 2.0E+06 18:00 22:00 2:00 6:00 [OH] / m o lecule cm -3 OH [clean] OH [full] OH [fulloxy] OH measured (a) 0.0E+00 5.0E+07 1.0E+08 1.5E+08 2.0E+08 2.5E+08 20:00 22:00 0:00 2:00 4:00 6:00 Time (GMT) [HO 2 +R O2 ] / m olecule cm -3 HO2+RO2 [clean] HO2+RO2 [full] HO2+RO2 [fulloxy] PERCA measured (b)
Fig. 1. Model-measurement comparison for OH, HO2(a) and HO2+RO2 (b) during the night
ACPD
6, 7715–7745, 2006 Night-time radical chemistry during NAMBLEX R. Sommariva et al. Title Page Abstract Introduction Conclusions References Tables Figures J I J I Back CloseFull Screen / Esc
Printer-friendly Version Interactive Discussion EGU 0.0E+00 2.5E+08 5.0E+08 7.5E+08 1.0E+09
15-Aug 16-Aug 17-Aug 18-Aug 19-Aug 20-Aug 21-Aug 22-Aug Time (GMT) [HO 2 +R O2 ] / m olecule cm -3
HO2+RO2 [clean] HO2+RO2 [full] HO2+RO2 [fulloxy] HO2+RO2 [fulloxyper] PERCA (a) 0.0E+00 2.5E+07 5.0E+07 7.5E+07 1.0E+08 1.3E+08 1.5E+08 1.8E+08 2.0E+08 18:00 20:00 22:00 0:00 2:00 4:00 6:00 Time (GMT) [HO 2 ], [HO 2 +R O2 ] / m o lecules cm -3 HO2 modelled RO2 modelled PERCA modelled HO2 measured PERCA measured 0.0E+00 2.5E+07 5.0E+07 7.5E+07 1.0E+08 0:00 6:00 12:00 18:00 0:00 [NO 3 ] / m o lecule cm -3 NO3 modelled
NO3 measured (DOAS)
(b)
Fig. 2. Model-measurement comparison for HO2and HO2+RO2 during the period 15–21
Au-gust of NAMBLEX(a). Model-measurement comparison for NO3, HO2and HO2+RO2 during
the night 15–16 February 1999 of SOAPEX-2(b). The equivalent of the “clean” model was
ACPD
6, 7715–7745, 2006 Night-time radical chemistry during NAMBLEX R. Sommariva et al. Title Page Abstract Introduction Conclusions References Tables Figures J I J I Back CloseFull Screen / Esc
Printer-friendly Version Interactive Discussion EGU 0.0E+00 1.0E+08 2.0E+08 3.0E+08 4.0E+08 20:00 22:00 0:00 2:00 4:00 6:00 Time (GMT) [NO 3 +N 2 O5 ] / m o lecule cm -3 NO3+N2O5 [clean] NO3+N2O5 [full] NO3+N2O5 [fulloxy] NO3+N2O5 [fulloxyper] NO3+N2O5 [fulloxy-n2o5] NO3+N2O5 measured (CRDS) (a) 0.0E+00 1.0E+08 2.0E+08 3.0E+08 4.0E+08 5.0E+08
18-Aug 19-Aug 20-Aug 21-Aug 22-Aug Time (GMT) [NO 3 ] / mole cule cm -3 NO3 [clean] NO3 [full] NO3 [fulloxy] NO3 [fulloxyper] NO3 measured (DOAS)
(b) 0.0E+00 1.0E+08 2.0E+08 3.0E+08 4.0E+08 20:00 22:00 0:00 2:00 4:00 6:00 Time (GMT) [NO 3 ] / m o lecule cm -3 NO3 [clean] NO3 [full] NO3 [fulloxy] NO3 measured (DOAS)
(c)
Fig. 3. Model-measurement for NO3+N2O5, also showing the impact of N2O5 uptake, during
the night 1–2 August(a) and for NO3 during the period 18-22 August (b) and the night 31
ACPD
6, 7715–7745, 2006 Night-time radical chemistry during NAMBLEX R. Sommariva et al. Title Page Abstract Introduction Conclusions References Tables Figures J I J I Back CloseFull Screen / Esc
Printer-friendly Version Interactive Discussion EGU 0.0E+00 2.0E+08 4.0E+08 6.0E+08 8.0E+08 20:00 22:00 0:00 2:00 4:00 6:00 Time (GMT) [NO 3 ] / molecule cm -3
NO3 [fulloxy] NO3 [fulloxy-no] NO3 [fulloxy-dms] NO3 [fulloxy-dms-no] NO3 measured (DOAS)
(a) 0.0E+00 1.0E+08 2.0E+08 3.0E+08 4.0E+08 20:00 22:00 0:00 2:00 4:00 6:00 Time (GMT) [NO 3 ] / m o le cu le cm -3
NO3 [fulloxy] NO3 [fulloxy-no] NO3 [fulloxy-dms-no] NO3 measured (DOAS)
(b)
Fig. 4. Model-measurement comparison for NO3showing the impact of [NO]=0 and [DMS]=0
ACPD
6, 7715–7745, 2006 Night-time radical chemistry during NAMBLEX R. Sommariva et al. Title Page Abstract Introduction Conclusions References Tables Figures J I J I Back CloseFull Screen / Esc
Printer-friendly Version Interactive Discussion EGU -1.0E+05 -8.0E+04 -6.0E+04 -4.0E+04 -2.0E+04 0.0E+00 2.0E+04 4.0E+04 6.0E+04 8.0E+04 1.0E+05 20:00 21:00 22:00 23:000:001:002:003:004:005:006:00 Time (GMT) molecule cm -3 s -1 HO2 + O3 -> OH HO2 + NO -> OH + NO2 Criegee decomposition -> OH + products OH + NO2 -> HNO3 OH + NMHCs -> products OH + oxygenates -> products OH + HCHO -> HO2 + CO OH + O3, H2 -> 2 HO2 OH + CH4 -> CH3O2 OH + CO -> HO2 (a) -1.0E+05 -8.0E+04 -6.0E+04 -4.0E+04 -2.0E+04 0.0E+00 2.0E+04 4.0E+04 6.0E+04 8.0E+04 1.0E+05 20:00 21:00 22:00 23:000:001:002:003:004:005:006:00 Time (GMT) molecule cm -3 s -1 OH + CO -> HO2 CH3O + O2 -> HO2 + HCHO OH + O3, H2 -> 2 HO2 OH + HCHO -> HO2 + CO Criegee decomposition -> HO2 + products HO2NO2 HO2 -> aerosol HO2 + peroxy radicals -> products HO2 + HO2 -> H2O2 HO2 + NO -> OH + NO2 HO2 + O3 -> OH
(b)
Fig. 5. Rates of production and destruction of OH (a) and HO2 (b) during the night of 31
ACPD
6, 7715–7745, 2006 Night-time radical chemistry during NAMBLEX R. Sommariva et al. Title Page Abstract Introduction Conclusions References Tables Figures J I J I Back CloseFull Screen / Esc
Printer-friendly Version Interactive Discussion EGU -2.0E+05 -1.0E+05 0.0E+00 1.0E+05 2.0E+05 3.0E+05 4.0E+05 20:00 21:00 22:00 23:00 0:00 1:00 2:00 3:00 4:00 5:00 6:00 Time (GMT) molecule cm -3 s -1 NO2 + O3 -> NO3 N2O5 NO3 + peroxy radicals -> products NO3 + DMS -> CH3SCH2O2 + HNO3 NO3 + VOCs -> products NO3 + NO -> NO2 + NO2
(a) -6.0E+04 -4.0E+04 -2.0E+04 0.0E+00 2.0E+04 4.0E+04 6.0E+04 8.0E+04 1.0E+05 20:0 0 21:0 0 22:0023:0 0 0:001:002:003:004:005:006:00 Time (GMT) m o le cu le cm -3 s -1 NO2 + O3 -> NO3 N2O5 NO3 + peroxy radicals -> products NO3 + VOCs -> products NO3 + DMS -> CH3SCH2O2 + HNO3
NO3 + NO -> NO2 + NO2
(b)
Fig. 6. Rates of production and destruction of NO3 during the night of 1–2 August (a) and
ACPD
6, 7715–7745, 2006 Night-time radical chemistry during NAMBLEX R. Sommariva et al. Title Page Abstract Introduction Conclusions References Tables Figures J I J I Back CloseFull Screen / Esc
Printer-friendly Version Interactive Discussion EGU 0.0E+00 6.0E+09 1.2E+10 1.8E+10 18:00 20:00 22:00 00:00 02:00 04:00 06:00 08:00 Time (GMT) [N O2 ] / mo le c u le c m -3 0.0E+00 5.0E+08 1.0E+09 1.5E+09 2.0E+09 [N O] / mo le c u le c m -3 NO2 NO 0.0E+00 5.0E+11 1.0E+12 1.5E+12 18:00 20:00 22:00 00:00 02:00 04:00 06:00 08:00 Time (GMT) [O 3 ] / m o le c u le c m -3 0.0E+00 5.0E+08 1.0E+09 1.5E+09 2.0E+09 [D M S ] / m o le c u le c m -3 O3 DMS
ACPD
6, 7715–7745, 2006 Night-time radical chemistry during NAMBLEX R. Sommariva et al. Title Page Abstract Introduction Conclusions References Tables Figures J I J I Back CloseFull Screen / Esc
Printer-friendly Version Interactive Discussion EGU N2O5 DMS NO CH3SCH2O2 CH3O2 CH4 CO NO O3 HO2 OH NO3 NO2 NO3 NO2 NO HO2NO2 O3 ∆ ∆ 11.8 7.5 20.4 units in 103 molecule cm-3 s-1 8.6 85.3 35.5 38.6 +0.6 24.5 13.8 11.9 25.8 36.9 43.5 14.6 -0.2 12.0 4.64 23:00 24:00 O3 + alkenes H2O2, ROOH +12.5 -0.2 19.5 23.0
Fig. 8. Radical fluxes during the night of 31 August–1 September at 23:00 (in the middle of the


![Fig. 4. Model-measurement comparison for NO 3 showing the impact of [NO]=0 and [DMS]=0 during the night 1–2 August (a) and 31 August–1 September (b).](https://thumb-eu.123doks.com/thumbv2/123doknet/14776035.593791/28.918.71.643.199.412/model-measurement-comparison-showing-impact-august-august-september.webp)