ORIGINAL PAPER
SPECT/CT tracer uptake is influenced by tunnel orientation
and position of the femoral and tibial ACL graft insertion site
Michael T. Hirschmann&Dominic Mathis&
Helmut Rasch&Felix Amsler&Niklaus F. Friederich&
Markus P. Arnold
Received: 12 October 2012 / Accepted: 21 October 2012 / Published online: 11 November 2012 # Springer-Verlag Berlin Heidelberg 2012
Abstract
Purpose SPECT/CT is a hybrid imaging modality, which combines a 3D scintigraphy (SPECT) and a conventional computerised tomography (CT). SPECT/CT allows accurate anatomical localisation of metabolic tracer activity. It allows the correlation of surgical factors such as tunnel position and orientation with mechanical alignment, clinical outcome and biological factors. The purpose of this study was to investi-gate whether the SPECT/CT tracer uptake (intensity and distribution) correlates with the stability and laxity of the knee joint and the position and orientation of the tibial and femoral tunnels in patients after anterior cruciate ligament (ACL) reconstruction.
Methods A consecutive series of knees (n066), with symp-toms of pain and/or instability after ACL reconstruction were prospectively evaluated using clinical examination and 99mTc-HDP-SPECT/CT. Clinical laxity testing was performed using the Rolimeter (Ormed, Freiburg, Germany) including Lachman testing (0–2 mm, 3–5 mm, 6–10 mm, >10
mm), anterior drawer test (0–2 mm, 3–5 mm, 6–10 mm, >10
mm), pivot shift test (positive versus negative) and patient-based subjective instability (yes versus no).
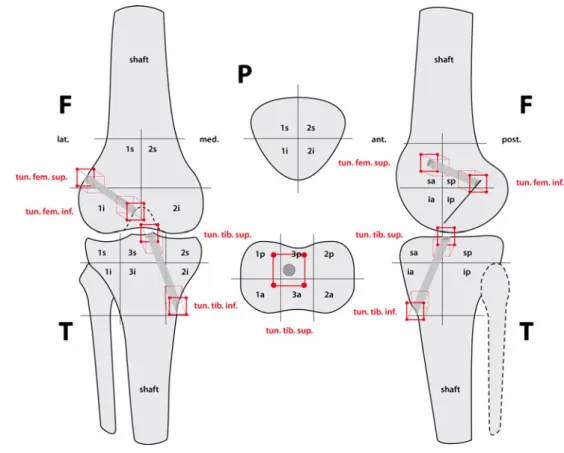
For analysis of SPECT/CT tracer uptake a previously validated SPECT/CT localisation scheme consisting of 17 tibial, nine femoral and four patellar regions on standardised axial, coronal, and sagittal slices was used. The tracer activ-ity on SPECT/CT was localised and recorded using a 3D volumetric and quantitative analysis software.
Mean, standard deviation, minimum and maximum of grading for each area of the localisation scheme were recorded. The position and orientation of the tibial and femoral tunnel was assessed using a previously published method on 3D-CT.
Results Correlation of instability, pivot shift as well as clinical laxity testing with 99mTc-HDP-SPECT/CT trac-er uptake intensity and distribution showed no signifi-cant correlation. 99mTc-HDP-SPECT/CT tracer uptake correlated significantly with the position and orientation of the ACL graft. A more horizontal femoral graft position showed significantly increased tracer uptake within the superior and posterior femoral regions. A more posteriorly-placed femoral insertion site showed significantly more tracer uptake within the femoral and tibial tunnel regions. A more vertical or a less medial tibial tunnel orientation showed significant increased uptake within the tibial and femoral tunnel regions. A more anterior tibial tunnel position showed significantly more tracer uptake in the femoral and tibial tunnel regions as well as the entire tibiofemoral joint.
Conclusions SPECT/CT tracer uptake intensity and dis-tribution showed a significant correlation with the fem-oral and tibial tunnel position and orientation in patients with symptomatic knees after ACL reconstruction. No correlation was found with stability or clinical laxity. Michael T. Hirschmann and Dominic Mathis contributed equally to
this paper.
M. T. Hirschmann (*)
:
D. Mathis:
N. F. Friederich:
M. P. Arnold
Department of Orthopaedic Surgery and Traumatology, Kantonsspital Bruderholz,
4101 Bruderholz, Switzerland
e-mail: Michael.Hirschmann@unibas.ch H. Rasch
Institute of Radiology and Nuclear Medicine, Kantonsspital Bruderholz,
4101 Bruderholz, Switzerland F. Amsler
Amsler Consulting, Basel, Switzerland
SPECT/CT tracer uptake distribution has the potential to give us important information on joint homeostasis and remodelling after ACL reconstruction. It might help to predict ACL graft failure and improve our surgical ACL reconstruction technique in finding the optimal tunnel and graft position and orientation.
Introduction
For a variety of reasons a considerable number of patients are not satisfied or experience pain after
ante-rior cruciate ligament (ACL) reconstruction [1–5].
Typ-ical reasons include failure of the ACL graft, failure of graft fixation, chronic synovitis due to biodegradable fixation material and missed concomitant injuries
[3–6].
Numerous authors have highlighted the clinical val-ue of 3D-CT for the assessment of tunnel position after
ACL reconstruction [7–12]. Thus, 3D reconstructed CT
images are increasingly used to investigate the femoral and tibial tunnel position after ACL reconstruction
[7–9, 11, 12].
SPECT/CT is a hybrid imaging modality, which com-bines a 3D scintigraphy (SPECT) and a conventional
computerised tomography (CT) [13]. SPECT/CT allows
accurate anatomical localisation of metabolic tracer
ac-tivity [9]. Recently, we have introduced a novel
diag-nostic SPECT/CT algorithm for the challenging group of
patients with problems after ACL reconstruction [6, 9,
14, 15]. This standardised algorithm including grading
and anatomical localization of SPECT/CT tracer uptake promises the identification of specific pathological tracer
uptake patterns and distributions [9]. It now allows the
correlation of surgical factors such as tunnel position and orientation with mechanical alignment, clinical
out-come and biological factors [9, 16]. It also promises the
critical assessment of the osseointegration of the bone-graft-fixation complex.
The intensity and distribution of 99mTc-HDP-SPECT/ CT tracer, which as diphosphonate is targeted towards osteoblastic activity, is influenced by mechanical or anatomical alignment, vascular supply, infection,
osteo-blastic activity or currently unknown other factors [9,
13, 14, 16–19]. In patients after ACL reconstruction it
could be hypothesized if the position and orientation of the bone tunnels and the stability and/or laxity of the knee joint are decisive factors.
The purpose of this study was to investigate whether the SPECT/CT tracer uptake (intensity and distribution) correlates with the stability and laxity of the knee joint and the position and orientation of the tibial and femo-ral tunnels in patients after ACL reconstruction.
Material and methods
A consecutive series of knees (n066, mean age±SD 28±11 years, m:f044:22), with symptoms of pain and/or instability after ACL reconstruction were prospectively collected and evaluated. The study was approved by the local ethical committee. The mean±standard deviation (SD) time from surgery was 7±6 years.
The following grafts were used in the previous ACL reconstruction: semitendinosus and/or gracilis tendon (n 025), patellar tendon (n 035), quadriceps tendon (n05), and iliotibial tract (n01).
For femoral fixation of the graft a post screw was used in 21 patients, an interference screw in 17 patients, press-fit technique in six patients, endo-button type fixation in 12 patients and others in ten knees. For tibial fixation of the graft a post screw was used in 36 patients, an interference screw in 24 patients, a tibial button in three patients and a staple fixation in three patients.
A detailed clinical examination was performed by an experienced senior orthopaedic surgeon specialised in re-constructive knee surgery. Conventional weightbearing radiographs (anterior-posterior, lateral, patellar skyline view) were performed in each case. In addition, all patients received a commercial 700 MBq, Tc-99m HDP injection (Malinckrodt, Wallerau, Switzerland). 99mTc-HDP-SPECT/ CT was performed using a Symbia T16 (Siemens, Erlangen, Germany), which is a system that consists of a pair of low energy, high-resolution collimators, a dual-head gamma camera and an integrated 16-slice CT scanner (collimation of 16x0.75-mm). CT scans of the femoral head (3-mm slices), the knee (0.75-mm slices) and the ankle (3-mm slices) were performed according to the Imperial Knee
Protocol [20].
SPECT/CT was performed in the delayed phase three to four hours after tracer injection (matrix size 128 x 128, angle step 32, and time per frame 25 s). Demographic data of all patients were noted including gender, age, date of initial ACL reconstruction, time between surgery and SPECT/CT, type of ACL reconstruction, graft type and tibial and femo-ral fixation technique.
Clinical stability testing was performed using the Rolim-eter (Ormed, Freiburg, Germany) including Lachman testing (0–2 mm, 3–5 mm, 6–10 mm, >10 mm), anterior drawer test (0–2 mm, 3–5 mm, 6–10 mm, >10 mm), pivot shift test (positive versus negative) and patient-based subjective in-stability (yes versus no).
The tracer activity on SPECT/CT was analysed using a specialised software allowing 3D volumetric quantitative
analysis of SPECT data as previously published [21]. A
previously published localisation scheme for anatomical localisation of the SPECT/CT tracer activity was used
of maximum tracer activity grading for each area of the localisation scheme were recorded. For analysis the
tracer activity was standardised in relation to the tracer uptake in the mid shaft of the femur. The intra- and Fig. 1 The previously
validated localisation scheme for the Tc-99m HDP tracer ac-tivity in patients after ACL
re-construction (10 lateral, 2 0
medial, 30 central). F femur, T
tibia, P patella, a anterior, p posterior, i inferior, s superior
Fig. 2 Illustration of performed measurements indicating tibial and femoral tunnel orientation and position (1 anatomical femoral axis, 2 transepicondylar axis, 3 anatomical tibial axis, 4 tibial condylar axis, 5 and 6 medial and lateral tibial spines, 7 mid-tibial spine axis, 8 tibial and femoral tunnel exit, 9 and 10 Blumensaat’s line)
inter-observer reliability of the localisation scheme and grading of the tracer activity were excellent to good
[9].
The position and orientation of the tibial and femoral tunnel was assessed using a previously published method
on 3D-CT [9]. Orientation of tibial and femoral tunnels were
assessed in relation to the anatomical knee axis. The femoral tunnel entry position was determined in mm distance on
3D-CT in relation to the Blumensaat’s line (anterior–posterior
and high–low; Fig.2). The tibial tunnel position was
deter-mined in mm distance on 3D-CT in relation to the anterior–
posterior tibial plateau length and distance to the medial
tibial spine (Fig. 2). The tibial and femoral tunnel length
was measured.
Statistical analysis
Data were analysed using SPSS 17.0 (SPSS, Chicago, USA). Beneath descriptive statistics, Pearson's correla-tion of SPECT/CT tracer uptake (intensity and distribu-tion) with the stability and laxity of the knee joint as well as the femoral and tibial tunnel position was per-formed (p<0.05).
Results
Lachman and anterior drawer testing of the patients are
presented in Table1. The pivot shift was positive in 29/66
patients and negative in 35/66 patients. Twenty-nine of 66 patients reported subjective instability. In two patients these values were missing. The standardised maximum intensity of 99mTc-HDP-SPECT/CT tracer uptake in each anatomical knee region (mean, standard deviation, minimum,
maxi-mum) is shown in Table2.
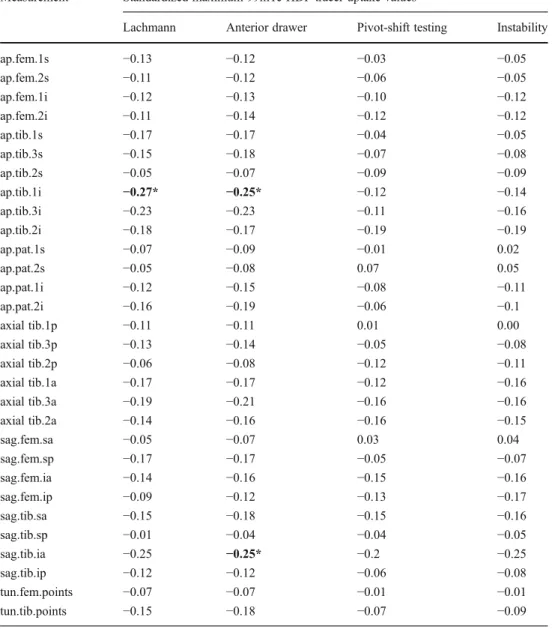
Correlation of instability, pivot shift and clinical laxity testing with 99mTc-HDP-SPECT/CT tracer uptake intensity and distribution showed no significant association of both
(Table3).
The position and orientation of the tibial and femoral tunnel in relation to the anatomical knee axis is presented
in Table 4. Correlation of 99mTc-HDP-SPECT/CT tracer
uptake and position and orientation of the ACL graft and
tunnel length is shown in Tables5and6. A more horizontal
femoral graft position showed significantly increased tracer uptake within the superior and posterior femoral regions. A more posteriorly placed femoral insertion site showed sig-nificantly more tracer uptake within the femoral and tibial tunnel regions.
A more vertical or a less medial tibial tunnel orientation showed significantly increased uptake within the tibial and femoral tunnel regions. A more anterior tibial tunnel posi-tion showed significantly more tracer uptake in the femoral and tibial tunnel regions as well as the entire tibiofemoral joint.
Discussion
SPECT/CT is a new and interesting imaging modality which offers the combined assessment of anatomical Table 1 Anterior laxity (Lachman and anterior drawer testing) using
Rolimeter (Ormed, Freiburg, Germany) in 25° and 70° flexion
Test 0–2mm 3–5mm 6–10mm >10mm
Lachman testing 21 (33%) 16 (25%) 22 (34%) 5 (8%)
Anterior drawer 19 (30%) 18 (28%) 21 (33%) 6 (9%)
Table 2 Standardised maximum intensity of 99mTc-HDP-SPECT/CT tracer uptake in each anatomical knee region (mean, standard deviation [SD], minimum, maximum)
Measurement Mean SD Minimum Maximum
ap.fem.1s 2.41 1.05 0.86 6.84 ap.fem.2s 1.95 0.83 0.61 4.96 ap.fem.1i 3.25 2.37 0.66 15.69 ap.fem.2i 3.54 2.50 0.59 11.38 ap.tib.1s 2.62 1.51 0.60 6.76 ap.tib.3s 3.55 2.08 0.64 10.27 ap.tib.2s 3.31 2.75 0.60 16.26 ap.tib.1i 2.40 1.26 0.51 7.51 ap.tib.3i 2.71 1.84 0.54 9.86 ap.tib.2i 2.13 1.31 0.45 6.43 ap.pat.1s 1.76 1.00 0.43 5.51 ap.pat.2s 1.81 1.39 0.38 9.08 ap.pat.1i 1.57 0.95 0.37 5.11 ap.pat.2i 1.64 1.06 0.36 4.82 axial tib.1p 2.48 1.56 0.60 8.04 axial tib.3p 3.23 1.80 0.57 9.32 axial tib.2p 3.08 2.55 0.67 16.26 axial tib.1a 2.03 1.39 0.42 6.76 axial tib.3a 3.18 2.11 0.58 10.27 axial tib.2a 2.85 2.22 0.51 10.14 sag.fem.sa 2.11 0.85 0.74 4.87 sag.fem.sp 2.44 1.08 0.54 6.84 sag.fem.ia 3.79 2.77 0.75 15.69 sag.fem.ip 3.73 2.36 0.86 10.42 sag.tib.sa 3.90 2.71 0.63 13.57 sag.tib.sp 3.87 2.55 0.84 16.26 sag.tib.ia 2.95 1.87 0.51 9.86 sag.tib.ip 2.37 1.27 0.54 6.33 tun.fem.points 2.25 1.22 0.59 8.98 tun.tib.points 3.19 2.05 0.48 9.22
3D-CT assessment of the tunnel placement and orien-tation of the graft with information on joint biology. In particular, information on the loading history of the
joint can be obtained [21].
However, it is currently unclear whether SPECT/CT tracer uptake shows a significant correlation with sta-bility and/or laxity of the knee joint or the position of the femoral or tibial tunnels. The findings of our study will facilitate analysis of SPECT/CT imaging in patients after ACL reconstruction. Only when the influ-ence of mechanical axis, tunnel position, biological factors such as bone remodelling and laxity and stabil-ity of the knee joint on SPECT/CT tracer uptake are identified, will the intensity and distribution of SPECT/ CT tracer uptake be understood. This is the first study
investigating the potential value of SPECT/CT in as-sessment of in-vivo loading history of the knee joint after ACL reconstruction.
The most important findings and implications of this study are threefold.
First, this is the first study investigating the relationship of stability or clinical laxity in combination with the inten-sity and distribution of SPECT tracer uptake. Interestingly, it seems that the stability or laxity of the knee joint is not a contributing factor to the increased SPECT tracer uptake in the group investigated. It has to be further studied to deter-mine whether these findings could also be confirmed in patients with normal ACL function (natural history group). In addition, the time from surgery might have a significant impact on tracer uptake.
Table 3 Correlation of 99mTc-HDP-SPECT/CT tracer uptake and stability and clinical laxity testing
Significant correlations in bold, *p<0.05, **p<0.001
Measurement Standardized maximum 99mTc-HDP tracer uptake values
Lachmann Anterior drawer Pivot-shift testing Instability
ap.fem.1s −0.13 −0.12 −0.03 −0.05 ap.fem.2s −0.11 −0.12 −0.06 −0.05 ap.fem.1i −0.12 −0.13 −0.10 −0.12 ap.fem.2i −0.11 −0.14 −0.12 −0.12 ap.tib.1s −0.17 −0.17 −0.04 −0.05 ap.tib.3s −0.15 −0.18 −0.07 −0.08 ap.tib.2s −0.05 −0.07 −0.09 −0.09 ap.tib.1i −0.27* −0.25* −0.12 −0.14 ap.tib.3i −0.23 −0.23 −0.11 −0.16 ap.tib.2i −0.18 −0.17 −0.19 −0.19 ap.pat.1s −0.07 −0.09 −0.01 0.02 ap.pat.2s −0.05 −0.08 0.07 0.05 ap.pat.1i −0.12 −0.15 −0.08 −0.11 ap.pat.2i −0.16 −0.19 −0.06 −0.1 axial tib.1p −0.11 −0.11 0.01 0.00 axial tib.3p −0.13 −0.14 −0.05 −0.08 axial tib.2p −0.06 −0.08 −0.12 −0.11 axial tib.1a −0.17 −0.17 −0.12 −0.16 axial tib.3a −0.19 −0.21 −0.16 −0.16 axial tib.2a −0.14 −0.16 −0.16 −0.15 sag.fem.sa −0.05 −0.07 0.03 0.04 sag.fem.sp −0.17 −0.17 −0.05 −0.07 sag.fem.ia −0.14 −0.16 −0.15 −0.16 sag.fem.ip −0.09 −0.12 −0.13 −0.17 sag.tib.sa −0.15 −0.18 −0.15 −0.16 sag.tib.sp −0.01 −0.04 −0.04 −0.05 sag.tib.ia −0.25 −0.25* −0.2 −0.25 sag.tib.ip −0.12 −0.12 −0.06 −0.08 tun.fem.points −0.07 −0.07 −0.01 −0.01 tun.tib.points −0.15 −0.18 −0.07 −0.09
In a previous study we have shown that a non-ideal mechanical axis such as varus or valgus aligned knee leads to increased SPECT tracer uptake in the stressed
compart-ment [16]. However, the altered tracer uptake in patients
with leg deformity is caused by mechanical stress, which is not the case in these patients after ACL reconstruction. An increased anterior translation or instability leads to increased anterior shear forces and not inevitably higher joint loading forces. Furthermore, it could be that only if instability or increased anterior laxity persists over a longer time that it leads to detectable changes of SPECT tracer uptake.
Second, SPECT/CT tracer uptake intensity and distribu-tion showed significant correladistribu-tion with the femoral and tibial tunnel position and orientation in patients with prob-lems after ACL reconstruction.
Although controversy exists regarding the effect of graft position and orientation on knee stability after ACL reconstruction it is well accepted that a lower femoral tunnel position in ACL reconstruction leads to a more stable knee in rotation and anterior tibial trans-lation when compared to a high femoral graft placement
[22]. Consequently, higher forces within the ACL graft
were reported [22]. These higher forces could explain
why we found that a more horizontal femoral graft position showed significantly increased tracer uptake within the superior and posterior femoral regions. In particular, the area around the articular femoral tunnel entry and exit showed increased tracer uptake, which is
in line with the findings of others describing high stress
at these insertions points [23]. Smolinski et al. used a
finite element model developed from a CT scan of a cadaveric knee to compute the stress change in the distal femur caused by graft tunnels in ACL
reconstruc-tion [23]. In this study the position and the geometry of the
ACL graft tunnel exits were varied and the change in stress on
the distal femur was computed [23]. They found that the
highest stress was found at the tunnel exits [23]. The position
of the tunnel exit significantly influenced the stress in the distal femur, which they explained by increased condylar
loads [23]. Stress decreased when the distance from the tunnel
exits to the condyle decreased [23]. These findings were
consistent with ours.
In addition to the results of Smolinski et al. we also investigated the tibiofemoral joint as well as the tibia. A more anterior or more vertical tibial tunnel position showed significantly more tracer uptake in the femoral and tibial tunnel regions as well as in the entire tibiofemoral joint. The causes of this are not yet fully determined, but it seems most likely to be related to altered bone remodelling processes. Another reason could be that due to anterior tunnel
place-ment there is an increase in forces within the ACL graft [24].
Limitations
The following limitations have to be considered when inter-preting the study results.
Table 4 Position and orienta-tion of the tibial and femoral tunnel in relation to the anatom-ical knee axis assessed using a previously published method on 3D-CT [9]. The femoral tunnel entry position was determined in mm distance on 3D-CT in rela-tion to the Blumensaat’s line (anterior-posterior and high-low). The tibial tunnel position was determined in mm distance on 3D-CT in relation to the anterior-posterior tibial plateau length and distance to the centre point between medial and lateral tibial spine. The tibial and fem-oral tunnel lengths were measured
Measurement Mean SD Minimum Maximum
Fem-Ang-ap (°) 30.85 13.24 0.81 66.76 Fem-Ang-lat (°) 36.03 14.45 6.70 74.38 Fem-Ang-axial (°) 50.02 19.33 8.52 88.42 FemEntry-antBlum-x −22.94 5.79 −35.14 −9.17 FemEntry-antBlum-y −3.21 2.83 −10.89 3.34 FemEntry-antBlum-z −1.36 7.95 −15.09 12.33 FemEntry-postBlum-x 3.15 5.22 −5.22 19.74 FemEntry-postBlum-y −3.20 2.83 −10.89 3.34 FemEntry-postBlum-z −0.54 9.42 −13.40 15.20 Fem-Tun-Length 33.14 9.02 13.87 52.51 Tib-Ang-ap 16.58 9.89 0.38 44.00 Tib-Ang-lat 27.54 10.28 0.54 48.25 Tib-Ang-axial 59.45 17.94 9.49 87.52 Tib-med-lat 76.47 6.51 61.55 89.56 Tib-ant-post 49.73 4.85 38.61 66.87 Tib-Tun-Length 35.36 7.57 18.26 56.33 Tib-TunCentre-MidEmin.-Length 9.95 4.73 2.70 22.81 ap-TibExit-MidEminentia-x −0.05 2.55 −6.99 7.23 ap-TibExit-MidEminentia-y 5.10 1.87 1.95 9.56 ap-TibExit-MidEminentia-z 7.60 5.28 −3.66 21.66
First, the patients investigated in our study were all patients with symptoms after ACL reconstruction. It could be speculated that the same findings might be found in patients without any problems after ACL reconstruction. In patients with problems after ACL reconstruction the SPECT/CT tracer uptake could be influenced by a variety of factors such as a malposition of the graft, which does not inevitably lead to an altered laxity, but a changed joint kinematics and load-ing. However, in clinical practice SPECT/CT imaging would be used in patients with problems after ACL reconstruction and that is why we chose this study cohort.
Second, the patients investigated here did undergo ACL reconstruction using a variety of different grafts and graft fixation techniques. It is possible that the difference here
influences the correlation of stability and laxity and SPECT/ CT tracer uptake. Further studies should investigate a more homogenous patient cohorts.
Conclusion
SPECT/CT tracer uptake intensity and distribution showed a significant correlation with the femoral and tibial tunnel position and orientation in patients with relevant symptoms after ACL reconstruction. No correlation was found with stability or clinical laxity. SPECT/CT tracer uptake distribu-tion has the potential to provide important informadistribu-tion on joint homeostasis and remodelling after ACL reconstruc-tion. It might help to predict ACL graft failure and improve Table 5 Correlation of standardised maximum 99mTc-HDP-SPECT/CT tracer uptake and femoral position and orientation of the ACL graft as well as femoral tunnel length evaluated on 3D-CT
Measurement Fem-Ang-ap (°) Fem-Ang-lat (°) Fem-Ang-axial (°) FemEntry-antBlum-x FemEntry-antBlum-y FemEntry-antBlum-z FemEntry-postBlum-x FemEntry-postBlum-y FemEntry-postBlum-z Fem-Tun-Length ap.fem.1s 0.26* 0.05 −0.14 0.02 −0.09 0.15 0.11 −0.10 0.11 −0.06 ap.fem.2s 0.34** 0.07 −0.20 0.29* 0.03 0.2 0.34** 0.03 0.09 0.08 ap.fem.1i 0.05 −0.16 −0.17 0.13 −0.15 0.14 0.27* −0.15 0.11 −0.08 ap.fem.2i 0.06 −0.09 −0.14 0.11 −0.04 −0.02 0.13 −0.04 −0.02 −0.15 ap.tib.1s 0.11 −0.09 −0.17 0.11 −0.04 0.20 0.22 −0.04 0.16 0.07 ap.tib.3s 0.04 −0.16 −0.15 0.12 −0.02 0.07 0.11 −0.03 0.04 −0.16 ap.tib.2s 0.26* −0.01 −0.22 0.11 −0.15 −0.04 0.14 −0.15 −0.03 −0.12 ap.tib.1i 0.11 −0.21 −0.29* 0.05 −0.05 0.2 0.17 −0.06 0.11 0.04 ap.tib.3i 0.09 −0.18 −0.22 0.00 −0.03 −0.03 0.01 −0.03 −0.13 −0.15 ap.tib.2i 0.09 −0.02 −0.11 −0.05 −0.03 −0.03 −0.01 −0.04 −0.07 −0.15 ap.pat.1s 0.18 −0.12 −0.20 0.18 −0.10 0.14 0.34** −0.11 0.06 −0.11 ap.pat.2s 0.07 −0.02 −0.04 0.05 −0.03 0.24 0.11 −0.03 0.16 −0.05 ap.pat.1i 0.09 0.01 −0.05 0.14 −0.07 0.04 0.21 −0.08 −0.03 −0.06 ap.pat.2i 0.00 −0.09 −0.05 0.1 −0.05 0.09 0.15 −0.06 0.03 −0.14 axial tib.1p 0.10 −0.10 −0.17 0.15 0.00 0.22 0.25 0.00 0.18 0.09 axial tib.3p −0.02 −0.21 −0.16 0.18 −0.01 0.08 0.18 −0.01 0.05 −0.1 axial tib.2p 0.25 0.06 −0.15 0.06 −0.12 −0.07 0.07 −0.12 −0.04 −0.11 axial tib.1a 0.19 −0.04 −0.19 0.18 −0.05 0.25 0.27* −0.05 0.20 −0.08 axial tib.3a −0.01 −0.12 −0.09 0.17 −0.01 0.02 0.14 −0.01 0.01 −0.17 axial tib.2a 0.16 −0.05 −0.18 0.15 −0.03 0.01 0.15 −0.04 0.02 −0.15 sag.fem.sa 0.10 −0.03 −0.09 0.10 −0.10 0.11 0.19 −0.10 0.03 0.02 sag.fem.sp 0.34** 0.09 −0.17 0.11 −0.03 0.17 0.19 −0.03 0.14 0.00 sag.fem.ia 0.08 −0.12 −0.17 0.11 −0.01 0.07 0.18 −0.02 0.04 −0.17 sag.fem.ip 0.08 −0.02 −0.07 0.02 −0.05 0.04 0.07 −0.06 0.02 −0.16 sag.tib.sa 0.19 −0.02 −0.16 0.09 −0.08 −0.03 0.13 −0.08 −0.04 −0.19 sag.tib.sp 0.24 −0.01 −0.18 0.05 −0.14 −0.03 0.08 −0.14 −0.04 −0.12 sag.tib.ia 0.10 −0.09 −0.17 −0.05 −0.02 0.00 0.02 −0.03 −0.09 −0.14 sag.tib.ip 0.15 0.03 −0.11 0.09 0.05 0.16 0.15 0.04 0.08 −0.02 tun.fem.points 0.02 −0.17 −0.16 0.17 −0.12 0.17 0.29* −0.13 0.11 −0.04 tun.tib.points 0.00 −0.07 −0.06 0.12 0.00 0.03 0.11 −0.01 0.00 −0.16
T able 6 Correlation of 99mT c-HDP-SPECT/CT tracer uptake and tibial position and orientation of the ACL graft and tibial tunnel length evaluated on 3D-CT Measurement T ib-Ang-ap T ib-Ang-lat T ib-Ang-axial T ib-med-lat T ib-ant-post T ib-T un-Length T ib-T unCentre-MidEmin.-Length ap-T ibExit-MidEminentia-x ap-T ibExit-MidEminentia-y ap-T ibExit-MidEminentia-z ap.fem.1s_stand_max − 0.2 0.09 0.18 0.2 0.27* 0.12 0.03 0.1 1 − 0.05 0.1 ap.fem.2s_stand_max − 0.02 0.03 0.02 0.16 0.27* − 0.07 0.19 0.15 − 0.04 0.22 ap.fem.1i_stand_max − 0.22 0.15 0.25* 0.29* 0.32** 0.16 0 0.12 − 0.07 0.06 ap.fem.2i_stand_max − 0.2 − 0.1 1 0.09 0.25* 0.19 − 0.01 0.05 0.1 1 − 0.07 0.1 ap.tib.1s_stand_max − 0.08 0.17 0.15 0.4*** 0.41*** 0.05 0.1 1 − 0.01 0.03 0.14 ap.tib.3s_stand_max − 0.26* 0.12 0.27* 0.24 0.25* 0.1 0.1 1 0.12 − 0.04 0.18 ap.tib.2s_stand_max − 0.04 − 0.07 0 0.28* 0.26* − 0.16 0.19 − 0.01 − 0.03 0.24 ap.tib.1i_stand_max − 0.17 0.1 0.17 0.3* 0.27* 0.1 0.1 − 0.02 0.04 0.13 ap.tib.3i_stand_max − 0.2 0.16 0.26* 0.14 0.2 0.16 0.13 0 − 0.05 0.19 ap.tib.2i_stand_max − 0.1 1 − 0.08 0.08 0.17 0.27* − 0.18 0.15 − 0.09 − 0.03 0.16 ap.pat.1s_stand_max − 0.06 0.08 0.12 0.25* 0.29* 0.15 0.05 0.15 − 0.06 0.13 ap.pat.2s_stand_max − 0.12 0.18 0.21 0.21 0.3* 0.09 0.01 0.12 0.06 0.06 ap.pat.1i_stand_max − 0.22 0.05 0.21 0.16 0.14 0.18 − 0.04 0.08 − 0.1 1 0.03 ap.pat.2i_stand_max − 0.29* 0.1 1 0.31* 0.15 0.17 0.19 − 0.02 0.06 − 0.04 0.05 axial tib.1p_stand_max − 0.06 0.16 0.14 0.36** 0.34** 0.06 0.06 − 0.04 − 0.03 0.1 axial tib.3p_stand_max − 0.24 0.12 0.26* 0.25* 0.24 0.08 0.08 0.09 − 0.03 0.14 axial tib.2p_stand_max 0 − 0.07 − 0.05 0.27* 0.29* − 0.23 0.24 − 0.02 − 0.01 0.28* axial tib.1a_stand_max − 0.2 0.12 0.22 0.27* 0.36** 0.01 0.17 0.13 0.09 0.2 axial tib.3a_stand_max − 0.27* 0.13 0.27* 0.16 0.21 0.09 0.1 1 0.13 − 0.06 0.18 axial tib.2a_stand_max − 0.16 − 0.13 0.06 0.23 0.18 − 0.13 0.16 0.08 − 0.02 0.21 sag.fem.sa_stand_max − 0.1 1 − 0.03 0.06 0.06 0.1 0.1 − 0.16 0.17 − 0.1 − 0.09 sag.fem.sp_stand_max − 0.19 0.07 0.16 0.22 0.27* 0.02 0.18 0.14 − 0.02 0.24 sag.fem.ia_stand_max − 0.22 0.07 0.21 0.31* 0.35** 0.08 0.07 0.1 − 0.07 0.14 sag.fem.ip_stand_max − 0.27* − 0.08 0.15 0.29* 0.28* 0.01 0.06 0.16 − 0.04 0.1 1 sag.tib.sa_stand_max − 0.24 − 0.04 0.16 0.29* 0.3* 0.05 0.13 0.14 − 0.03 0.2 sag.tib.sp_stand_max − 0.1 − 0.07 0.03 0.31* 0.28* − 0.09 0.1 0 − 0.1 0.17 sag.tib.ia_stand_max − 0.27* 0 0.21 0.22 0.29* 0.1 0.09 0.03 − 0.08 0.14 sag.tib.ip_stand_max − 0.15 − 0.12 0.08 0.15 0.14 − 0.08 0.03 − 0.03 − 0.13 0.06 tun.fem.points_stand_max − 0.18 0 0.13 0.08 0.01 0.27* − 0.16 0.13 − 0.16 − 0.09 tun.tib.points_stand_max − 0.29* 0.1 0.27nn 0.15 0.17 0.14 0.05 0.14 − 0.1 0.1 1 Significant correlations in bold, *p <0.05, ** p <0.001
our surgical ACL reconstruction technique in finding the optimal tunnel and graft position and orientation.
Acknowledgments We greatly thank the Deutsche Arthrose Hilfe
e.V, Saarlouis, Germany and the Alwin-Jäger-Foundation, Aschaffenburg, Germany for funding of the study.
References
1. Arnold MP, Friederich NF, Muller W, Hirschmann MT (2012) From open to arthroscopic anatomical ACL-reconstructions: the long way round. A statement paper. Knee Surg Sports Traumatol Arthrosc. May 9 [Epub ahead of print]
2. Gerhard P, Bolt R, Duck K, Mayer R, Friederich NF, Hirschmann MT (2012) Long-term results of arthroscopically assisted anatomical single-bundle anterior cruciate ligament reconstruction using patellar tendon autograft: are there any predictors for the development of osteoarthritis? Knee Surg Sports Traumatol Arthrosc. Apr 10 [Epub ahead of print]
3. Kamath GV, Redfern JC, Greis PE, Burks RT (2011) Revision anterior cruciate ligament reconstruction. Am J Sports Med 39:199–217
4. Trojani C, Sbihi A, Djian P, Potel JF, Hulet C, Jouve F, Bussiere C, Ehkirch FP, Burdin G, Dubrana F, Beaufils P, Franceschi JP, Chassaing V, Colombet P, Neyret P (2011) Causes for failure of ACL reconstruction and influence of meniscectomies after revision.
Knee Surg Sports Traumatol Arthrosc 19:196–201
5. van Eck CF, Kropf EJ, Romanowski JR, Lesniak BP, Tranovich MJ, van Dijk CN, Fu FH (2011) ACL graft re-rupture after double-bundle reconstruction: factors that influence the intra-articular pattern of
injury. Knee Surg Sports Traumatol Arthrosc 19:340–346
6. Hirschmann MT, Adler T, Rasch H, Hugli RW, Friederich NF, Arnold MP (2010) Painful knee joint after ACL reconstruction using biodegradable interference screws- SPECT/CT a valuable diagnostic tool? A case report. Sports Med Arthrosc Rehabil Ther Technol 2:24 7. Basdekis G, Christel P, Anne F (2009) Validation of the position of the femoral tunnels in anatomic double-bundle ACL reconstruction with 3-D CT scan. Knee Surg Sports Traumatol Arthrosc 17:1089–1094 8. Forsythe B, Kopf S, Wong AK, Martins CA, Anderst W, Tashman
S, Fu FH (2010) The location of femoral and tibial tunnels in anatomic double-bundle anterior cruciate ligament reconstruction analyzed by three-dimensional computed tomography models. J
Bone Joint Surg Am 92:1418–1426
9. Hirschmann MT, Mathis D, Afifi FK, Rasch H, Henckel J, Amsler F, Wagner CR, Friederich NF, Arnold MP (2012) Single photon emission computerized tomography and conventional computerized tomography (SPECT/CT) for evaluation of patients after anterior cruciate ligament reconstruction: a novel standardized algorithm combining mechanical and metabolic information. Knee Surg Sports Traumatol Arthrosc. Jun 13 [Epub ahead of print]
10. Kopf S, Forsythe B, Wong AK, Tashman S, Irrgang JJ, Fu FH (2012) Transtibial ACL reconstruction technique fails to position drill tunnels anatomically in vivo 3D CT study. Knee Surg Sports Traumatol Arthrosc 20(11):2200–2207
11. Purnell ML, Larson AI, Clancy W (2008) Anterior cruciate ligament insertions on the tibia and femur and their relationships to critical
bony landmarks using high-resolution volume-rendering computed
tomography. Am J Sports Med 36:2083–2090
12. Sadoghi P, Kropfl A, Jansson V, Muller PE, Pietschmann MF, Fischmeister MF (2011) Impact of tibial and femoral tunnel position on clinical results after anterior cruciate ligament reconstruction. Arthroscopy 27:355–364
13. Hirschmann MT, Iranpour F, Davda K, Rasch H, Hugli R, Friederich NF (2010) Combined single-photon emission computerized tomog-raphy and conventional computerized tomogtomog-raphy (SPECT/CT): clinical value for the knee surgeons? Knee Surg Sports Traumatol
Arthrosc 18:341–345
14. Hirschmann MT, Davda K, Rasch H, Arnold MP, Friederich NF (2011) Clinical value of combined single photon emission com-puterized tomography and conventional computer tomography
(SPECT/CT) in sports medicine. Sports Med Arthrosc 19:174–181
15. Hirschmann MT, Wagner CR, Rasch H, Henckel J (2012) Standardized volumetric 3D-analysis of SPECT/CT imaging in orthopaedics: overcoming the limitations of qualitative 2D analysis. BMC Med Imaging 12:5
16. Hirschmann MT, Schon S, Afifi FK, Amsler F, Rasch H, Friederich NF, Arnold MP (2012) Assessment of loading history of compart-ments in the knee using bone SPECT/CT: A study combining align-ment and 99mTc-HDP tracer uptake/distribution patterns. J Orthop Res. doi:10.1002/jor.22206
17. Hirschmann MT, Davda K, Iranpour F, Rasch H, Friederich NF (2011) Combined single photon emission computerised tomog-raphy and conventional computerised tomogtomog-raphy (SPECT/ CT) in patellofemoral disorders: a clinical review. Int Orthop
35:675–680
18. Hirschmann MT, Iranpour F, Konala P, Kerner A, Rasch H, Cobb JP, Friederich NF (2010) A novel standardized algorithm for evaluating patients with painful total knee arthroplasty using combined single photon emission tomography and conventional computerized tomography. Knee Surg Sports Traumatol Arthrosc
18:939–944
19. Hirschmann MT, Konala P, Iranpour F, Kerner A, Rasch H, Friederich NF (2011) Clinical value of SPECT/CT for evaluation of patients with
painful knees after total knee arthroplasty—a new dimension
of diagnostics? BMC Musculoskelet Disord 12:36
20. Henckel J, Richards R, Lozhkin K, Harris S, Baena FM, Barrett AR, Cobb JP (2006) Very low-dose computed tomography for planning and outcome measurement in knee replacement. The imperial knee protocol. J Bone Joint Surg Br 88:1513–1518 21. Hirschmann MT, Wagner CR, Rasch H, Henckel J (2011)
Standardized volumetric 3D analysis of SPECT/CT imaging in orthopaedics: overcoming the limitations of qualitative 2D analysis. BMC Med Imaging 12:5
22. Loh JC, Fukuda Y, Tsuda E, Steadman RJ, Fu FH, Woo SL (2003) Knee stability and graft function following anterior cruciate ligament
reconstruction: Comparison between 11 o’clock and 10 o’clock
femoral tunnel placement. 2002 Richard O’Connor Award paper.
Arthroscopy 19:297–304
23. Smolinski P, O’Farrell M, Bell K, Gilbertson L, Fu FH (2012)
Effect of ACL reconstruction tunnels on stress in the distal femur. Knee Surg Sports Traumatol Arthrosc. Apr 18 [Epub ahead of print]
24. Markolf KL, Hame S, Hunter DM, Oakes DA, Zoric B, Gause P, Finerman GA (2002) Effects of femoral tunnel placement on knee laxity and forces in an anterior cruciate ligament graft. J Orthop Res 20:1016–1024
![Table 2 Standardised maximum intensity of 99mTc-HDP-SPECT/CT tracer uptake in each anatomical knee region (mean, standard deviation [SD], minimum, maximum)](https://thumb-eu.123doks.com/thumbv2/123doknet/14839896.624472/4.892.75.433.121.200/standardised-maximum-intensity-anatomical-standard-deviation-minimum-maximum.webp)
![Table 4 Position and orienta- orienta-tion of the tibial and femoral tunnel in relation to the anatom-ical knee axis assessed using a previously published method on 3D-CT [9]](https://thumb-eu.123doks.com/thumbv2/123doknet/14839896.624472/6.892.265.819.88.513/position-orienta-orienta-femoral-relation-assessed-previously-published.webp)
