Modulation of BOLD and Arterial Spin Labeling
(ASL-CBF) Response in Patients with
Transient Visual Impairment after Posterior
Circulation Stroke*
Roland Wiest
1, Werner J. Z’Graggen
2, Andrea M. Humm
2, Helge Horn
3, Claus Kiefer
1, 3,
Luca Remonda
1, Gerhard Schroth
1, Andrea Federspiel
3 AbstractBackground and Purpose: Blood oxygenation level-dependent (BOLD) signal and arterial spin labeling cerebral blood flow
(ASL-CBF) changes, as detected by functional magnetic resonance imaging (fMRI) are closely related to neural activity. The aim of this case series study was to investigate modulations of the BOLD and ASL-CBF response in the primary visual cortex after posterior circulation stroke with transient visual impairment.
Methods: BOLD activity, resting CBF and task-related ASL-CBF response have been investigated 24–48 h after onset of
transient visual symptoms in two patients who were treated conservatively, two patients who received thrombolysis after posterior circulation stroke, and five healthy controls with checkerboard stimulation and visual evoked potentials (VEPs).
Results: After normalization of transient visual symptoms the BOLD response and VEPs showed no hemispheric
differ-ences between patients and controls. The relative blood flow in the posterior cerebral arteries and the relative ASL-CBF response to checkerboard stimulation were reduced in three patients, compared to controls. In one patient who received intraarterial thrombolytic therapy, improvement of the relative CBF and ASL-CBF responses was observed, indicating early reperfusion.
Conclusion: In this case series of four patients, different CBF responses to conservative and thrombolytic therapy were
observed, and early reperfusion after intraarterial thrombolysis was detected. Functional imaging, which makes use of the ASL-CBF technique, is feasible to measure early poststroke vascular changes, which are hardly detectable with BOLD-fMRI.
Key Words: Stroke · Arterial spin labeling · fMRI
Clin Neuroradiol 2006;16:228–35 DOI 10.1007/s00062-006-6027-8
Beeinflussung des BOLD und Arterial-Spin-Labeling-(ASL-CBF-)Antwortsignale transienter Ischämie im hinteren Stromgebiet
Zusammenfassung
Hintergrund und Ziel: Lokale Veränderungen der Hirnaktivität sowie Veränderungen des BOLD-(„blood oxygenation
le-vel dependent“-)Signals und des zerebralen Blutflusses stehen über die neurovaskuläre Kopplung in enger Relation. Ziel dieser Fallstudie war es, Einflüsse auf das BOLD-Signal und den zerebralen Blutfluss mittels der ASL-CBF („arterial spin labeling cerebral blood flow“-)Technik bei Schlaganfallpatienten mit Durchblutungsstörungen im hinteren Stromgebiet zu untersuchen.
Methodik: Die BOLD-Aktivität, der Ruheblutfluss und der Anstieg des zerebralen Blutflusses wurden innerhalb von
24–48 h bei zwei Schlaganfallpatienten, die konservativ behandelt wurden, und bei zwei Patienten, die eine intravenöse bzw. intraarterielle Thrombolyse erhielten, gemessen. Alle Patienten wiesen klinisch eine initiale Visusstörung auf, die * This paper was presented at the European Congress of Neuroradiology 2006 and rewarded with the first poster prize.
1 Institute of Diagnostic and Interventional Neuroradiology, University of Bern, Switzerland, 2 Department of Neurology, University of Bern, Switzerland,
3 Department of Psychiatric Neurophysiology, University Hospital of Psychiatry, University of Bern, Switzerland.
Introduction
After minor ischemic stroke, patients often recover with only mild or no persisting neurologic impairment, ac-cording to minor structural alterations in magnetic reso-nance imaging (MRI). By contrast, after reperfusion of ischemic lesions in the brain, subtle impairment of cere-bral blood flow (CBF) may occur due to altered func-tional properties in the microvasculature, despite nor-malization of gross perfusion in the resting state [1]. Physiologically, functional brain mapping by fMRI or positron emission tomography (PET) is based on the tight coupling between regional blood flow and meta-bolic demand in vital tissue. When neurons increase their activity with respect to a baseline, modulation of the desoxyhemoglobin concentration is induced, gener-ating the blood oxygenation level-dependent (BOLD) contrast. The relationship of the neuronal activity, as derived from BOLD imaging and regional cerebral blood flow after stroke, has been shown to be impaired in stroke patients, even if the ischemic regions are not involved into the cortical activation itself [2]. Recent studies have shown changes in neuronal activity corre-lating with impaired cerebrovascular response in stroke patients with fMRI, PET, and Doppler ultrasound [3, 4]. The arterial spin labeling (ASL) technique offers an ad-ditional, noninvasive method for measuring cortical re-sponse to external stimuli [5, 6]. As blood flow is a direct measure of the poststroke vascular arterial system, it should be expected, that subtle changes in the capillary bed affect mainly the arterial, but not the venous level of the microvasculature. Furthermore, due to the short decay time of the tracer (approximately 1 s) a significant tracer accumulation in venous structures is prevented. Therefore, the signal changes in perfusion fMRI are not
observed over veins and the localization of signal chang-es is constricted over activated cortex [7]. We would ex-pect that ASL-CBF is more sensitive in detecting func-tional changes related to stroke than BOLD-fMRI. In order to probe this hypothesis we have (i) chosen the most robust stimulus paradigm, i.e., visual checkerboard stimulation, (ii) selected patients with transient or sub-tle persistent visual disturbances, according to posterior circulation stroke.
Patients and Methods Patients
Four male patients (mean age ± standard deviation [SD]: 64.2 ± 2.2 years) were selected and recruited from the Clinic of Neurology, University of Bern, Switzerland. All patients suffered from acute ischemic stroke in the poste-rior circulation, due to cardiac embolism, with transient visual impairment and early clinical recovery. All four patients were diagnosed with MRI. Diffusion-weighted and T2-weighted images demonstrated ischemic lesions in the posterior circulation, not affecting the primary vi-sual cortex. Variant origin of the posterior cerebral ar-tery has been excluded with time-of-flight angiography. Two further patients had to be excluded from the study due to excessive blood pressure of > 150/90 mmHg at the time of fMRI examination and inappropriate task per-formance. Doppler ultrasound was performed to rule out extracranial stenosis or occlusion. Two patients were treated conservatively with salicylates, two patients un-derwent thrombolysis (one patient received intravenous and one patient intraarterial thrombolysis) with com-plete recanalization. Two patients had clinically normal vision, two patients minor visual deficits detected by pe-rimetry. All patients had normal visual evoked potentials sich im Verlauf wieder zurückbildete. Diese vier Patienten und fünf gesunde Kontrollpersonen wurden mittels beider o.g. fMRT-Methoden mit einem visuellen Stimulationsparadigma und visuell evozierten Potentialen (VEP) untersucht.
Ergebnisse: Nach spontaner Remission der Visusstörung wurde mittels BOLD-fMRI und VEP kein Unterschied zwischen
den Patienten und den Kontrollen gemessen. Ruheblutfluss und prozentualer Anstieg des zerebralen Blutflusses in der ASL-Messung waren im Vergleich zu einem gesunden Kontrollkollektiv bei den konservativ und mittels i.v. Thrombolyse behandelten Patienten erniedrigt. Ein Patient, der mittels intraarterieller Thrombolyse behandelt wurde, zeigte eine Erhö-hung des relativen Blutflusses im Sinne einer frühen Reperfusion.
Schlussfolgerung: In dieser Fallserie von vier Patienten konnten mittels der ASL-CBF-Technik unterschiedliche Einflüsse
auf den zerebralen Ruheblutfluss, jeweils in Abhängigkeit von der zugrunde liegenden Therapie, gemessen werden. Die funktionelle Aktivierungsmessung mittels ASL-CBF erlaubt dabei, Veränderungen zu detektieren, die mittels der BOLD-Technik nicht oder nur unzureichend erfasst werden können.
(VEPs). The functional MRI examinations were carried out 24–48 h after the onset of clinical symptoms. The clinical data and structural imaging findings are sum-marized in Table 1. Additionally, five healthy controls (mean age ± SD: 27.0 ± 5.1 years) were included in the study. Previous PET studies have shown no regression of CBF in Brodman’s area 17 with age, therefore it is ap-propriate to compare CBF in the primary visual cortex despite the different age groups in our cohorts [8].
Experimental Paradigm
The stimulus consisted in 1-Hz full-field black and white alternating checkerboard visual stimulation. A red fixa-tion cross was constantly visible. Stimuli were presented to the subjects by a goggle system (VisuaStim XGA, Resonance Technology, Inc., Northridge, CA, USA). The parameters of this system were: field of view = 30°, refresh rate = 60 Hz, resolution = 1,024 × 768. Subjects were asked to gaze the fixation cross. Two different ex-periments were conducted: experiment # 1 for the ASL perfusion contrast measurements with cycle of 30 s ON and 30 s OFF, repeated twelve times resulting in a total presentation time of 720 s; experiment # 2 for the fMRI-BOLD contrast measurements with cycle of 24 s ON and 24 s OFF, repeated twelve times resulting in a total pre-sentation time of 468 s. Therefore, the two stimulus cat-egories are labeled by “baseline” for the OFF cycles and “visual stimulation” for the ON cycles, respectively.
MRI Acquisition
All images were acquired using a 1.5-T whole-body MRI system (Siemens Magnetom Vision, Erlangen, Germany), equipped with a standard radio frequency head coil. The MRI session included the acquisition of a set of 3-D T1-weighted (magnetization prepared rapid acquisition gradient echo, MP-RAGE) images, providing 192 sagittal slices with 1.0 mm thickness, 256 mm × 256 mm field of view (FOV) and a matrix size of 256 × 256. Further scan parameters were: 11.4 ms repetition time (TR), 4.4 ms echo time (TE), and a flip angle of 15° (FA).
fMRI Acquisition
Functional images were acquired using a multislice sin-gle-shot T2*-weighted echo planar imaging sequence, with 20 interleaved axial oblique slices, positioned in-line with the bicommissural axis. 144 dynamic scans were collected in each subject (TR = 2,500 ms, TE = 60 ms, FA = 90°, slice thickness = 4 mm, gap thickness = 0 mm, matrix size = 64 × 64, FOV = 230 mm × 230 mm). The sequence has been driven in 3D PACE mode (Siemens Erlangen) to enable prospective motion correction.
ASL Acquisition
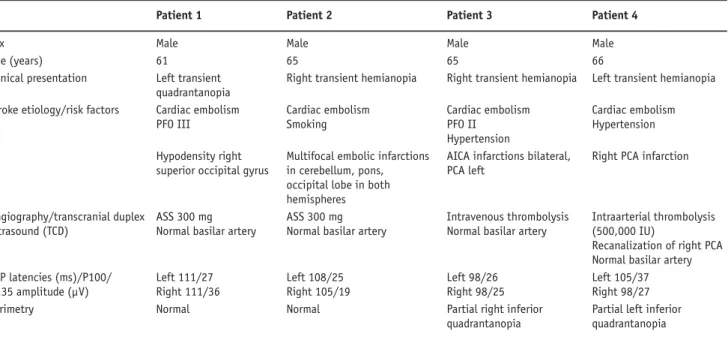
The labeling method used in this work is applied as pulsed arterial spin labeling (PASL) and has been de-scribed elsewhere [9–12] and is referred to as QUIPPS Table 1. Clinical data of four patients with transient visual deterioration after posterior circulation stroke. AICA: anterior inferior cerebellar artery; ASS: acetylsalicylic acid; CT: computed tomography; PCA: posterior cerebral artery; PFO: persistent foramen ovale; VEP: visual evoked potentials.
Patient 1 Patient 2 Patient 3 Patient 4
Sex Male Male Male Male
Age (years) 61 65 65 66
Clinical presentation Left transient Right transient hemianopia Right transient hemianopia Left transient hemianopia
quadrantanopia
Stroke etiology/risk factors Cardiac embolism Cardiac embolism Cardiac embolism Cardiac embolism
PFO III Smoking PFO II Hypertension
Hypertension
CT Hypodensity right Multifocal embolic infarctions AICA infarctions bilateral, Right PCA infarction superior occipital gyrus in cerebellum, pons, PCA left
occipital lobe in both
hemispheres
Angiography/transcranial duplex ASS 300 mg ASS 300 mg Intravenous thrombolysis Intraarterial thrombolysis ultrasound (TCD) Normal basilar artery Normal basilar artery Normal basilar artery (500,000 IU)
Recanalization of right PCA Normal basilar artery VEP latencies (ms)/P100/ Left 111/27 Left 108/25 Left 98/26 Left 105/37
N135 amplitude (µV) Right 111/36 Right 105/19 Right 98/25 Right 98/27
Perimetry Normal Normal Partial right inferior Partial left inferior
II with thin-slice TI1 periodic saturation. Arterial spins are labeled by a thick (10 cm) inversion slab, placed proximal to the imaged slices (PICORE labeling scheme) [9]. During the inversion time TI2, the labeled blood perfuses the tissue in the imaging slices, causing a slight decrease of the MR signal of the tissue. Subtrac-tion of the labeled image from a referring control image assesses this change in signal. The repeated saturation pulses between TI1 and TI1 stop define the time width of the bolus. In the control measurement, the pulse is executed off-resonance.
The full details of the PASL parameters are de-scribed elsewhere [13] and are summarized as follows: the gap between the labeling slab and the proximal slice is 10 mm, TI1 = 700 ms, TI1 stop time = 1,300 ms, TI2 = 1,400 ms, crusher bipolar gradients are switched be-tween slice excitation and readout to reduce signal from large vessels. Further parameters are: TR = 2,500 ms, number of measurements n = 288, measurement time Tacq = 12 min 07 s, TE = 15 ms, six slices at a distance of 1.5 mm, slice thickness = 6.0 mm, matrix size = 64 × 64, FOV = 224 mm × 224 mm, partial Fourier 6/8, BW = 3,004 Hz/Px, echo spacing = 0.4 ms. The sequence has been driven in 3D PACE mode (Siemens Erlangen) to enable prospective motion correction.
fMRI Analysis
Analysis of the fMRI data was performed using Brain Voyager QX 1.2 (Brain Innovation, Maastricht, The Netherlands, www.BrainVoyager.com). Preprocessing of the images included the removal of low-frequency drifts, 3-D motion detection and correction and spatial smoothing with 4-mm full width half maximum. Co-registration of the 2-D functional to the 3-D structural images was performed using the scanner’s slice position parameters of the T2*-weighted measurements and the T1-weighted anatomic measurements. The spatial reso-lution of functional data set was interpolated to isovoxel 1 mm3. Finally, the anatomic and functional data sets
were transformed into the Talairach space [14]. Acti-vated voxels in the primary visual cortex were identified using Student’s t test between time series and boxcar model function (threshold: t > 4.0, p < 0.0001). These voxels are referred to as region of interest (ROI). The re-construction of the hemodynamic response function was performed using a general linear model (GLM) to esti-mate the finite impulse response (FIR) associated with the stimulus period. The convolution of the discrete time points with the event sequence was built. For the
extrac-tion of the BOLD signal (labeled as condiextrac-tion BOLD hereafter) we used twelve FIR time bins (with TR = 2.5 s, this corresponds to the time interval 0–30 s after stimu-lus onset). The BOLD signal change was normalized and expressed as percent change from baseline.
ASL Analysis
Analysis of the ASL data was performed using self-writ-ten MATLAB programs (MATLAB version 6, release 13; The MathWorks, Inc., Natick, MA, USA) and with BrainVoyager QX 1.6. As the measured voxel dimen-sion lies in the same range as the spatial smoothing ker-nel, we decided to apply no temporal and spatial ma-nipulation (“filtering” or “smoothing”) of the raw data [13]. Data of each subject was used to calculate a flow time series (control – labeling; labeled as condition CBF hereafter). The difference signal (control – labeling) is proportional to CBF [9]. The quantification of CBF of the flow time series was performed using the following relation:
where ∆M is the difference signal (control – labeling);
M0 is the equilibrium brain tissue magnetization; the time constants TI1, TI2 are described above and TIb = 1,200 ms is the decay time for labeled blood at 1.5 T.
Activated voxels in the primary visual cortex were identified using Student’s t-test between CBF time series and boxcar model function (threshold: t > 4.0, p < 0.0001). The reconstruction of the CBF response function was performed using the same procedure as used for the reconstruction of the hemodynamic re-sponse function, i.e., GLM to estimate the FIR associ-ated with the stimulus periods.
Results
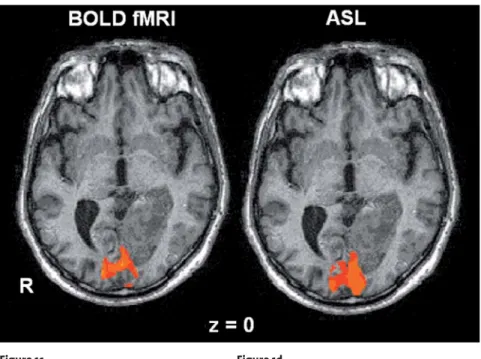
Activation of primary visual cortex by checkerboard stimulation is exemplarily shown in Figure 1a for BOLD and Figure 1b for ASL-CBF in a healthy control and in Figure 1c for BOLD and Figure 1d for ASL-CBF in the patient, who received intravenous thrombolysis.
BOLD-fMRI Activation with Checkerboard
Stimulation in Stroke Patients and Healthy Controls The activation patterns were compared to five healthy controls. The centers of gravity of the BOLD activa-tion were located in the area V1 of the visual cortex, inferior to the calcarine sulcus for both healthy controls
TIb TI e TI M M CBF 2 0 1 2 ∆ =
and patients. The absolute values and the percentage of BOLD sig-nal increase were calculated for the clinically affected and contralateral hemisphere at V1, and the left ver-sus right side in healthy controls, respectively. During visual stimula-tion, the BOLD signal increase ac-counted for 1.01% in patients and 1.03% in controls, showing no sig-nificant differences. No differences were found between the patients who were treated conservatively and those who received thrombo-lytic therapy. In images with iden-tical thresholds, there was no sig-nificant difference in the volume of activation in V1 for patients versus healthy controls (F(1,7) = 0.18; p = NS [not significant]).
ASL Activation with Checker-board Stimulation
in Stroke Patients and Healthy Controls
The regional cerebral perfusion (rCBF) at baseline and during the visual stimulation was calculated in the same regions as used for BOLD analysis. rCBF values in the poste-rior circulation territory at baseline were reduced in both patients who have been treated conservatively (stroke/healthy: 42 ml/100 g/min vs. 41 ml/100 mg/min; 48 ml/100 g/min vs. 41 ml/100 g/min) and in the patient who underwent intravenous throm-bolytic therapy (stroke/healthy: 51 ml/100 g/min vs. 45 ml/100 g/min). The relative cerebral blood flow was increased in one patient, who un-derwent intraarterial thrombolysis (stroke/healthy: 74 ml/100 g/min vs. 85 ml/100 g/min), indicating early hyperperfusion. Resting CBF values of controls were: 53.5 × 4.1 ml/100 g/ min and 54.5 × 4.4 ml/100 g/min; perfusion CBF values of controls during the visual stimulation were: Figures 1a and 1b. BOLD-fMRI (a) and ASL-CBF (b) response to checkerboard stimulation in a
healthy control. The percentage BOLD and ASL-CBF signal changes were calculated from the centers of gravity of the activation maps with p > 0.05 signal change. Talairach coordinates cor-responding to the center of gravity (x, y, z): fMRI right: 1.3 ± 2.1; –71.8 ± 3.2; –11.1 ± 2.9; fMRI left: –9.4 ± 1.6; –95.0 ± 2.1; –5.1 ± 2.4; ASL-CBF: –2.5 ± 4.7; –83.0 ± 6.4; –6.2 ± 5.0.
Figure 1a Figure 1b
Figures 1c and 1d. BOLD-fMRI (c) and ASL-CBF (d) response to checkerboard stimulation in a patient with transient visual deterioration after ischemic stroke of the left PCA. BOLD-fMRI showed no alterations of the signal increase (1.0% for both V1, respectively). CBF-ASL response was increased in left V1 (13.7% vs. 6.7%), indicating early hyperperfusion after thrombolytic therapy (day 2 after stroke). Talairach coordinates corresponding to the center of gravity (x, y, z): fMRI right: 18.9 ± 7.4; –87.8 ± 8.0; –7.1 ± 4.4; fMRI left: –16.1 ± 7.2; –86.0 ± 9.1; –9.2 ± 6.5; ASL-CBF: 1.4 ± 6.8; –84.0 ± 6.1; –2.1 ± 5.6.
68.5 × 7.2 ml/100 g/min and 70.1 × 7.7 ml/100 g/min. The percentage CBF signal change was impaired in both patients, who were treated conservatively (stroke/healthy: patient 1: 9.5% vs. 12.2%, patient 2: 4.2% vs. 9.7%), and increased
in both patients, who underwent thrombolysis (stroke/healthy: pa-tient 3: 13.7% vs. 6.7%, papa-tient 4: 27.0% vs. 11.7%). The percentage rCBF increase was lower in con-servatively treated patients, com-pared to healthy controls (aver-age increase in controls 28.8%). After intraarterial thrombolysis, the percentage ASL-CBF response in the stroke side returned to values similar to controls and lower in the contralateral side. In images with identical thresholds, there was no significant difference in the rCBF volume of activation in the prima-ry visual cortex for patients rela-tive to healthy controls and com-pared to the activated areas during BOLD contrast imaging (F(1,7) = 0.24; p = NS).
These results are summarized in Figures 2a and 2b for the percentage BOLD and ASL-CBF response and Figure 3 for the absolute CBF values during resting and activation. 0 5 10 15 20 25 30 35 40 45 50 0.95 0.97 0.99 1.01 1.03 1.05
BOLD % signal change
C B F % s igna l c h a n ge
Patient no thrombolysis: lesion side Patient no thrombolysis: contralateral side Control: left Control: right 0 5 10 15 20 25 30 35 40 45 50 0.95 0.97 0.99 1.01 1.03 1.05
BOLD % signal change
C B F % s igna l c h a nge
Patient after thrombolysis: lesion side Patient after thrombolysis: contralateral side Control: left
Control: right
Figures 2a and 2b. Percentage BOLD signal change and ASL-CBF response to checkerboard stimulation (x-axis: percentage of BOLD signal change; y-axis: percentage of ASL-CBF change) in four patients, with transient visual deterioration and in five healthy controls. Response to stimulus in two patients who received no thrombolysis (a), and response to stimulus after thrombolysis (b). Red filled diamonds and red filled squares mark the lesion sides of the patients; blue filled diamonds and blue filled squares mark the contralateral hemispheres. Open red and blue diamonds are for left and right side of controls.
Figure 2a Figure 2b 30 40 50 60 70 80 90 100 110 No thrombolysis No thrombolysis Intravenous thrombolysis Intraarterial thrombolysis Control (left = red; right = blue) A S L pe rf us io n ( m l/1 0 0 g/ m in)
Resting: lesion side Resting: contralateral side Stimulus: lesion side Stimulus: contralateral side
Figure 3. Resting CBF and CBF response to stimulus in patients and controls. Framed symbols: resting; filled symbols: visual stimulation. The graphs clearly show the effect of early hyperper-fusion due to intraarterial thrombolysis in patient 4. Both patients who received thrombolysis showed a stronger ASL-CBF response than untreated patients.
Discussion
We observed no hemispheric differences between pa-tients and controls after minor ischemic stroke. How-ever, the relative blood flow in the posterior cerebral arteries and the relative ASL-CBF response to check-erboard stimulation were reduced in three patients, compared to controls. In particular, in the patient who received intraarterial thrombolytic therapy, improve-ment of the relative CBF and ASL-CBF responses was observed, suggesting early reperfusion.
Activation flow coupling (AFC), which is the cou-pling of CBF with neuronal activity, is the basis for many functional neuroimaging techniques. There is good evi-dence that hemodynamic compromise can alter AFC [15]. Studies of CBF responses to motor activation in humans using fMRI have shown alterations in the flow response to functional activation after minor ischemic stroke, even despite grossly intact task performance [1]. Early postischemic hyperperfusion has been reported in animal stroke models and is the hallmark of efficient recanalization of the occluded artery with subsequent reperfusion of the tissue [16]. In this case series of four patients with ischemic stroke of the posterior vascular territory, we wanted to test whether ASL-CBF and BOLD-fMRI in an acute stroke setting provide relevant information about early flow-related changes. Given the hypothesis that reperfusion leads to early hyperperfu-sion of postischemic brain tissue, the stimulus response to ischemic areas should be improved after thrombolytic therapy. In our series, we have detected no significant alteration of the BOLD response to visual stimulation in subacute stroke, 24 h after onset of transient visual symptoms, compared to healthy controls. These findings are different from studies in the anterior vascular terri-tories, which have detected an impaired motor-related BOLD response in patients with minor stroke [2]. These differences might be partially explained according to different stimulus characteristics in motor tasks, which are sensitive to frequency, amplitude and strength, and in the standardized visual stimulation.
Bilateral resting perfusion changes in the poste-rior arteries were found in patients 1–3. These findings might be either explained by microstructural alterations due to microemboli in the posterobasilar circulation, preexisting hyalinosis of the capillary network or direct influence on neurovascular coupling with disruption of aminergic and cholinergic fibres.
In a recent animal study, investigating forepaw BOLD and ASL-CBF responses in stroke rats, the
fore-paw BOLD responses were less attenuated than the forepaw CBF responses. These observations suggest un-coupling of metabolism and changes in cerebral blood volume and/or CBF, associated with ischemia. The authors concluded that, during ischemic stroke, where baseline signals are physiologically altered, quantitative CBF-fMRI provide more appropriate measures than BOLD-fMRI [16].
Reduced CBF-ASL responses in the visual cortex, compared to healthy controls, were detected in two pa-tients, who were treated conservatively, and one patient, who received intravenous thrombolysis. Despite tran-sient symptoms without persisting deficits, the patients who received no thrombolytic therapy (patients 1 and 2), were found to have impaired CBF-ASL response to checkerboard stimulation. In one patient, who under-went successful intravenous thrombolysis, the CBF-ASL response showed moderate improvement at the affected site. The absolute CBF values before and dur-ing checkerboard stimulation were slightly elevated at the affected hemisphere in patients 1–3, compared to the clinically unaffected hemisphere. The clinical im-pact of such an early increase in resting perfusion re-mains unclear and is still a matter of debate, especially in cases where the differences are marginal. Areas with hyperperfusion may occur as early as 5–18 h after stroke onset, even in remote areas that are topographically dis-tinct from the infarcted regions [17]. Early poststroke hyperperfusion is a harmless and even perhaps benefi-cial phenomenon [18]. Patient 4 of our series demon-strated such an early and marked increase in baseline CBF in the posterior circulation, indicating early post-treatment hyperperfusion. After intraarterial throm-bolysis, he recovered completely. PET studies have sug-gested that hyperperfused areas in acute ischemic stroke exhibit hemodynamic and metabolic abnormalities con-sistent with postrecanalization hyperperfusion with un-derlying increased oxidative metabolism, reflecting in-creased protein synthesis [19]. Such findings have been correlated with better outcome after acute stroke. The VEPs were preserved in the acute stage, demonstrating that the visual system was functional which is in accor-dance with a favorable clinical prognosis.
Conclusion
In this case series of four patients, we wanted to test early postischemic functional and flow-related effects using ASL-CBF and BOLD-fMRI after different thera-pies. As BOLD signal changes were not detectable, it
might be hypothesized that subtle changes in minor ischemic stroke are obscured at the site of venous out-flow, whereas ASL-CBF helps to study effects that are closely related to the arterial site, probably related to microstructural alterations in the capillary system or therapy effects immediately after recanalization. With ASL-CBF, absolute CBF and functional response to visual stimulation indicated early effective reperfusion after intraarterial thrombolysis, compared to conserva-tive therapy and intravenous thrombolysis. As the num-ber of patients in this case series is very small, ASL-CBF measures will be applied to a larger poststroke popula-tion in future to gain further insight about tissue integ-rity and flow-related changes after different treatment regimen.
Acknowledgments
Funding support by the Swiss National Science Foundation (3200-059077.99) is gratefully acknowledged. We like to thank Mrs. Car-ole Stuker and Mrs. Michela Mordasini for their excellent techni-cal assistance.
References
1. Pineiro R, Pendlebury S, Johansen-Berg H, et al. Altered hemodynamic responses in patients after subcortical stroke measured by functional MRI. Stroke 2002;33:103–9.
2. Krainik A, Hund-Georgiadis M, Zysset S, et al. Regional impairment of cerebrovascular reactivity and BOLD signal in adults after stroke. Stroke 2005;36:1146–52.
3. Posse S, Olthoff U, Weckesser M, et al. Regional dynamic signal chang-es during controlled hyperventilation asschang-essed with blood oxygen level-dependent functional MR imaging. AJNR Am J Neuroradiol 1997; 18:1763–70.
4. Naganawa S, Norris DG, Zysset S, et al. Regional differences of fMR signal changes induced by hyperventilation: comparison between SE-EPI and GE-SE-EPI at 3-T. J Magn Reson Imaging 2002;15:23–30. 5. Detre JA, Leigh JS, Williams DS, et al. Perfusion imaging. Magn Reson
Med 1992;23:37–45.
6. Roberts DA, Detre JA, Bolinger L, et al. Quantitative magnetic reso-nance imaging of human brain perfusion at 1.5 T using steady-state inversion of arterial water. Proc Natl Acad Sci USA 1994;91:33–7. 7. Ewing JR, Cao Y, Knight RA, et al. Arterial spin labeling: validity
test-ing and comparison studies. J Magn Reson Imagtest-ing 2005;22:737–40.
8. Martin AJ, Friston KJ, Colebatch JG, et al. Decreases in regional cere-bral blood flow with normal aging. J Cereb Blood Flow Metab 1991; 11:684–9.
9. Luh WM, Wong EC, Bandettini PA, et al. QUIPSS II with thin-slice TI1 periodic saturation: a method for improving accuracy of quantitative perfusion imaging using pulsed arterial spin labeling. Magn Reson Med 1999;41:1246–54.
10. Wong EC, Buxton RB, Frank LR. Implementation of quantitative perfu-sion imaging techniques for functional brain mapping using pulsed arterial spin labeling. NMR Biomed 1997;10:237–49.
11. Wong EC, Buxton RB, Frank LR. Quantitative perfusion imaging using arterial spin labeling. Neuroimaging Clin N Am 1999;9:333–42. 12. Wong EC, Buxton RB, Frank LR. Quantitative imaging of perfusion
us-ing a sus-ingle subtraction (QUIPSS and QUIPSS II). Magn Reson Med 1998;39:702–8.
13. Federspiel A, Muller TJ, Horn H, et al. Comparison of spatial and tem-poral pattern for fMRI obtained with BOLD and arterial spin labeling. J Neural Transm 2006;113:1403–15.
14. Talairach J, Tournoux P. Co-planar stereotaxic atlas of the human brain: 3-dimensional proportional system: an approach to cerebral imaging. Stuttgart–New York: Thieme, 1988.
15. Girouard H, Iadecola C. Neurovascular coupling in the normal brain and in hypertension, stroke, and Alzheimer disease. J Appl Physiol 2006; 100:328–35.
16. Silva AC, Lee SP, Yang G, et al. Simultaneous blood oxygenation level-dependent and cerebral blood flow functional magnetic resonance im-aging during forepaw stimulation in the rat. J Cereb Blood Flow Metab 1999;19:871–9.
17. Marchal G, Young AR, Baron JC. Early postischemic hyperperfusion: pathophysiologic insights from positron emission tomography. J Cereb Blood Flow Metab 1999;19:467–82.
18. Shen Q, Ren H, Cheng H, et al. Functional, perfusion and diffusion MRI of acute focal ischemic brain injury. J Cereb Blood Flow Metab 2005; 25:1265–79.
19. Marchal G, Furlan M, Beaudouin V, et al. Early spontaneous hyperperfu-sion after stroke. A marker of favourable tissue outcome? Brain 1996; 119:409–19.
Address for Correspondence
Andrea Federspiel, PhD
Department of Psychiatric Neurophysiology University Hospital of Psychiatry
Bolligenstrasse 111 3000 Bern 60 Switzerland
Phone (+41/31) 9309-371, Fax -961 e-mail: federspiel@puk.unibe.ch