C. Allgayer M. J. Zellweger C. Sticherling S. Haller O. Weber P. T. Buser J. Bremerich Received: 28 December 2007 Revised: 2 May 2008 Accepted: 6 May 2008 Published online: 25 July 2008
# European Society of Radiology 2008
Optimization of imaging before pulmonary
vein isolation by radiofrequency
ablation: breath-held ungated versus
ECG/breath-gated MRA
Abstract Isolation of the pulmonary veins has emerged as a new therapy for atrial fibrillation. Pre-procedural magnetic resonance (MR) imaging enhances safety and efficacy; more-over, it reduces radiation exposure of the patients and interventional team. The purpose of this study was to optimize the MR protocol with respect to image quality and acquisition time. In 31 patients (23–73 years), the anatomy of the pulmonary veins, left atrium and oesophagus was assessed on a 1.5-Tesla scanner with four different sequences: (1) ungated two-dimensional true fast imaging with steady precession (2D-TrueFISP), (2) ECG/breath-gated 3D-TrueFISP, (3) ungated breath-held
contrast-enhanced three-dimensional turbo fast low-angle shot (CE-3D-tFLASH), and (4) ECG/breath-gated CE-3D-True-FISP. Image quality was scored from 1 (structure not visible) to 5 (excellent visibility), and the acquisition time was monitored. The pulmonary veins and left atrium were best visualized
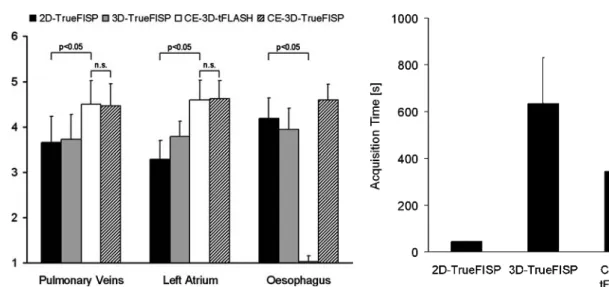
with CE-3D-tFLASH (scores 4.50± 0.52 and 4.59±0.43) and ECG/breath-gated CE-3D-TrueFISP (4.47±0.49 and 4.63±0.39). Conspicuity of the oesophagus was optimal with CE-3D-TrueFISP and 2D-CE-3D-TrueFISP (4.59± 0.35 and 4.19±0.46) but poor with CE-3D-tFLASH (1.03±0.13) (p< 0.05). Acquisition times were shorter for 2D-TrueFISP (44±1 s) and CE-3D-tFLASH (345±113 s) compared with ECG/breath-gated 3D-TrueFISP (634±197 s) and ECG/breath-gated CE-3D-TrueFISP (636±230 s) (p< 0.05). In conclusion, an MR imaging protocol comprising CE-3D-tFLASH and 2D-TrueFISP allows assessment of the pulmonary veins, left atrium and oesophagus in less than 7 min and can be recommended for pre-procedural imaging before electric isolation of pulmonary veins.
Keywords Pulmonary veins . Left atrial catheter ablation . Magnetic resonance angiography
Introduction
Isolation of pulmonary veins has emerged as a new therapy modality for patients with symptomatic, drug refractory atrial fibrillation [1]. Paroxysms of atrial fibrillation frequently originate from the pulmonary veins, with almost half arising in the superior left vein [2]. Electric isolation of pulmonary veins by circumferential radiofrequency abla-tion in the antrum can provide excellent long-term results in selected patients.
Imaging before isolation has three major objectives: (1) to detect anatomic variants of pulmonary veins that exhibit a complex anatomy with significant inter- and intrapatient variability in size, shape, bifurcation and branching patterns [3]; (2) to identify the oesophagus to avoid direct contact with the site of radiofrequency application, which can result in atrio-oesophageal fistula, a rare but potentially lethal complication [4]; (3) to integrate detailed three-dimensional (3D) anatomic data directly into an electro-anatomic mapping system, thus enhancing efficacy and C. Allgayer . S. Haller .
J. Bremerich (*) Department of Radiology, University Hospital Basel, Petersgraben 4, 4031 Basel, Switzerland e-mail: [email protected] Tel.: +41-61-2652525 Fax: +41-61-2654354 M. J. Zellweger . C. Sticherling . P. T. Buser Department of Cardiology, University Hospital Basel, Basel, Switzerland O. Weber
Department of Medical Physics, University Hospital Basel, Basel, Switzerland
safety of the procedure, and reducing fluoroscopy time and radiation exposure of patients and interventional team [5]. Contrast-enhanced (CE) ECG-gated computed tomogra-phy (CT) is frequently used for 3D imaging of the left atrium and pulmonary veins. ECG-gated CT, however, may be hampered by rhythm disturbances in patients with paroxysmal or persistent atrial fibrillation [6]. Moreover, CT-related radiation exposure of approximately 10 mSv [6] is a concern, since the isolation procedure itself is guided by fluoroscopy and can be associated with substantial radiation exposure. This is particularly relevant in repeated imaging of pulmonary veins due to repeated procedures or follow-up.
Magnetic resonance (MR) is also used for pre-procedural imaging before isolation of pulmonary veins. Axial 2D imaging might show the anatomic relation between the oesophagus and left atrium but is not sufficient for procedure planning. Dong et al. [7] proposed a breath-held CE MR angiography (CE-3D-MRA) without ECG gating. An ECG-gated and respiratory-gated (ECG/breath-gated) sequence, however, has not been assessed for procedure planning. This sequence has been introduced for coronary angiography and can depict anatomy in great detail [8]. Such images are acquired using the diaphragm position for respiratory gating [9]. The acquisition time, however, can be 10 min and longer [9]. The application of ECG/breath-gated MR for planning electric isolation of pulmonary veins has not yet been assessed. It is unclear whether pre-procedural imaging can be optimized with such a sequence.
The purpose of the current study was to optimize the MR protocol with respect to image quality and acquisition time. The following sequences were compared: (1) ungated 2D balanced steady state free precession (2D-TrueFISP), (2) ECG/breath-gated 3D-TrueFISP [9], (3) ungated breath-held CE 3D turbo fast low-angle shot (tFLASH), and (4) ECG/breath-gated CE-3D-TrueFISP.
Materials and methods Patients
Thirty-one consecutive patients scheduled for image guided isolation of pulmonary veins by radiofrequency ablation were included. The study was approved by the local Ethical Committee. Patient age ranged from 23 to 73 years with mean age of 53. Twenty-four patients were male, seven were female.
MR imaging
Patients were placed supine in a 1.5-Tesla magnet (Magnetom Avanto or Espree, Siemens, Erlangen, Ger-many) equipped with a phased array body coil. After
multiplanar scout images, the following images were acquired. Axial 2D-TrueFISP with slice thickness of 6 mm and spacing of 7.5 mm with TR/TE of 2.8/1.2 ms during breath-hold without ECG-gating. Typically images were acquired in two stacks of 15 slices each.
Respiratory- and ECG-gated 3D-TrueFISP images with TR/TE of 3/1.3 ms were acquired in axial orientation as previously described [8,9]. Effective matrix was 256×173 reconstructed to 512×246, effective spatial resolution was 1.5×1.3×1.5 mm3, reconstructed resolution was 0.8×0.7× 1.5 mm3, 80 partitions. Briefly, a navigator was placed perpendicular to the liver/lung interface enabling breath-gating during free breathing. Image data acquired after every ECG-gating signal were accepted or rejected depending on the position of the diaphragm. After a test scan the acceptance window was optimized to minimize rejected image data and to enhance scan efficiency; the acceptance window was set to 4.5-mm wide. Patients were instructed to breathe normally and regularly; the average navigator efficiency was 51±14%.
Breath-held, ungated 3D-MRA was a specific 3D CE-MRA protocol, which was acquired after a test bolus injection of 2 ml Gd-DOTA to measure the arrival time of the bolus from injection in a cubital vein to the left atrium as discribed previously [10]. Three-dimensional tFLASH images with a matrix size of 307×512, field of view 380× 380 mm, 80 partitions and slice thickness of 1.2 were acquired with TR/TE settings of 3.5/1.3 ms and a flip angle of 25° during breath-hold for 18 s before and after administration of 0.1 mmol/kg GdDOTA. Precontrast images were subtracted from postcontrast images.
Subsequently 3D-TrueFISP was repeated during the equilibrium phase of contrast material.
Image analysis
Images were transferred to a workstation for analysis with efilm software (Merge Healthcare, Mississauga, Canada). Image quality was assessed with respect to delineation of pulmonary veins, left atrium, and Oesophagus by a reader with 15 years’ experience in cardiac MR. Image quality was scored on a five point scale as follows: (1) structure not visible, (2) structure visible, non-diagnostic, (3) visible but limited diagnostic value, (4) visible, diagnostic, (5) excellent visibility, clear delineation of structure. Signal-to-noise ratios (SNRs) for left atria were calculated by dividing the signal intensity of the left atria by the standard deviation.
The acquisition time was determined by adding the acquisition times of the stacks of 2D-TrueFisp images, by calculating the time elapsed between the start of test bolus and end of CE-3D-MRA. The acquisition time of respira-tory and ECG-gated 3D-TrueFisp before and after contrast administration was available from the log file of the images.
Statistical analysis
Data are reported as mean ± standard error of the mean. The acquisition times had no normal distribution (Komolgorov-Smirnov test). Therefore, we used repeated measures non-parametric Friedman group tests and post-hoc pair-wise comparisons in Dunn’s multiple comparison tests. A p value < 0.05 was considered significant.
Results
CE-MR was well tolerated by all patients. Twenty-one patients were in sinus rhythm, ten in atrial fibrillation. All MR imaging studies were diagnostic and could be used for planning of interventional isolation of the pulmonary veins. The mean total examination time was 48 min.
Pulmonary veins were best appreciated with ungated CE-3D-tFLASH and ECG/breath-gated CE-3D-TrueFISP with scores of 4.50±0.52 and 4.47±0.49, respectively. Scores of 2D-TrueFISP and 3D-TrueFISP were
signifi-cantly lower with values of 3.65±0.57 and 3.72±0.55, respectively (p<0.01). Thus, the pulmonary veins were best visible with CE-3D-tFLASH and CE-3D-TrueFISP (Fig.1). The SNR of ECG/breath-gated CE-3D-TrueFISP was higher (21.3±6.7) compared with non-enhanced 3D-TrueFISP (13.8±3.8) and CE-3D-tFLASH (9.0±2.4). The majority of patients had normal pulmonary vein anatomy with two veins draining on either side. Anatomic variations of pulmonary vein anatomy, such as supranumerous veins (n=4) or common ostia (n=2), were found in six (19%) patients. Figure 2a shows a supranumerous right middle lobe vein draining directly to the left atrium; Fig.2b shows all right pulmonary veins draining through one ostium into the left atrium, as depicted with the CE-3D-tFLASH sequence.
The left atrium was best delineated on CE-3D-tFLASH and CE-3D-TrueFISP with scores of 4.59±0.43 and 4.63± 0.39, respectively (Fig. 3). On 3D-TrueFISP, and particu-larly on 2D-TrueFISP images, the walls of the left atrium were less conspicuous with scores of 3.78±0.35 and 3.29± 0.42, respectively (p<0.01). In particular, the superior and Fig. 1a–d Normal anatomy in a
53-year-old man with atrial fi-brillation assessed with four different sequences. The left atrium (LA) and right lower pulmonary vein (arrow) are depicted on axial 2D-TrueFISP (a), ECG/breath-gated 3D-True-FISP (b), CE-3D-tFLASH (c), and ECG/breath-gated CE-3D-TrueFISP (d). The oesophagus (arrowhead) appears bright with clearly visible contact area to the left atrium on TrueFisp (a, b, d) but is almost invisible on CE-3D-tFLASH (c) images
Fig. 2a, b Anatomic variation illustrated on double oblique targeted maximum intensity projection CE-3D-tFLASH. A 53-year-old man (a) had three right pulmonary veins (arrows) draining into the left
atrium (LA); a 54-year-old man (b) had one common ostium (*) for all left pulmonary veins. Anatomic variations occurred in 19% of patients
inferior wall of the left atrium was difficult to identify on axial 2D-TrueFISP images.
The oesophagus was best visible on axial CE-3D-TrueFISP and 2D-CE-3D-TrueFISP, with scores of 4.59±0.35 and 4.19±0.46, respectively. On 3D-TrueFISP the oesophagus was less conspicuous 3.94±0.47 and on CE-3D-tFLASH it was almost invisible with a score of 1.03±0.13. Thus, the oesophagus is best visible with axial 2D-TrueFISP and CE-3D-TrueFISP sequences (Fig.3).
The acquisition times were 44±1 s for 2D-TrueFISP, which was acquired in two stacks, 634±197 s (10 min 34 s) for free-breathing 3D-TrueFISP, 345±113 s (5 min 45 s) for CE-3D-tFLASH (including the test bolus scan and calculation of bolus arrival time but exclusive of injector set-up), and 636±230 s (10 min 36 s) for CE-3D-TrueFISP (Fig. 4). Although patients were instructed to breathe normally and regularly, some patients showed a trend towards shallow breathing pattern or even fell asleep. In these cases patients had to be reminded to breathe regularly.
Discussion
The major findings of this study are: (1) pulmonary veins and left atrium are best visualized on CE-3D-tFLASH and ECG/breath-gated CE-3D-TrueFISP, (2) oesophagus is best visualized on 2D-TrueFISP or CE-3D-TrueFISP images, and (3) the acquisition times of breath-held 2D-TrueFISP and CE-3D-tFLASH are significantly shorter than those of free breathing (ECG/breath-gated) sequences.
The position of pulmonary vein ostia are important anatomic landmarks in planning the ablation lines. The variation in number and insertion of pulmonary veins, however, is very high [11], thus illustrating the need for precise anatomical data. The positive effect of merging a 3D CT data set with a electronantomic map on the success rate of left atrial ablation has recently been shown [12]. These authors reported a success rate of 69% without versus 80% with 3D image fusion [12]. Moreover, adding 3D images significantly reduced fluoroscopy time from 62 to 49 min and thus also reduced radiation exposure considerably [12]. Further reduction of radiation exposure was the motivation for replacement of CT [13] by MR [7]. The current study showed that MR can be used for this purpose and that pulmonary veins and left atria are best visualized on 3D-tFLASH and ECG/breath-gated CE-3D-TrueFISP. This finding is supported by a study from Heist et al. [5], who reported good image integration for electroanatomic mapping with a CE-3D-MRA sequence. Moreover, these authors compared MR and CT and found no significant difference between these modalities with respect to accuracy of image integration. Error in integra-tion, however, was higher in enlarged left atrium [5]. This is an important finding, since modest differences in Fig. 3 Image quality score for pulmonary veins, left atrium and
oesophagus. Visibility of pulmonary veins and left atrium was suboptimal on 2D-TrueFISP and ECG/breath-gated 3D-TrueFISP, whereas both tFLASH and ECG/breath-gated CE-3D-TrueFISP provided significantly better visibility. The oesophagus was barely visible on CE-3D-tFLASH but well assessable on the other sequences. Thus 2D-TrueFISP and breath-held CE-3D-tFLASH are complementary and may be recommended to achieve good conspicuity of veins, atrium and oesophagus
Fig. 4 Acquisition times of tested sequences. The shorter acquisi-tion time of both 2D-TrueFISP and CE-3D-tFLASH compared with the other sequences (p<0.05) is another strong argument to recommend them for pre-procedural imaging
Table 1 Protocol suggestion for MR before electric isolation of pulmonary veins (ax axial, cor coronal, sag sagittal, bh breath-held, exp acquisition at end-exspiration)
Sequence Comment Orientation Acquisition time (s)
Scout ax/cor/sag
CE-3D-MRA bh/ungated/exp cor 345
integration error may be particularly important in relation to the thin ridges separating the pulmonary vein and the left atrial appendage, which are typically 3–6 mm in width [14]. The image quality of this ungated sequence was similar to ECG/breath-gated CE-3D-TrueFISP but acqui-sition time was significantly shorter. Thus, cardiac motion seems to have a minor impact on imaging pulmonary veins and the left atrium. This notion is supported by data from Malchano et al. [15], who found that the phase of the cycle would not be expected to have an overly negative/dramatic impact on the quality of registration, since the regions of the left atrium most relevant for performing a pulmonary vein isolation procedure do not tend to have large movements during the cardiac cycle, since they are tethered to the body near the pulmonary veins. The same seems to be true for the hemodynamic status that might change between preinterventional 3D imaging and electroanatomic mapping [15]. On the other hand, Syed et al. [16] and Lickfett et al. [17] have reported significant motion of pulmonary vein orifice during the cardiac cycle. Malchano et al. [15] also compared acquisition at end-inspiration and end-exspiration and found that datasets in end-expiration align significantly better to the electroanatomic mapping than end-inspiration images, which is consistent with the finding that expiration corresponds best with the state of “quiet respiration”, during which catheter-based electro-anatomic mapping points are typically acquired [15]. Unenhanced MR was unacceptable in the current study, which is interesting because a radiation-free and contrast-material-free modality would have been desirable, particu-larly in the context of recent concerns of contrast-induced nephrogenic systemic fibrosis [18].
The oesophagus and left atrium have a close relation with mean contact width of 18.9 mm [19]. Thus procedure planning requires assessment of atrio-esophageal relation to avoid thermal injury with fistula formation and potentially fatal haemorrhage [20]. The course of the oesophagus is quite variable, but typically it is closer to the left pulmonary vein [19]. One has to bear in mind, however, that the oesophagus is a mobile structure with a
range of motion of up to 2 cm, as observed on cine-fluoroscopy [21]. Visualization of the oesophagus was poor on CE-3D-tFLASH images, which can be explained by the strong T1 weighting with an echo time of 1.3 ms and a flip angle of 25°. Such angiography sequences are optimized for imaging gadolinium-enhanced vessels with minimal confounding background signal [10]. In the current study, the oesophagus was best visualized on ECG/breath-gated CE-3D-TrueFISP which can be explained by enhancement of the mucosa. Thus, a CE-TrueFISP sequence should be included in an imaging protocol for procedure planning.
The acquisition times in the current studies were shortest for 2D-TrueFISP and CE-3D-tFLASH. These images provide the relevant data for planning of electroanatomic mapping and the 3D dataset can be imported in the software for the procedure. Acquisition times of breath/ respiratory-gated 3D-TrueFISP and CE-3D-TrueFISP were both longer. Similar image quality of CE-3D-tFLASH and CE-3D-TrueFISP but substantially shorter acquisition time of tFLASH are arguments in favour of CE-3D-tFLASH for imaging pulmonary veins and left atria. This sequence should be complemented by 2D-TrueFISP for depiction of the oesophagus with diagnostic quality thus resulting in a concise imaging protocol.
The following limitation of the current study has to be mentioned. The current study was focused on optimization of an MR protocol with respect to imaging of structures relevant for interventional isolation of pulmonary veins and acquisition time. The alignment of the 3D MR data with the electroanatomic mapping, however, has not been addressed in the current study.
In conclusion, we suggest the following MR protocol for imaging pulmonary veins, left atrium, and oesophagus, to plan and guide interventional isolation of pulmonary veins. After multiplanar scout images, CE-3D-tFLASH should be acquired for assessment of pulmonary veins and the left atrium, followed by 2D-TrueFISP for visualization of the oesophagus (Table1). These images can be acquired within 7 min, multiplanar scout images and set-up not included.
References
1. Jaïs P, Haïssaguerre M, Shah DC, Chouairi S, Gencel L, Hocini M, Clémenty J (1997) A focal source of atrial fibrillation treated by discrete radiofrequency ablation. Circulation 95:572–576
2. Haïssaguerre M, Jaïs P, Shah DC, Takahashi A, Hocini M, Quiniou G, Garrigue S, Le Mouroux A, Le Métayer P, Clémenty J (1998) Spontaneous initiation of atrial fibrillation by ectopic beats originating in the pulmonary veins. N Engl J Med 339:659–666
3. Mansour M, Holmvang G, Sosnovik D, Migrino R, Abbara S, Ruskin J, Keane D (2004) Assessment of pulmonary vein anatomic variability by magnetic resonance imaging: implications for catheter ablation techniques for atrial fibrillation. J Cardiovasc Electrophysiol 15:387–393
4. Preis O, Digumarthy SR, Wright CD, Shepard JA (2007) Atrioesophageal fistula after catheter pulmonary venous ablation for atrial fibrillation: imaging features. J Thorac Imaging 22: 283–285
5. Heist EK, Chevalier J, Holmvang G, Singh JP, Ellinor PT, Milan DJ, D’Avila AD, Mela T, Ruskin JN, Mansour M (2006) Factors affecting error in inte-gration of electroanatomic mapping with CT and MR imaging during cath-eter ablation of atrial fibrillation. J Interv Card Electrophysiol 17:21–27
6. Cronin P, Sneider MB, Kazerooni EA, Kelly AM, Scharf C, Oral H, Morady F (2004) MDCT of the left atrium and pulmonary veins in planning radio-frequency ablation for atrial fibrillation: a how-to guide. AJR Am J Roentgenol 183:767–778
7. Dong J, Dickfeld T, Dalal D, Cheema A, Vasamreddy CR, Henrikson CA, Marine JE, Halperin HR, Berger RD, Lima JA, Bluemke DA, Calkins H (2006) Initial experience in the use of integrated electroanatomic mapping with three-dimensional MR/CT images to guide catheter ablation of atrial fibrillation. J Cardiovasc Electrophysiol 17:459–466
8. So NM, Lam WW, Li D, Chan AK, Sanderson JE, Metreweli C (2005) Magnetic resonance coronary angiog-raphy with 3D TrueFISP: breath-hold versus respiratory gated imaging. Br J Radiol 78:116–121
9. Weber OM, Martin AJ, Higgins CB (2003) Whole-heart steady-state free precession coronary artery magnetic resonance angiography. Magn Res Med 50:1223–1228
10. Prince MR, Meaney JF (2006) Ex-panding role of MR angiography in clinical practice. Eur Radiol 16(Suppl 2):B3–B8
11. Jongbloed MR, Dirksen MS, Bax JJ, Boersma E, Geleijns K, Lamb HJ, van der Wall EE, de Roos A, Schalij MJ (2005) Multi-detector row CT of pul-monary vein anatomy prior to radio-frequency catheter ablation-initial experience. Radiology 234:702–709
12. Kistler PM, Rajappan K, Jahngir M, Earley MJ, Harris S, Abrams D, Gupta D, Liew R, Ellis S, Sporton SC, Schilling RJ (2006) The impact of CT image integration into an electroana-tomic mapping system on clinical out-comes of catheter ablation of atrial fibrillation. J Cardiovasc Electrophysiol 17:1093–1101
13. Hausleiter J, Meyer T, Hadamitzky M, Huber E, Zankl M, Martinoff S, Kastrati A, Schömig A (2006) Radia-tion dose estimates from cardiac mul-tislice computed tomography in daily practice: impact of different scanning protocols on effective dose estimates. Circulation 113:1305–1310
14. Mansour M, Refaat M, Heist EK, Mela T, Cury R, Holmvang G, Ruskin JN (2006) Three-dimensional anatomy of the left atrium by magnetic resonance angiography: implications for catheter ablation for atrial fibrillation. J Cardi-ovasc Electrophysiol 17:719–723 15. Malchano ZJ, Neuzil P, Cury RC,
Holmvang G, Weichet J, Schmidt EJ, Ruskin JN, Reddy VY (2006) Integra-tion of cardiac CT/MR imaging with three-dimensional electroanatomical mapping to guide catheter manipulation in the left atrium: implications for catheter ablation of atrial fibrillation. J Cardiovasc Electrophysiol 17:1221– 1229
16. Syed MA, Peters DC, Rashid H, Arai AE (2005) Pulmonary vein imaging: comparison of 3D magnetic resonance angiography with 2D cine MRI for characterizing anatomy and size. J Cardiovasc Magn Reson 7:355–360
17. Lickfett L, Dickfeld T, Kato R, Tandri H, Vasamreddy CR, Berger R, Bluemke D, Lüderitz B, Halperin H, Calkins H (2005) Changes o pulmonary vein orifice size and location throughout the cardiac cycle: dynamic analysis using magnetic resonance cine imaging. J Cardiovasc Electrophysiol 16:582–588 18. Thomsen HS (2006) Nephrogenic sys-temic fibrosis: a serious late adverse reaction to gadodiamide. Eur Radiol 16:2619–21
19. Cury RC, Abbara S, Schmidt S, Malchano ZJ, Neuzil P, Weichet J, Ferencik M, Hoffmann U, Ruskin JN, Brady TJ, Reddy VY (2005) Relation-ship of the oesophagus and aorta to the left atrium and pulmonary veins: implications for catheter ablation of atrial fibrillation. Heart Rhythm 2:1317–1323
20. Tsao HM, Wu MH, Higa S, Lee KT, Tai CT, Hsu NW, Chang CY, Chen SA (2005) Anatomic relationship of the oesophagus and left atrium: implication for catheter ablation of atrial fibrilla-tion. Chest 128:2581–2587
21. Good E, Oral H, Lemola K, Han J, Tamirisa K, Igic P, Elmouchi D, Tschopp D, Reich S, Chugh A, Bogun F, Pelosi F, Morady F (2005) Move-ment of the oesophagus during left atrial catheter ablation for atrial fibril-lation. J Am Coll Cardiol 46:2107– 2110