U . E i h o l z e r 9 R . G i s i n 9 C . W e i n m a n n 9 S . K r i e m l e r 9 H . S t e i n e r t T . T o r r e s a n i 9 M . Z a c h m a n n 9 A . P r a d e r
Treatment with human growth hormone in patients
with Prader-Labhart-Willi syndrome reduces body fat
and increases muscle mass and physical performance
Received: 25 July 1997/Accepted in revised form: 3 November 1997
A b s t r a c t Twelve children with documented Prader-Labhart-Willi syndrome were treated with h u m a n growth hormone (24 U/mZ/week) during 1 year. The children were divided into three groups: group 1: overweight and prepubertal (n = 6, age 3.8 7.0 years); group 2: underweight and prepubertal (n = 3, age 0.6-4.1 years); group 3: pubertal (n = 3, age 9.2-14.6 years). In group 1, height increased from -1.7 SD to -0.6 SD, while weight decreased from 1.1 SD to 0.4 SD, with a dramatic drop in weight for height from 3.8 SD to 1.2 SD. H a n d length increased from -1.5 SD to -0.4 SD and foot length from -2.5 SD to -1.4 SD. Body fat, measured by dual X-ray energy absorptiometry, dropped by a third, whereas muscle mass increased by a fourth. Physical capability (Wingate test) improved considerably. The children were reported to be much more active and capable. In group 2, similar changes were seen, but weight for height increased, probably because muscle mass increase exceeded fat mass decrease. Changes in group 3 were similar as in group 1, even though far less distinct.
Key words Body composition - Growth hormone treatment 9 Physical performance - Prader-Willi syndrome 9 Quality of life
A b b r e v i a t i o n s B M I body mass index 9 D E X A dual X-ray energy absorptiometry. F F M fat free mass 9 G H D growth hormone deficiency 9 h G H human growth
hormone - L B M lean body mass 9 P W S Prader-Labhart-Willi syndrome 9 I G F insulin- like growth factor - W A n T Wingate anaerobic test
Introduction
Prader-Labhart-Willi syndrome (PWS) is caused by lack of a specific part of the paternal homologue of chro-
mosome 15 long arm due to a deletion [14] or a maternal uniparental disomy [19, 22]. It was first described in 1956 [20] and is the most common syndromal cause of marked obesity. Its incidence is estimated at 1 in 16.000 live births [5]. The characteristic features up to infancy are
U. Eiholzer ([~) ' R. Gisin 9 C. Weinmann
Centre for Adolescent Medicine and Foundation Growth Puberty Adolescence, M6hrlistrasse 69, CH-8006 Zurich, Switzerland, Tel.: ++41 1 364 37 00; Fax: ++41 1 364 37 01
e-mail: [email protected] S. Kriemler
Children's Exercise and Nutrition Centre, McMaster University, Hamilton, Canada
H. Steinert
Department of Medical Radiology, Nuclear Medicine,
Zurich University, 8091 Zurich, Switzerland T. Torresani. M. Zachmann. A. Prader Department of Paediatrics,
University of Zurich, 8032 Zurich, Switzerland
general muscle hypotonia, feeding difficulties and un- derweight due to p o o r sucking and swallowing reflexes. Between the 2nd and 4th year o f life, obesity sets in as a consequence o f uncontrolled compulsive eating. G r o w t h is characterised by m o d e r a t e intra-uterine and p o s t n a t a l growth delay, lack o f a pubertal growth spurt and short stature as an adult. H y p o g e n i t a l i s m and cryptorchidism are c o m m o n features in addition to delayed p s y c h o m o - tor development, mental retardation and behavioural p r o b l e m s with t e m p e r tantrums.
The link between the c h r o m o s o m a l disorder and the clinical manifestations is unknown. Various h y p o t h a - lamic centres are assumed to be involved and several lines o f evidence suggest that a growth h o r m o n e defi- ciency ( G H D ) due to h y p o t h a l a m i c dysregulation m a y contribute to an a b n o r m a l growth pattern, decreased lean b o d y mass, muscle hypotonia, increased total b o d y fat [16] and low energy expenditure [26].
G r o w t h h o r m o n e ( G H ) response to insulin, arginine, clonidine and d o p a are reported to be l o w - n o r m a l or blunted [1, 4, 7, 8, 16, 28], as are sleep-induced G H secretion [9] and 24-h integrated G H concentrations [1]. In contrast to simple obesity, insulin-like growth factor ( I G F ) - I [2, 8, 15, 16] and insulin-like growth factor binding protein-3 [16] were reported to be low or in the low-normal range.
There is some evidence that G H treatment m a y ac- celerate growth and reduce weight for height [1, 2, 15, 16, 24, 29]. Short stature, even though a distinct feature (average height o f an adult PWS male is 152 cm, of a female 146 cm) [6], does not pose as m u c h o f a p r o b l e m for the children with PWS and their families, as do p o l y p h a g i a a n d overweight, p o o r physical and intellec- tual p e r f o r m a n c e , and the optimal e n h a n c e m e n t o f ed- ucational and physical performance. We were therefore hoping for the fat-reducing and anabolic, muscle-in- creasing influence o f G H to enhance strength and physical p e r f o r m a n c e . We expected it to have an equally positive effect on muscle h y p o t o n i a and general ady-
369
n a m i a and to i m p r o v e well-being. The p u r p o s e o f this study is to provide an accurate d o c u m e n t a t i o n o f the G H treatment-induced changes and to s u p p o r t the as- sumed presence of a genuine G H D , secondary to a hy- p o t h a l a m i c dysfunction. This p a p e r presents the results o f the 1st year of treatment.
Subjects and methods Subjects (Table 1)
Twelve children with PWS (6 boys, 6 girls) with documented de- letion or uniparental disomy of chromosome 15.
Treatment
Administration of hGH (24 U/mZ/week) in daily subcutaneous injections for the duration of 1 year. No other treatment was ad- ministered, in particular no substitution of sex steroids in the older pubertal children.
Methods
Anthropometric measurements
The anthropometric measurements were performed by the first author according to standard techniques [11, 21].
All auxological results are given as SDS, using the first Zurich Longitudinal Study as reference [21] with exception of arm span, hand and foot length, for which the standards of the Oosterwolde study [11] were used.
All data were processed by GAS 3.0 of the Institute for Medical Informatics, IMI, Zurich, Switzerland.
Due to the age-related variations in the syndrome's manifesta- tions, the patients were divided into three groups:
1. Group 1: six prepubertal, obese children, aged between 3.8 and 7.0 years
2. Group 2: three young, not yet obese children, aged between 0.6 and 4.1 years
3. Group 3: three pubertal children (Tanner stage 2 and 3), aged between 9.2 and 14.6 years.
Table 1 Study subjects
Patient Sex Age at
number beginning (years) Group 1 1 F 3.7 2 F 5.0 3 F 6.7 4 M 6.8 5 F 7.0 6 M 7.O Group 2 7 M 1.5 8 M 1.8 9 M 4.1 Group 3 10 F 9.0 11 M 13.5 12 F 14.6
Bone age Mother Father Mean target
(Greulich-Pyle) height height height [21]
at beginning (cm) (cm) SDS (years) 2.5 167.0 184.0 0.7 164.5 167.0 -0.9 6.5 164.5 167.0 -0.9 5.3 166.0 183.0 0.4 5.8 160.0 178.0 -0.4 7.8 163.0 172.0 -0.6 0.8 152.0 165.0 -1.9 1.3 171.0 173.0 0.1 2.0 168.0 168.0 -0.5 11.5 169.0 183.0 0.8 14.5 162.0 174.0 -0.5 12.5 155.5 170.0 -1.4
Body composition
Body composition was determined by dual-energy X-ray absorptiometry (DEXA) (Hologic QDR-2000, Waltham, Mass., USA, Software version 7.10 B).
Anaerobic perJbrmance (ergometer)
Muscle endurance and peak power were measured by the Wingate anaerobic test (WANT), which is a 30-s cycling test at 'all-out' speed, against a constant braking force (Fleisch-Metabo mechanical ergo-
meter, Switzerland, with pedal revolutions read continuously by a counter) [12]. The test was preceded by a 4-min warm up (pedalling at a mild pace, which yielded a heart rate of 110 130 beats/min), interspersed by several all-out sprinting trials of 2 3 s each. These trials were used for learning the sprinting task, as well as for deter- mining the braking force that would subsequently be used in the test. On the command 'start', the subject started pedalling at maximal speed. Encouragement was given throughout the 30-s period. Two performance indices were calculated: peak power (the highest me- chanical power at any 3-s period) and mean power (the power av- eraged over 30 s). These powers were calculated in Watts per kilogram body weight and as a percentage of normal values [3, 12].
6.0 Height Height Velocity
m 0.0 -2.0 -4.0 4.0 2.0 15.C 10.0 m 5.0 0.0 -5.0 -12 0 6 12 0 6 12 Months Months 6.0 4.0 2 . 0 ~ L . ~ r 0.0 -2.0 l -4.0
Weight Weight for Height
6.C 4.0= 2.0 m 0.0 -2.0 -4.0 -12 0 6 12 -12 0 6 12 Months Months 12.0 10.0 8.0 6.0 U ' ) a m 4.0 2.0 0.0 -2.0 SF Tdceps SF Subecapular
1
18.0 16.0 14.0 12.0 I0.0 8.0 m 6.0 4.0 2.0 0.0 -2.0Upper Arm Circumference
2.0 0.0 8.0 6.0 r 4.0 2.0 0.0 2.0 0 6 12 0 6 12 0 6 12
Months Months Months
12.0 10.0 - 8.0~ 6.0~ m 4.0~ 2.0 0.0 -2.0 BMI u 0 6 12 Months
2.0 Sitting Height 2.0 Armspan 2.0 Foot Length
1.0 0.0 m-l.0 D -2.0 -3.0 -4.0 0.0 r -2.0 -4.0 0.0 u) -2.0 -4.0 0 6 12 0 6 12 0 6 12
Months Months Months
0.0 -
-2.0
-4.0
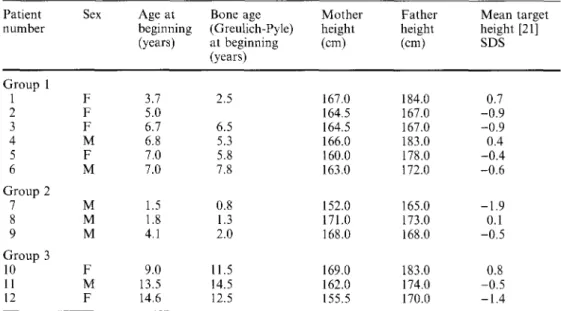
Fig. 1 Auxology values (SDS) of group 1 (3.8-7.0 years; n = 6; mean • 1 SD) during 1 year of treatment
Hand Length 2.0
0 6 12
Physical activity pattern (parents" opinion)
Parents' impression was obtained by means of a semistructured interview prior to the treatment, and after 6 and 12 months. This interview consisted (1) of open-ended questions on the changes to which the parents gave an answer by freely reporting what they had noticed; and (2) of specific questions relating to physical activity, namely on the differences compared to siblings and other children, on the activity itself (kind of activity, favourite activity, endurance) and differences found compared to the pre-treatment situation. F o r example: when parents told in the interview a b o u t their favourite family sport activity being the Sunday walk or an excursion on
bicycles, they were further asked a b o u t how long and intensive this activity was and how the child behaved during this activity or whether it complained.
Laboratory measurements
Blood samples were taken between 8 a.m. and 9 a.m., after a 12-h overnight fast. I G F - I was measured in sera after acid ethanol ex- traction as described [31]. Tests of significance were performed with One Sample Wilcoxon test, a P value of less than 0.05 was con- sidered significant. 2.0 0.0 -2.0 ( n -4.0 Height e. o -6,0 -12 0 6 12 Months 2.0 8.0 Height Velocity 6.0 .~ . 9 4.0 .'/ ,, -2.0 0 6 12 Months
Weight Weight for Height
2.0 1.0 0.0 - 1 . 0 ", . . - " 9 ~ - 2 . 0 \ ." -6.0 -12 0 6 12 Months 2.0 1.0 0.0 -1.0 -2.0 ffl -3.0 -4.0 ~ i -5.0 -6.0 -12 0 6 12 Months 6.0 SF T d c e p s 5.0 4.0 3.0 ,,.,in 2 0 (n 1.0 0.0 -1.0 -2.0 -3.0 6.0 5.0 4.0 3.0 2.0 m 1.0 0.0 -1.0 -2.0 -3.0 SF Subscapular ~ ,,, ",, 0 6 12 0 6 12 Months Months
Upper Arm Circumference
6.0 5.0 4.0 3.0 2.0 r 1.0 0.0 .0 "~ ~ -2.0 -3.0 . ~ 1 7 6 6 12 Months 1.0 0.0
~
-1.0 -2.0 -3.0 BMI ?., _2,,_. C. -- ," 6 12 Months3.0 Sitting Height 3.0 . Armspan
~
-1.0 -2.0 -3.0 -4.0 -5.0 2,0 1,0 0,0 9 1 4 9 1 7 6 1 7 6 .. o. 0.0~
-1.0 -2.0 -3.0 -4.0 -5.0 3.0 2.0 1.0 0.0~
-1.0 -2.0 -3.0 -4.0 -5.0 Hand Length ~ s ~ - _ . . . . s ~ ~ ~ ~ 1 7 6 1 4 9 1 4 9 0 6 12 0 6 12 6 12Months Months Months
U ) Foot Length 3.0 2.0 1.0 0.0 -1.0 " ~'~ 9 .2.0 -3.0 . ... o -4.0 ..'"" -5.0 6 12 Months
Fig. 2 Auxology values (SDS) of group 2 (0.6~. 1 years; n = 3) during 1 year of treatment ( Mean - - patient 7 - . - patient 8 9 .. patient 9)
16.0 14.0 12-0 10.0 u} 8.0 0 r 6.0 4.0 2-0 R e s u l t s A n t h r o p o m e t r i i c d a t a
Group 1 (n = 6, age 3.8-7.0 years) (Fig. 1)
D u r i n g t h e 1 2 - m o n t h t r e a t m e n t , h e i g h t i n c r e a s e d f r o m - 1 . 7 S D t o - 0 . 6 S D a n d g r o w t h v e l o c i t y i n c r e a s e d f r o m - 0 . 7 S D (6.0 c m / y e a r ) b e f o r e t r e a t m e n t t o 5.5 S D 6.0 Height 5.0 4.0 3.0 2.0 u3 1.0 O 0.0 _~- . . . -1.0 .o... - . . . -2-o
L - - . . - - - ~ -
-3.0 -4.0 . - . - " " -5.0 . . . ~" -12 0 6 12 Months 3.0 1.0 -1.0 7.0 He~htVeOoc~ r x 5.0 , - ,, ~ . . . #I .s" \ \ # - . . . -3.0 -6.0 0 6 12 Months(10.8 cm/year). Weight decreased from 1.1 SD before treatment to 0.4 SD after 12 months. However, weight change in relation to the reference data only insuffi- ciently illustrates the physical appearance in the sense of thin or fat, because growth velocity increased. Weight development in relation to height is a better approxi- mation to the phenotype. Weight for height decreased dramatically from 3.8 SD to 1.2 SD after 12 months and body mass index (BMI) from 3.5 SD to 1.1 SD (19.7 kg/m 2 to 16.8 kg/m2). The thickness of both
16.0 Weight 14.0 12-0 10.0 8.0 4.0 2.0 0.0 -2-0 . . . i -4.0 -12 0 6 12 MorlUts 16.0 14.0 12-0 10.0 8.O 6.0 4.0 2.0
Weight for He~ht
. . . . - ' " o ~ c. o.o -2.0 -4.0 -12 0 6 12 M o n t ~ 1.0 SFTdcepe 34.0 SFSubocapu~ 0.0 " - ' " " . . . -2-0 r o r 14.0 4.0
29.0 I',.
24.0""",...-*"
19.0 9.0Upper Arm Cin:=tm~rence 16.0 14.0 12-0 10.0 u) 8.0 r 6.0 ... 4.0 . . . 2.0 0.0 -Z0 -1.0 0 6 12 0 6 12 6 12
Monlt= Months Months
D 16.0 14.0 12_0 10.0 8.0 6.0 4.0 2.0 0.0 -2-0 BMI .. ,-." o.o." ...-- ...-, 6 12 Months
2.0 S ~ n g H e , he 2.0 /~=lOan 2.0 Foot Len~h
1.0 0.0 -1.0 -2-o -3.0 -4.0 . s " - f - I . . . . . . . . . 0.0 -1.0 t,/) e~ m.2-O -3.0
-4.0 -"
._.____-~
1 . 0 0.0- -1.0 (3 u~ -2.0 -3.0 -4.0 -5.0 -5.0 -5.0 0 6 12 0 6 12 0 6 12Monlhe Months Months
Fig. 3 Auxology values (SDS) of Group 3 (9.2-13.8 years; n = 3) during one year of treatment ( - - -" patient 11 ..- patient 12) 2.0 1.0 0.0 -1.0 0 u~ -2.0 -3,0 -4.0 -5.0 0 Mean - - Hand L e n ~ J 6 12 Months patient 10
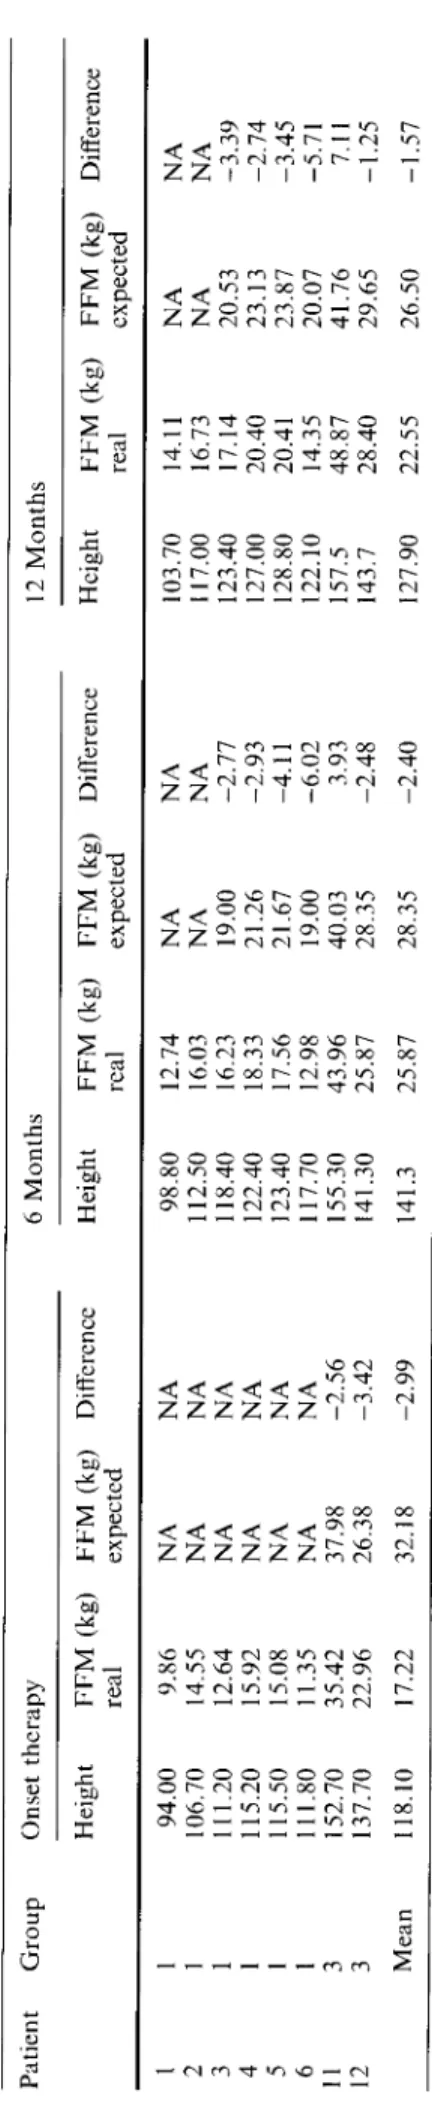
kg 2O % 8O 80 373 18 16 14 12 10 4 FFM (%) FFM (kg) " . ~ T = T I I -.'~', ! FM (%)
',
I " ~ , 2 ~ . - . ~ I t F M (kg) I I -- I I I I 70 60 50 40 30 20 10 70 60 A o~ 50 40 30 0 26 patient 12 -FFM patient 11-FM ~176176 ...0 " ' 0 " ' ' ' ' ' ' ' " patient 11-FFM - . . ~ . patient 12-FM " ' - . ~ 0 Mo6hsnt 12 0 M o n t h s 6 12Fig. 4A Fat free mass and fat mass (kg,%) of group 1 (n = 6; age 3.7-7.0) B Fat free mass and fat mass (%) of two patients of group 3 [age 14.6 (patient 12); 13.5 (patient 11)]
skinfolds decreased as treatment progressed, both over the triceps (from 3.4 SD to -0.4 SD) and subscapularly (from 11.8 SD to 2.3 SD). Arm circumference dropped from 1.8 SD to 0.4 SD. In terms of SDS difference, the increase in hand length (from -1.5 SD to -0.4 SD), foot length (from -2.2 SD to -1.3 SD), arm span (from -1.6 SD to -0.5 SD) and sitting height (from -2.5 SD to
- 1 . 4 SD) was similar to the increase in height.
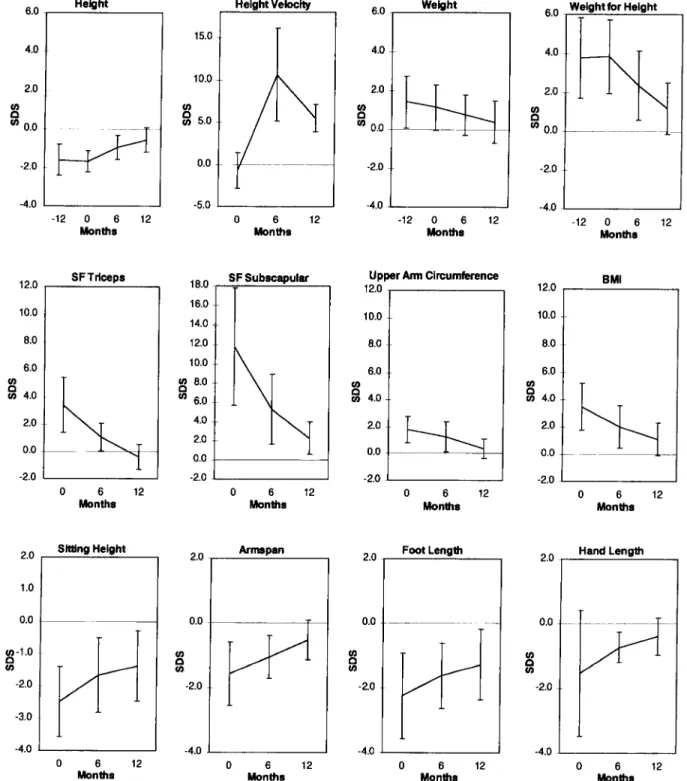
Group 2 (n = 3, age 0.6 to 4.1 years) (Fig. 2)
Height increased from -2.4 SD to -1.2 SD. But in con- trast to the older children of group 1, these very young and initially underweight children showed an increase in weight for height from -2.0 SD to -0.9 SD. However, skinfolds decreased, both over the triceps (0.3 SD to -1.5 SD) and subscapularly (from 2.4 SD to -0.6 SD). The other parameters changed similarly to those of group 1.
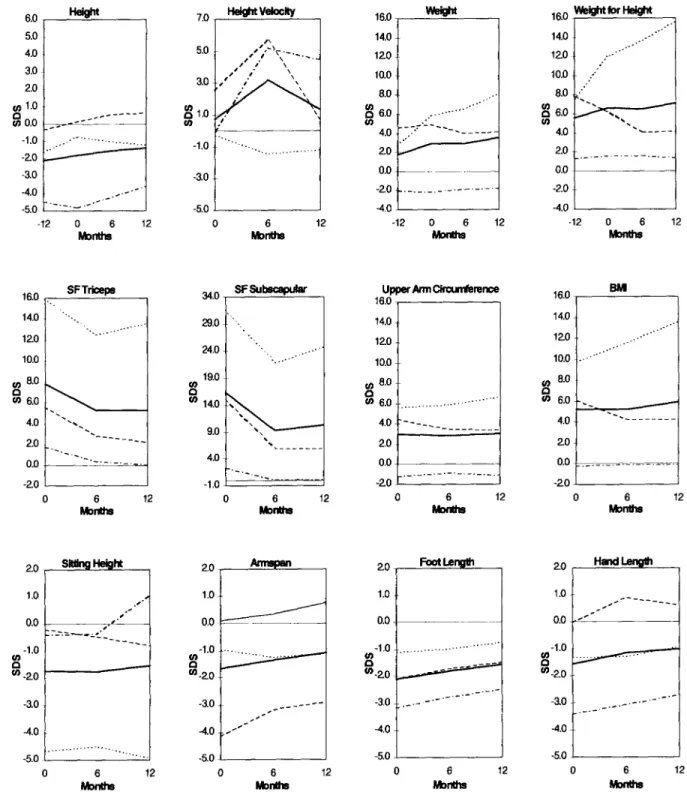
Group 3 (n = 3, age 9.2 to 14.6 years) (Fig. 3)
subscapularly from 16.3 SD to 10.3 SD) in the presence of an unchanged arm circumference (3.0 SD).
Body composition
Body composition measured by DEXA (Fig. 4)
Only in older children (group 1 and 3) could body composition be determined by DEXA, due to the need for sedation in very young children. In one child of group 3, the second measurement could not be per- formed for technical reasons.
In group 1, fat tissue dropped from an initial 43 % to 29% (from 10.2 kg to 7.3 kg) after 12 months, which corresponds to a decrease of 35%, whereas fat free mass (FFM) increased from 57% to 71% (from 13.2 kg to 16.5 kg), representing a 24% increase. In group 3, fat tissue dropped from 54% to 50% (from 33.6 kg to 38.7 kg). F F M increased from 46% to 50% (from 29.2 kg to 38.6 kg).
The results of group 3 reflect the small size and hetero- geneity of this group, due to the major differences in height and particularly in weight and bone age. Height increased only moderately from -1.8 SD to -1.4 SD. Weight for height increased further from 6.6 SD to 7.1 SD, but even in these patients, skinfolds decreased, al- though to a lower extent (triceps from 7.8 SD to 5.3 SD;
Physical performance
Anaerobic performance measured on the ergometer (Table 3)
This test was performed with four children of group 1, all of them approx. 7 years of age at the beginning of the
treatment (age distribution 6.8-7.0 years) and with one child of group 3, since one child of group 3 was too handicapped and the other one too obese to perform this test. The other children were too short.
Table 3 shows the results of the WANT. There was an increase in peak and mean power per kg body weight in group 1 from pre-treatment to 12 months later. The increase, whether expressed per kg body weight or as a percentage of a normal population, all showed an in- crease which nearly reached significance (P = 0.08- P = 0.05).
Physical activity pattern." parents' opinion
Parents, physiotherapists and paediatricians unani- mously reported an increase in physical activity and performance. At the same time, the children became more attentive and more lively, which made them more independent, more self-assured and less anxious.
The improvement in physical performance was the most important therapy effect for the parents, even more than the loss of weight. As an example, a walk with the family of 3 h had been impossible before treatment and was now possible without the child complaining. Like- wise, the children became able to climb up the wall bars or the climbing pole.
Serum concentrations of IGF-I (Fig. 5)
Before treatment, the children of our study had lower IGF-I serum concentrations when compared to those of age-matched normal-weight children (SDS: -0.6 + 0.8, P = 0.03) [32]. During hGH treatment, IGF-I (SDS: 2.0 + 1.4) rose to the supraphysiological range in the first 6 months and remained stable thereafter.
Discussion
GH treatment led to remarkable clinical and auxological changes in the prepubertal and initially obese children with PWS. All prepubertal children showed an impres- sive increase in growth velocity and a distinct catch-up growth. In terms of SDS difference, the increase in foot length, hand length and arm span was of the same order as the increase in height. One year into treatment, mean height was still below the age-related mean, but catch-up growth continued.
All prepubertal children, who were obese before treatment, showed a distinct decrease in weight for height, BMI, skinfolds thickness and body fat measured by DEXA, but after the 12-month treatment period, not all body fat parameters had dropped to the normal range and body fat was still elevated. Subscapular fat was greater than over the triceps, both before and after the 12-month treatment. Fat distribution, in PWS typi-
< • e D J
~5
:= I [ I I I Izzzzzz
< < < . < < ~ , ~ - -zzzzz
Table 3 Wingate anaerobic test
Group (n)
l ( n = 4)
3(n - 1)
Months Peak power Peak power Mean power Mean power
per kg %norm per kg %norm
0 12 0 12 3.36 • 0.63 57.52 • 7.12 3.05 • 0.47 58.9 • 8.4 6.42 • 1.32 100.4 • 16.1 4.54 • 0.54 82.5 • 9.4 3.9 41 2.6 39 5.7 57 3.9 57 375 u) P, 3.5 3.0 2.5 2.0 1.5 1.0 0.5 0.0 -0.5 -1.0 -1.5 I G F - I I - I 0 6 12 Months
Fig. 5 IGF-I of all subjects (0.(~13.8 years; n = 12; mean • 1 SD) during 1 year of treatment
cally concentrated on the trunk [20], is maintained even after 12 months of treatment.
Estimates based on anthropometric measurements and D E X A measurements revealed a distinct increase in lean body mass (LBM), both in relative figures (%) as well as absolutely (kg). Arm circumference dropped much less than triceps skinfolds, suggesting that the LBM increase exceeded the normal growth-related in- crease that one would expect.
The results of the anaerobic performance test con- firmed, at least in the older prepubertal children, that the increase in muscle mass was accompanied by an im- provement in physical performance. Parents reported that the children showed a higher physical activity and also much more enjoyed it, which is of particular inte- rest. G H treatment seems to bring about not only an increase in muscle mass and physical performance, but also to cause the children to be more active, which may, additionally to the direct effects of GH, also have a positive influence by increasing energy expenditure and muscle mass and decreasing body fat.
In the very young children who were underweight at the beginning of treatment, an increase of weight for height was seen, almost exclusively due to an increase of LBM, since subcutaneous fat decreased. G H treatment in young and older children therefore seems to have the same effects with the exception of weight, probably be-
cause, in very young children, muscle mass increase outweighs body fat decrease.
The pubertal obese children showed a tendency for the same changes as the younger children, even though to a far lower extent. The small sample size and heter- ogeneity of the group as regards weight, height and bone age render conclusions difficult. In addition, all three patients had a non-substituted partial gonadotropin deficiency. Generally, only a moderate increase in height was observed, probably due to insufficient sex steroid levels and advanced bone age. Nevertheless the SDS increase in hand length, foot length and arm span was found to be of a similar order to the increase in body height. Weight for height rose further, but skinfolds decreased, even though to a lower extent than in the other groups.
Treatment effects in terms of height, weight, and weight for height were in agreement with earlier publi- cations [2, 15, 16, 24, 29]. It was not possible to compare effects on growth of the extremities, changes in physical performance and physical activity, because to our knowledge, these effects have not been studied so far.
As other authors, we found some evidence in favour of a hypothalamic G H D in PWS: pre-treatment IGF-I was significantly lower than in normal-weight children, but not as low as expected in G H D . This m a y be ex- plained by the fact that IGF-I is related to food intake and is increased in normal obese children [18, 30]. Moderately reduced IGF-I levels in PWS therefore constitute an argument in favour of G H D . Furthermore, increased total body fat as well as decreased absolute F F M is a typical finding in G H D [17, 25, 27]. By con- trast, in simple obesity, increased total body fat is found together with increased absolute F F M [10] which is probably due to the fact that it simply needs more muscle mass to carry around a heavy body. Therefore, we tried to compare absolute F F M measured by D E X A with normal data. So far, however, there are very few reference values for the absolute F F M in children. Lazarus et al. [13] have published standards based on age quintiles and sex. These tables contain age and the corresponding mean height. Since PWS children are below average in height, we plotted their data against height in the table, and not against the age. By inter- polating height data we calculated the corresponding expected F F M in kilograms and compared it to the real absolute F F M in kg of the relevant child (see Table 2). At the beginning of the treatment, however, the children of the study were too young and too small for the ref- erence data. Therefore, this comparison could only be
made 6 and 12 months into treatment and only in six out o f nine children. Absolute F F M was found to be lower than expected after 6, but also after 12 months. The mean difference between real and expected absolute muscle mass was - 2 . 4 kg after 6 months and - 1 . 6 kg after 12 months. Formally, it was not possible to prove a reduced F F M before treatment due to the lack o f normal values for small children, but extrapolation of 6- and 12-month data, as well as the assessment o f anthropometric data m a y allow the conclusion that F F M was also reduced before treatment, as it is the case in G H D .
G H treatment in PWS leads to marked changes. Weight for height decreased in overweight children and increased in underweight children. Body fat decreased and an increase in growth velocity and height, as well as in growth of hands and feet was seen. With the increase in muscle tissue, physical performance improved. Par- ents, care personnel and physiotherapists were highly pleased a b o u t the higher physical activity and report that the children now much more enjoy physical activity.
Age-related evaluation o f our data suggests that if G H treatment is taken into consideration, it should be instituted as early as possible, in any case before pu- bertal development sets in. In pubertal children, treat- ment-induced changes were poor, which m a y partly be attributed to the non-substitution o f the partial gonad- otropin deficiency. Based on further evidence o f G H D in PWS and because o f the supraphysiological I G F - I levels under treatment, it m a y be concluded that the admin- istrated, moderately supraphysiological G H dosage was too high. Further studies with physiological substitution dosage should follow.
Acknowledgements We would particularly like to thank Pharmacia and Upjohn for making the growth hormone available and Dr. L. Molinari for his assistance in data analyses. Our special thanks goes to the PWS-Vereinigung Schweiz and the parents and their PWS children for their great commitment and efforts.
References
1. Angulo M, Castro-Magana M, Uy J (1991) Pituitary Evalua- tion and Growth Hormone Treatment in Prader-Willi Syn- drome. J Pediatr Endocrinol 4:167 172
2. Angulo M, Castro-Magana M, Mazur B, Canas JA, Vitollo PM, Sarrantonio M (1996) Growth hormone secretion and ef- fects of growth hormone therapy on growth velocity and weight gain in children with Prader-Willi syndrome. J Pediatr Endo- crinol Metab 9:393-400
3. Bar-Or O (1987) The Wingate Anaerobic Test: an update on methodology, reliability and validity. Sports Med 4:381- 394
4. Bray GA, Dahms WT, Swerdloff RS, Fiser RH, Atkinson RL, Carrel X (1983) The Prader-Willi syndrome. A study of 40 patients and a review of the literature. Medicine 62:59-80 5. Burd L, Vesely B, Martsolf J, Korbeshian J (1990) Prevalence
study of Prader-Willi syndrome in North Dakota. Am J Med Genet 37:97-99
6. Butler MG, Meaney FJ (1991) Standards for selected anthro- pometric measurements in Prader-Willi syndrome. Pediatrics 88:853-860
7. Cappa M, Grossi A, Borrelli P, Ghigo E, Bellone J, Benedetti S, Carta D, Loche S (1993) Growth hormone (GH) response to combined pyridostigmine and GH-releasing hormone adminis- tration in patients with Prader-Labhard-Willi syndrome. Horm Res 39:31:51-55
8. Costeff H, Horm VA, Ruvalcaba R, Shaver J (1990) Growth hormone secretion in Prader-Willi syndrome. Acta Paediatr (Norway) 79:1059-1062
9. Fesseler WH, Bierich FR (1983) Untersuchungen beim Prader- Labhart-Willi-Syndrom. Monatszeitschrift Kinderheilkunde 131:844-847
10. Forbes GB, Welle SL (1983). Lean body mass in obesity. Int J Obesity 7:99-108
11. Gerver WJM (1988) Measurement of the body proportions in children, The Oosterwolde study. Academic Hospital Maast- richt, Department of Paediatrics, Limburg
12. Inbar O, Bar-Or O, Skinner J (1996) The Wingate anaerobic test. Human Kinetics, Champaign IL
13. Lazarus R, Baur L, Webb K, Blyth F (1996) Body mass index in screening for adiposity in children and adolescents: systematic evaluation using receiver operating characteristic curves. Am J Clin Nutr 63(4):500-506
14. Ledbetter DH, Riccardi VM, Airhart SD, Strobel RJ, Keenan SB, Crawford JD (1991) Deletions of chromosome 15 as cause of the Prader-Willi syndrome. N Engl J Med 304:325-329 15. Lee PDK, Wilson DM, Hintz RL, Rosenfeld RG (1987)
Growth hormone treatment of short stature in Prader-Willi syndrome. J Pediatr Endocrinol 2:31 34
16. Lee PDK, Hwu K, Henson H, Brown BT, Bricker JT, LeBlanc AD, Fiorotto MD, Greenbern F, Klish WJ (1993) Body com- position studies in Prader-Willi syndrome (PWS): Effects of growth hormone (GH) therapy. In: Ellis K J, Eastman JD (eds) Human body composition. In vitro methods, models and ap- plications. Plenum Press, Newark
17. Leger J, Carel C, Legrand I, Paulsen A, Hassan M, Czernichow P (1994) Magnetic resonance imaging evaluation of adipose tissue and muscle tissue mass in children with growth hormone (GH) deficiency, Turner's syndrome, and intrauterine growth retardation during the first year of treatment with GH. J Clin Endocrinol Metab 78:904-909
18. Loche S, Cappa M, Borrelli P, Faedda A, Crino A, Cella SG, Corda R, Miiller EE, Pintor C (1987) Reduced GH response to GHRH in children with simple obesity: evidence for soma- tomedin-C mediated inhibition. Clin Endocrinot 27:145 153 19. Nicholls RD, Knoll JHM, Butler MG, Karam S, Lalande M
(1989) Genetic imprinting suggested by maternal heterodisomy in non-deletion Prader-WiUi syndrome. Nature 342:281-284 20. Prader A, Labhart A, Willi H (1956) Ein Syndrom von
Adipositas, Kleinwuchs, Kryptorchismus und Oligophrenie nach myotonieartigem Zustand im Neugeborenenalter. Schweiz Med Wochenschr 86:1260-1261
21. Prader A, Largo RH, Molinari L, Issler C (1989) Physical growth of Swiss children from birth to 20 years of age. Helve- tica Paediatrica Acta [Suppl]: 52
22. Robinson WP, Bottani A, Xie YG, Balakrishman J, Binkert F, Machler M, Prader A, Schinzel A (1991) Molecular, cytoge- netic, and clinical investigations of Prader-Willi syndrome pa- tients. Am J Hum Genet 49:1219-34
23. Rosskamp R, Becker M, Soetadji S (1987) Circulating soma- tomedin C levels and the effect of growth hormone releasing factor on plasma levels growth hormone and somatomedin-like immunoreactivity in obese children. Eur J Pediatr 146:48-52 24. Ruvalcaba RH, Holm VA (1993) Effects of growth hormone in
Prader-Willi syndrome. A case report. Clin Pediatr (Phila) 32:292 295
25. Salomon F, Cuneo RC, Hesp RH, Sonksen PH (1989) The effects of treatment with recombinant human growth hormone on body composition and metabolism in adults with growth hormone deficiency. N Engl J Med 321:1797-1803
26. Schoeller DA, Levitsky LL, Bandini LL, Dietz WW, Walczak A (1988) Energy Expenditure and Body Composition in Prader- Willi Syndrome. Metabolism 37:115-120
377 27. Tanner JM, Whitehouse RH (1967) The effect of human growth
hormone on subcutaneous fat thickness in hyposomatotrophic and panhypopituitary dwarfs. J Endocrinol 39:263-275 28. Tolis G, Lewis W, Verdy M, Friesen HG, Soplomon S, Pagalis
G, et al (1974) Anterior pituitary function in the Prader-Lab- hart-Willi (PLW) syndrome. J Clin Endocrinol Metab 39:1061- 1066
29. Trygstad O, Veimo D (1993) Growth hormone treatment in Prader-Labhart-Willi syndrome (abstract). Pediatric Res 33 [Suppl]: 40
30. Wabitsch M, Blum WF, Heinze E, B6ckmann A, Haug C, Mayer H, Teller W (1996) Insulin-like growth factors and their
binding proteins before and after weight loss and their associ- ations with hormonal and metabolic parameters in obese ado- lescent girls. Int J Obesity 20:1073-1080
31. Zapf J, Walter H, Froesch ER (1981) Radioimmunological determination of insulin-like growth factors I and II in normal subjects and in patients with growth disorders and extrapan- creatic tumor hypoglycemia. J Clin Invest 68:1321 1330 32. Zapf J, Froesch ER. IGF-I actions on somatic growth; Chapter
22: Hormonal control of growth in: Handbook of Physiology, HM Goodman (ed.), in press

![Fig. 4A Fat free mass and fat mass (kg,%) of group 1 (n = 6; age 3.7-7.0) B Fat free mass and fat mass (%) of two patients of group 3 [age 14.6 (patient 12); 13.5 (patient 11)]](https://thumb-eu.123doks.com/thumbv2/123doknet/14862952.636068/6.891.164.723.83.531/fig-fat-free-group-patients-group-patient-patient.webp)